



Abstract
Theories of density dependence emphasize the role of competition and legitimation in organizational life. However, agglomerative configurations and ecological processes vary substantially over space, resulting in heterogeneous sub-populations which organizations select into by choosing locations. Using geostatistical data constructed from form-990 submissions and the American Community Survey, this article studies the role of location and density in the operations of nonprofits using generalized additive models. After controlling for organizational and neighborhood features, the results show substantial variation in the effect of location on total and contributed revenue. Nonprofit density is positively associated with the location effects across a range of distances. The results suggest organizations benefit greatly from locating in high-density regions and may be most sensitive to variation in density in their immediate proximity. The study emphasizes location dependence through the importance of location and the intra-county distribution of nonprofits.
Introduction
The nonprofit sector continues to grow in terms of total revenue, assets, and organizations. Much of this growth has occurred in regions already home to many nonprofits, further increasing nonprofit density in these areas (Brandtner & Dunning, 2020). Given the increased crowding of the nonprofit sector, scholars have often studied the degree to which organizations may compete for resources, collaborate, or otherwise benefit from those nearby (Guo & Brown, 2006; Hager et al., 2004; Paarlberg et al., 2018; Paarlberg & Hwang, 2017; Sullivan et al., 2023; Thornton, 2006). While this literature has assisted in understanding how nonprofit behavior and operations may change in response to density or crowding, it has often focused on broad understandings of density and has not accounted for the role of location in organizational and evolutionary processes.
Entrepreneurs typically choose their programs or services, as well as their location. For nonprofits, the choice of location has implications for their viability as well as the development of the civic and social fabric of their region (Crubaugh, 2020; Mayer, 2023b; Swaminathan, 1996; Wo, 2018). Conceptually, the choice of location is a balancing act as organizations seek to avoid competition while maximizing access to resources, and evolutionary theories suggest those that survive in competitive environments will be stronger in the long run (Hannan & Freeman, 1989). Evolutionary processes, such as competition and legitimation, originate at local levels, making the understanding of organizational location and the behavior of organizations at local levels a key theoretical concern (Cattani et al., 2003; Wezel, 2005). Furthermore, evolutionary processes vary substantially over space (often called “location dependence”) and spatial heterogeneity can confound the relationships between other variables (Greve, 2002; Lomi, 1995).
Despite a rich ecological tradition in the nonprofit literature, the role of location in organizational processes and its relationship to density remains poorly understood. This article contributes to the literature related to the ecology of the nonprofit sector by studying the intra-county implications of nonprofit density and embracing location dependence by entering nonprofit location as a key variable. By explicitly incorporating spatial elements into theory and analysis in the form of nonprofit location, this study contributes to a burgeoning literature related to spatial perspectives in nonprofit studies (Bielefeld et al., 1997; Da Costa, 2016; Never, 2016; Yan et al., 2014). While spatial considerations are important for designing appropriate methodological approaches, they also allow researchers to ask more detailed questions, enriching our understanding of nonprofit behavior and processes (MacIndoe & Oakley, 2023).
The paper begins by discussing theories of competition and the benefits of operating in regions dense with nonprofits, including theories of density and location dependence. It develops two research questions (RQs) related to the role of location and density in nonprofit operations: (1) Does location affect (total and contributed) nonprofit revenue? (2) How do the location effects relate to nonprofit density? These questions are addressed by pairing U.S. Census data (American Community Survey, hereon ACS) with geocoded information from form-990 submissions. These data allow a quantification of the effect of location on total and contributed revenue, controlling for important financial and neighborhood features. Finally, the article studies the relationship between the location effects and nonprofit density.
Carrying Capacity and Theories of Density
In the population ecology of organizations (organizational ecology), the upper limit of parametric growth models for population size is referred to as carrying capacity (Carroll, 1984), a point which indicates the maximum number of organizations that can be supported by a given level of resources. Carrying capacity has been instrumental in what Paarlberg and Varda (2009) describe as the “supply approach” to nonprofit density, which views nonprofit density as a function of resources. The supply approach is often paired with economic theories that frame nonprofit organizations as a response to market failures: over-restriction or under-provision of goods or services, or the inability to verify the quality of a good. Nonprofits solve market failure by filling the gaps, garnering public trust through the non-distribution constraint, and targeting services in response to expressed needs (Steinberg, 2003). In this sense, the nonprofit sector reflects the social and material conditions of the region (Grønbjerg & Paarlberg, 2001). Under the supply approach, when crowding increases, organizations compete for finite resources that can result in organizational exits (Grønbjerg & Paarlberg, 2001; Lecy & Van Slyke, 2013). However, entrepreneurs select locations where they expect to succeed, and access to resources and exposure to competition are not uniformly distributed over space, resulting in substantial heterogeneity by location (Lomi, 1995; Wezel, 2005). In addition, the presence of other features may disturb competitive effects, raising the region’s carrying capacity (Paarlberg & Varda, 2009), and increases in nonprofit density may alter the social structure of locales, enhancing their ability to create or attract nonprofits (Greve & Rao, 2012). The following sections explore existing theories of competition and density dependence.
Density as a Threat to Organizations
Early theorizing in organizational ecology suggested organizations fail most commonly in areas where organizational density was very high or very low (Amburgey, 1996). On the lower end, failure is driven by a lack of legitimacy, as organizational templates may not be socially recognized (Meyer & Rowan, 1977), while failure amid high density occurs through competitive processes (Hannan & Freeman, 1989). Competition is a threat to the extent that organizations seek the same resources, and nonprofits are regularly affected by competitive forces. Thornton (2006) shows that nonprofits decrease fundraising expenses when more organizations enter, suggesting that managers adjust to competition. Paarlberg et al. (2018) found a convex relationship between the number of months organizations can support their spending and nonprofit density. Similarly, Paarlberg and Hwang (2017) show United Ways experience decreases in contributions when foundations and federated funders enter their market. Foundations themselves are not unaffected by competition, experiencing decreases in grant making performance in regions with more nonprofits (Guo & Brown, 2006), and more nonprofits dissolutive in areas with high density (Lu et al., 2020; D. J. Mayer, 2022).
The Benefits of Operating in High Density
Despite the deleterious effects of competition that may result from operating in high organizational density areas, high density may also provide benefits to nonprofits. Organizations of all types, public, for profit, or nonprofit, commonly provide similar services (Salamon, 1999), raising the possibility of competition. However, direct competition can be avoided by appropriately differentiating services or specializing (Baum & Oliver, 1996; Baum & Singh, 1996), and organizations may be hardened by exposure to competition, resulting in improved processes (Hannan & Freeman, 1989). Guo and Brown (2006) illustrate this when they show that foundations may specialize in areas with high density, resulting in more efficient management, and Sullivan et al. (2023) find organizations focused on homelessness increase outputs when organizational density increases. Yet, the benefits of density are not limited to specialization, as operating in areas of high density may give nonprofits access to resources they may otherwise not have, including existing materials, labor and skills, buildings and space, legitimacy, opportunities for collaboration, and the possibility of network connections (Arenas et al., 2021; Hannan & Freeman, 1989; Meyer & Rowan, 1977; Paarlberg & Varda, 2009; Wiewel & Hunter, 1985).
Studies of nonprofit density using small geographic units, such as U.S. census tracts or local Authorities in the United Kingdom, show density is positively related over time (McDonnell et al., 2020; Wo, 2018). While organizations enter markets by selecting locations where they may be successful in meeting their mission (Woo & Jung, 2023), locations differ dramatically with respect to organizational density, norms of behavior, governance strategies, reputation, and resource abundance (Lomi, 1995). Consequently, the location of the organization has implications for its viability, as well as their ability to develop relationships, and become embedded to obtain legitimacy and access resources (Greve, 2002; Swaminathan, 1996). One reason for this is the spatial variation in legitimacy. In organizational theory, legitimacy describes the social acceptability of the organizational form (Aldrich & Fiol, 1994), and locating in a region dense with similar organizations can quickly increase the organization’s legitimacy (Hannan & Freeman, 1989; Wiewel & Hunter, 1985). Although important across contexts, legitimacy is of particular consequence to nonprofit organizations, as they are commonly organized around ambiguous core technologies and cannot demonstrate legitimacy in ways common among for-profits, rather, they often rely on symbolic practices (Newman & Wallender, 1978). One-way nonprofits establish legitimacy is through their choice of location. Locating near their target population or consumers demonstrates a commitment to the mission, a desire to decrease barriers to access, and assurance the community acknowledges the value of their goals (Bielefeld et al., 1997; Joassart-Marcelli & Wolch, 2003; Woo & Jung, 2023).
Locating near similar organizations suggests that the organizational form is likely acceptable (Hannan & Freeman, 1989). However, given increasing localization, the marginal effects of density on legitimacy are often higher in areas with more organizational activity, as particular locations may become disproportionally important to a region’s economic activity (Wezel, 2005). For example, Wiewel and Hunter (1985) show the process of obtaining legitimacy is expedited for new organizations in areas of high density as they may invoke the success of similar organizations or use connections to gain access. Selecting into an area dense with similar organizations is a viable strategy for new nonprofits to access resources, as they often have fewer means of fending off competition (Hager et al., 2004). However, legitimacy also restricts the possibilities open to organizations, and maintaining legitimacy necessitates obeying prevailing structures (Hannan & Freeman, 1989; Meyer & Rowan, 1977). The trade-off is generally one nonprofits are willing to make, as increasing legitimacy enhances the organization’s viability by warding off competition and obtaining resources that are not otherwise accessible (Hager et al., 2004; Pfeffer & Salancik, 2003; Walker & McCarthy, 2010).
When organizations select a location, they may also select into networks, as network ties commonly emerge from spatial colocation (Hawley, 1986; Porter & Powell, 2006; Wiewel & Hunter, 1985). Theories of networks and embeddedness are closely connected, as organizations that have existed longer have had more time to develop connections with key actors, such as those in government, as well as facilitate trust and deeper relations with surrounding communities (Hager et al., 2004; Hannan & Freeman, 1989; Paarlberg & Varda, 2009). Baum and Oliver (1992) show organizations are more likely to survive if they have connections to government officials, a feature that is increasingly common among nonprofits as they are frequent participants on task forces and occupy other governance roles (Mosley, 2020). Connections outside government officials are important as well, as they may yield increased fundraising capability and enhance the regions carrying capacity through trust (Paarlberg & Varda, 2009; Ressler et al., 2021). Of course, organizations often begin with a level of embeddedness, as founding an organization requires a combination of resources, including legitimacy, time, power, and wealth, that are commonly accessed locally through networks (Stinchcombe, 1965). Fundamentally, locating nearby other nonprofits can yield material benefits and enhance the viability of the organization.
Research Questions: Nonprofit Density and Location
The literature investigating nonprofit density has often relied on aggregate measures, such as the concentration of organizations in a county, zip code, or the total size of the nonprofit sector’s fundraising efforts in a larger region or city (Lecy & Van Slyke, 2013; Paarlberg et al., 2018; Paarlberg & Hwang, 2017; Ressler et al., 2021; Thornton, 2006). While this assists in understanding population-level trends, it has not accounted for the substantial location heterogeneity present in the evolutionary processes of competition and legitimation (Cattani et al., 2003; Lomi, 1995; Wezel, 2005). Location is of great importance in determining embeddedness, legitimacy, and resource access, which has implications for the region’s carrying capacity (Joassart-Marcelli & Wolch, 2003; Paarlberg & Varda, 2009; Porter & Powell, 2006; Ressler et al., 2021). Consequently, this article incorporates nonprofit location, measured using precise longitude and latitude, into sociological understandings of nonprofit density. This leads to investigating the effect of location on aspects of nonprofit performance and its relationship to nonprofit density, captured in the following RQs:
Methods and Materials
In the United States, states are subdivided into counties and county equivalents, administrative boundaries which correspond to political and governmental authorities. Grønbjerg and Paarlberg (2001) suggest designating a county as the study region is advantageous as it corresponds to the boundaries of planning in areas of public and social welfare. This study focuses on Cuyahoga County Ohio, a county in the Midwest of the United States with land mass of just over 1,200 square miles and a resident population just over 1.2 million. Cuyahoga County is also a unique choice for a study of the nonprofit sector as it maintains a vibrant tradition of strong public charities and is home to some of the oldest community foundations and federated organizations (see Roudebush & Brudney, 2012). Although Cuyahoga County is home to many high- and middle-income communities, it also contains the city of Cleveland, which regularly ranks among the poorest big cities in the nation.
The unit of analysis is the nonprofit organization, identified using data from form-990, the “Return of Organization Exempt from Income Tax,” a form filed by a wide variety of nonprofit organizations in the United States. The basic information required on form-990 includes the total revenue and revenue sources for the organization, as well as their expenses, and spending categories over the past year. The main sources of revenue for U.S. nonprofits include program services and contributions (Seaman & Young, 2018). Program service revenue typically includes fees for service, while contributed revenue includes other grants and gifts of money or property. In this study, organizations are identified from the 2016 Business Master File (BMF), a file provided by the Internal Revenue Service (IRS) that lists all current nonprofit organizations that have submitted a variety of tax forms or requests for exemptions. The BMF is also provided by the National Center for Charitable Statistics (NCCS), which offers additional variables to assist researchers.
In the United States, exempt organizations are categorized as public charities and private foundations. Public charities include organizations like churches, human service organizations, and schools, which receive revenue from fundraising and/or create revenue from activities that further the mission. Private foundations encompass all other tax-exempt organizations, including some charitable trusts (IRS, n.d.). Supporting organizations represent a subset of public charities, which may be established by a single individual, family, or other organization, to support a public charity. This study excludes private foundations and supporting organizations, as they are often distinct in purpose and operations, and consequently may distort estimates of nonprofit density (e.g., large organizations may establish a supporting organization). This also makes the sample comparable to other recent research, as U.S. public charities are analogous to charities registered with the Charity Commission of England and Wales (McDonnell et al., 2020).
To identify active organizations and obtain a more accurate count, organizations that had not filed a 990 (of any type) in the past 2 years were also excluded from the sample. Although the BMF provides the most accurate counts of active organizations, it provides limited financial information about nonprofits. For this reason, this study also uses the 2016 Core File provided by the NCCS, which contains richer information related to expenses and revenue drawn from the form-990. Although a valuable data source for financial information, the core files are known to often contain erroneous information. Following the extant literature, observations with implausible information are removed, including negative revenue, negative expenses, negative assets, or any category of revenue or expenses in excess of the amount listed in “total” (Bowman et al., 2012; Feng et al., 2014).
Dependent Variables: Total and Contributed Revenue
The revenue obtained by an organization represents its access to material resources, and increases in revenue may allow organizations to develop equity or otherwise expand and improve services (Young, 2007). Prior research on the effects of nonprofit density has often focused on expenses and revenue in areas of contributions and fundraising (Paarlberg & Hwang, 2017; Ressler et al., 2021; Thornton, 2006). However, nonprofit organizations compete and collaborate in many areas, and it is unlikely that many of the benefits of density discussed above, including its effects on legitimacy, embeddedness, resource sharing, or specialization, are limited to contributions or fundraising (Guo & Brown, 2006; Paarlberg et al., 2018; Paarlberg & Varda, 2009; Porter & Powell, 2006). Consequently, total revenue is the key outcome used in this study. Yet, in light of the prior literature’s emphasis on contributed revenue and fundraising as the site of competition among nonprofits (such that it may respond differently to variation in density), contributed revenue is studied as well (Paarlberg & Hwang, 2017; Ressler et al., 2021; Thornton, 2006).
Key Independent Variables: Location and Nonprofit Density
The two key independent variables are the organization’s location and nonprofit density. The organization’s location is obtained from the addresses listed on the tax submission, which were geocoded to obtain latitude, longitude, and the corresponding census-tract codes. In this study, location is measured using the latitude and longitude obtained from geocoding, as a result multiple nonprofits in the same census tract may have different locations. Organizations that list a post office box have presented a challenge for researchers geocoding tax forms and solutions have ranged from exclusion (Rafter, 2008) to placing them at the address of the post office assuming they are nearby (Yan et al., 2014). After excluding inactive organizations, 13% of the remaining organizations listed a post office box, the majority of which did not submit financial information. Given this study’s focus on density, as accurate a count as possible is required, consequently, this study follows Yan et al. (2014) and places them at the post office. 1 The geocoding rate was just over 99%, leaving 3,639 active organizations with location information. Although the BMF provides the most accurate list of active organizations, it provides limited financial information, consequently, located nonprofits were matched with their submissions in the NCCS Core file (containing 990 and 990-EZ) to obtain financial information. In total, 1,875 nonprofits filed financial information, 1,518 of which reported nonzero contributed revenue.
Nonprofit density is measured by the number of active organizations in a level of aggregation, the choice measure among nonprofit scholars (among others, see Jeong & Cui, 2020; Lecy & Van Slyke, 2013; Paarlberg et al., 2018; Paarlberg & Hwang, 2017). However, the choice for the level of aggregation is crucial to understanding the variance in ecological processes (Amburgey, 1996), and while density may be better specified locally (Greve, 2002), there is little prior information in nonprofit literature about the appropriate level of aggregation. Consequently, a range of distances are entertained to address the second research question: density is aggregated using a quarter-mile radius to a five-mile radius, incrementing by a quarter mile.
Control Variables
The age of an organization has implications for its connections to the community, as well as its identity and access to resources (Carroll & Hannan, 2000). In this sense, older organizations may have higher revenue and broader access to resources (Yang & Aldrich, 2017). Accordingly, organizational age is measured by the organization’s ruling date, the year in which the organization was granted tax-exempt status. With total and contributed revenue as the key outcomes, other financial variables must be included to mitigate the occurrence of spurious relationships. The revenue an organization obtains is partly a function of its size, as larger organizations may have additional access to resources or services, staff, as well as be more established in their communities (DiMaggio & Powell, 1983; W. J. Mayer et al., 2012; Meyer & Rowan, 1977). In this study, organizational size is measured by total expenses, which obviates some problems with measuring size by assets (W. J. Mayer et al., 2012). Spending patterns may also affect the revenue an organization receives, as organizations focused on fundraising may be particularly susceptible to competition (Paarlberg & Hwang, 2017; Thornton, 2006), and donors may be reluctant to give to organizations that have higher spending on administration believing they are inefficient or wasteful (Tinkelman & Mankaney, 2007), lowering the amount the nonprofit receives in contributions. Sources of revenue, such as an organization’s focus on earned or contributed revenue, have similar implications for the amount it generates, as donative organizations may have higher revenue, on average (W. J. Mayer et al., 2012). For these reasons, the percent of revenue the nonprofit receives from program services and the percent of revenue from contributions, as well as the percent of expenses spent on administration and the percent of expenses spent on fundraising, are included as control variables.
Nonprofits respond to historical and social contexts (Woo & Jung, 2023), and research on nonprofit density has revealed differences in the capacity of communities to support nonprofits, as nonprofit density may respond to poverty and the racial composition of the neighborhood (Joassart-Marcelli & Wolch, 2003; McDonnell et al., 2020; Wo, 2018). Yet, neighborhood conditions may have ramifications for the financial health of organizations as well. Walker and McCarthy (2010) suggest organizations in lower resourced areas often struggle to access resources. Consistent with this idea, Lam and McDougle (2016) conceptualize financial health in the context of vulnerable communities and find human service nonprofits in minority communities have lower long-term capacity and liquidity. Furthermore, Lu et al. (2020) show that organizations have increased risk of dissolution in communities with a higher proportion of residents that identify as Black or African American. Residential mobility may also be important given the emphasis on location and legitimacy, as newer residents may have weaker connections with existing organizations. On the contrary, selecting into a neighborhood that promotes the mission and operations of organizations may facilitate enhanced resource access through legitimacy and a demonstrated commitment to the mission (Joassart-Marcelli & Wolch, 2003; Wiewel & Hunter, 1985), as Bielefeld et al. (1997) suggest “it may be unreasonable to expect communities to be adequately served by nonprofits not located near them” (p. 222). Fundamentally, the conditions of a neighborhood have implications for the location decisions of nonprofits and may have ramifications for their financial performance. Accordingly, data are obtained from the ACS (2012–2016 estimates) at the level of the census tract, including the percent of the tract that identifies as Hispanic or Latino, the percent that identifies as Black or African American, the percent of households with income under the federal poverty line, and the percent of households in the same home as 1 year ago.
Empirical Strategy
The data used in this study are geostatistical (“point-reference”) with organizations observed at pairs of latitude and longitude, accompanied by measurements about their financial structure, size, as well as information about the census tract in which they reside. Location dependence suggests the effects of location vary over space as a result of spatial variation in economic networks, legitimacy, and competition. Including the coordinates as a measure of location in a linear model would assume revenue is a linear function of the distance from “null island” (the intersection of the equator and prime meridian), a restrictive and unrealistic assumption. Rather, the research questions dictate the need for an empirical model capable of capturing complex spatial effects while incorporating a class of control variables. Although generalized linear models (GLMs) can incorporate nonlinearity through, for example, global polynomials, they may induce particular relationships and leave challenging choices for analysts such as the maximum degree (Harrell, 2015). Rather, this study employs generalized additive models (GAMs), a regression-based extension of the GLM that obviate these challenges and are capable of capturing more complex nonlinear behavior using penalized splines (Wood, 2017). GAMs estimate complexity from the data avoiding the challenging and subjective decisions in other methods by estimating a smooth function of the predictors, maintaining the GLM as a special case. In this study, the penalized splines allow a smooth trend to be estimated over nonprofit locations; at one extreme the model may estimate a unique effect for each pair of coordinates, while at the other extreme the model may show no variance in the effects of location. This study employs two-dimensional smooths, using thin plate splines which are optimal in terms of mean squared error, over the two dimensions of location: longitude and latitude (Wood, 2003). The splines include a cubic penalty that augments the likelihood function by discouraging extreme estimates and increasing smoothness. In this study, models are estimated by restricted maximum likelihood with a quasi-Poisson likelihood and log link function, as total and contributed revenue take integers that are positive and unbounded. The quasi-Poisson likelihood is chosen as it accommodates extra-Poisson variation in the outcome by allowing the variance to be a linear function of the mean. In addition, the log link function reduces the influence of extreme observations, similar to the log linear models (McCullagh & Nelder, 1989).
RQ1 involves examining the presence of an effect for location, which is addressed through model selection, comparing models with and without location components using the generalized likelihood ratio test (LRT). Having estimated the location effects for nonprofits with complete financial data, all active organizations are incorporated by calculating pairwise distances between active nonprofits in the BMF with the same inclusion criteria described above. The BMF is selected as it provides the most reliable data on counts of U.S. nonprofits (Crubaugh, 2020; Wo, 2018; Yan et al., 2014). 2 Having obtained the coordinates of each nonprofit, as well as its distance from other nonprofits in the sample, counts of nonprofits are calculated by aggregating within a radius for each organization. This yields, for example, the number of active nonprofits within a mile (in any direction), for each nonprofit in the sample. The location effects obtained from the GAM are then regressed on the number of organizations within the radius, using linear models estimated by ordinary least squares, addressing RQ2. This strategy is carried out for total and contributed revenue. The modifiable area unit problem (MAUP) describes a bias encountered when events are aggregated at a geographic unit of interest. When estimating the location effects, the MAUP is not a concern as the data are based on organizations, and the location effects can vary between coordinates. When estimating the relationship between nonprofit density and the location effects, the MAUP is a greater concern. However, this study employs a range of distances: a quarter-mile radius to a five-mile radius, incrementing by a quarter mile, which shows the sensitivity of the results to the choice of radius as well as the marginal effect of nonprofits at a given distance.
Although all independent variables are included in the models for total revenue, the percent of revenue from contributions and program services are omitted from the model for contributed revenue, which includes only organizations that report nonzero contributed revenue. A description of the variables collected for this study and select descriptive statistics are shown in Table 1. They show that organizations in the sample receive most of their revenue from contributions or program services and spend little on fundraising and officers. It also shows the average organization is 25 years old in 2016. Compared to the county as a whole, the organizations in the sample tend to locate in census tracts with lower mobility (84.13), fewer residents that identify as Black or African American than the average tract in the county (37.28), with a similar average poverty rate (22.22) and percent of the population that identify as Hispanic or Latino (5.55).
Descriptions and Statistics of Study Variables (N = 1,875).
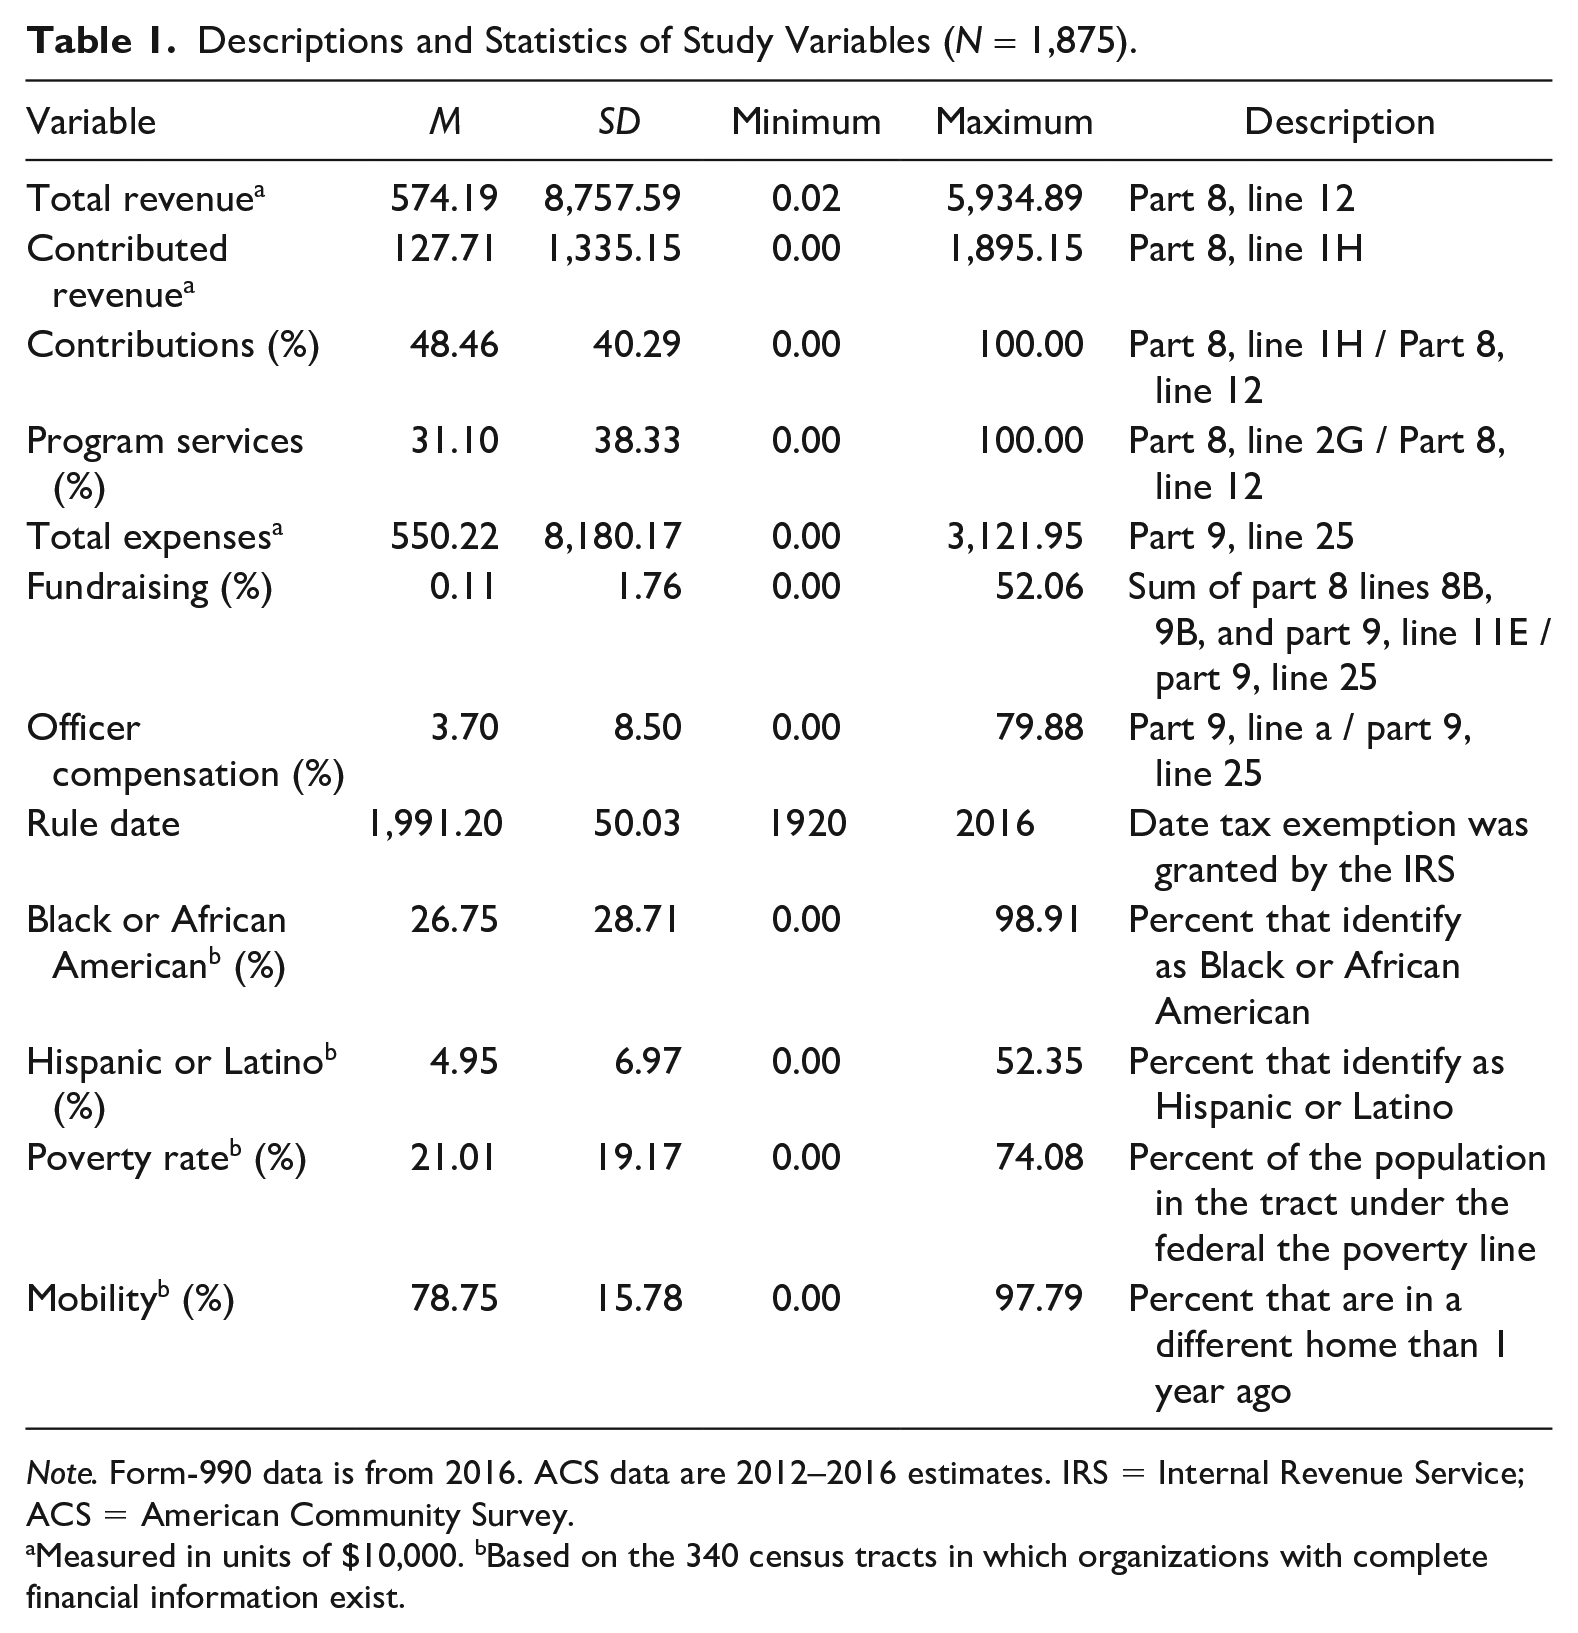
Note. Form-990 data is from 2016. ACS data are 2012–2016 estimates. IRS = Internal Revenue Service; ACS = American Community Survey.
Measured in units of $10,000. bBased on the 340 census tracts in which organizations with complete financial information exist.
Results
Models for total and contributed revenue are fit with the variables described in Table 1, with and without location effects, the results of which are shown in Tables 2 and 3, respectively. Note that in all models the covariates are mean centered and scaled to a sample variance of one to facilitate interpretation. Table 2 shows total expenses, the percent of revenue from contributions, as well as the percent from program services, are positively associated with total revenue. The organization’s rule date is negatively associated with total revenue, implying younger organizations have lower revenue, on average. The only tract level measure significant in Model 1 is residential mobility; however, this estimate is reduced greatly, while two others become significant, when the location effect is entered in Model 2. Model 2 suggests an increase of roughly 30% in the share of the tract that identify as Black or African American predicts a decrease of 35% in total revenue, with a wide interval estimate. Holding all other variables constant, an increase of 20% in the poverty rate predicts an increase of roughly 80% in total revenue. The location effect in Model 2 improves fit substantially, seen in the significance test (LRT), explaining an additional 21% of the deviance, which suggests the location is an important component of total revenue.
Quasi-Poisson GAM: Results and Model Comparison, Spatial Variation in Total Revenue (N = 1,875).

Note. All variables are mean centered and scaled to unit variance. p-value on the deviance explained corresponds to the LRT comparing models. GAM = generalized additive model; EDF = effective degrees of freedom; LRT = likelihood ratio test.
EDF is the effective degrees of freedom of the smooth estimated from 500 basis functions.
p < .05. **p < .01. ***p < .001.
Quasi-Poisson GAM: Results and Model Comparison, Spatial Variation in Contributed Revenue (N = 1,518).
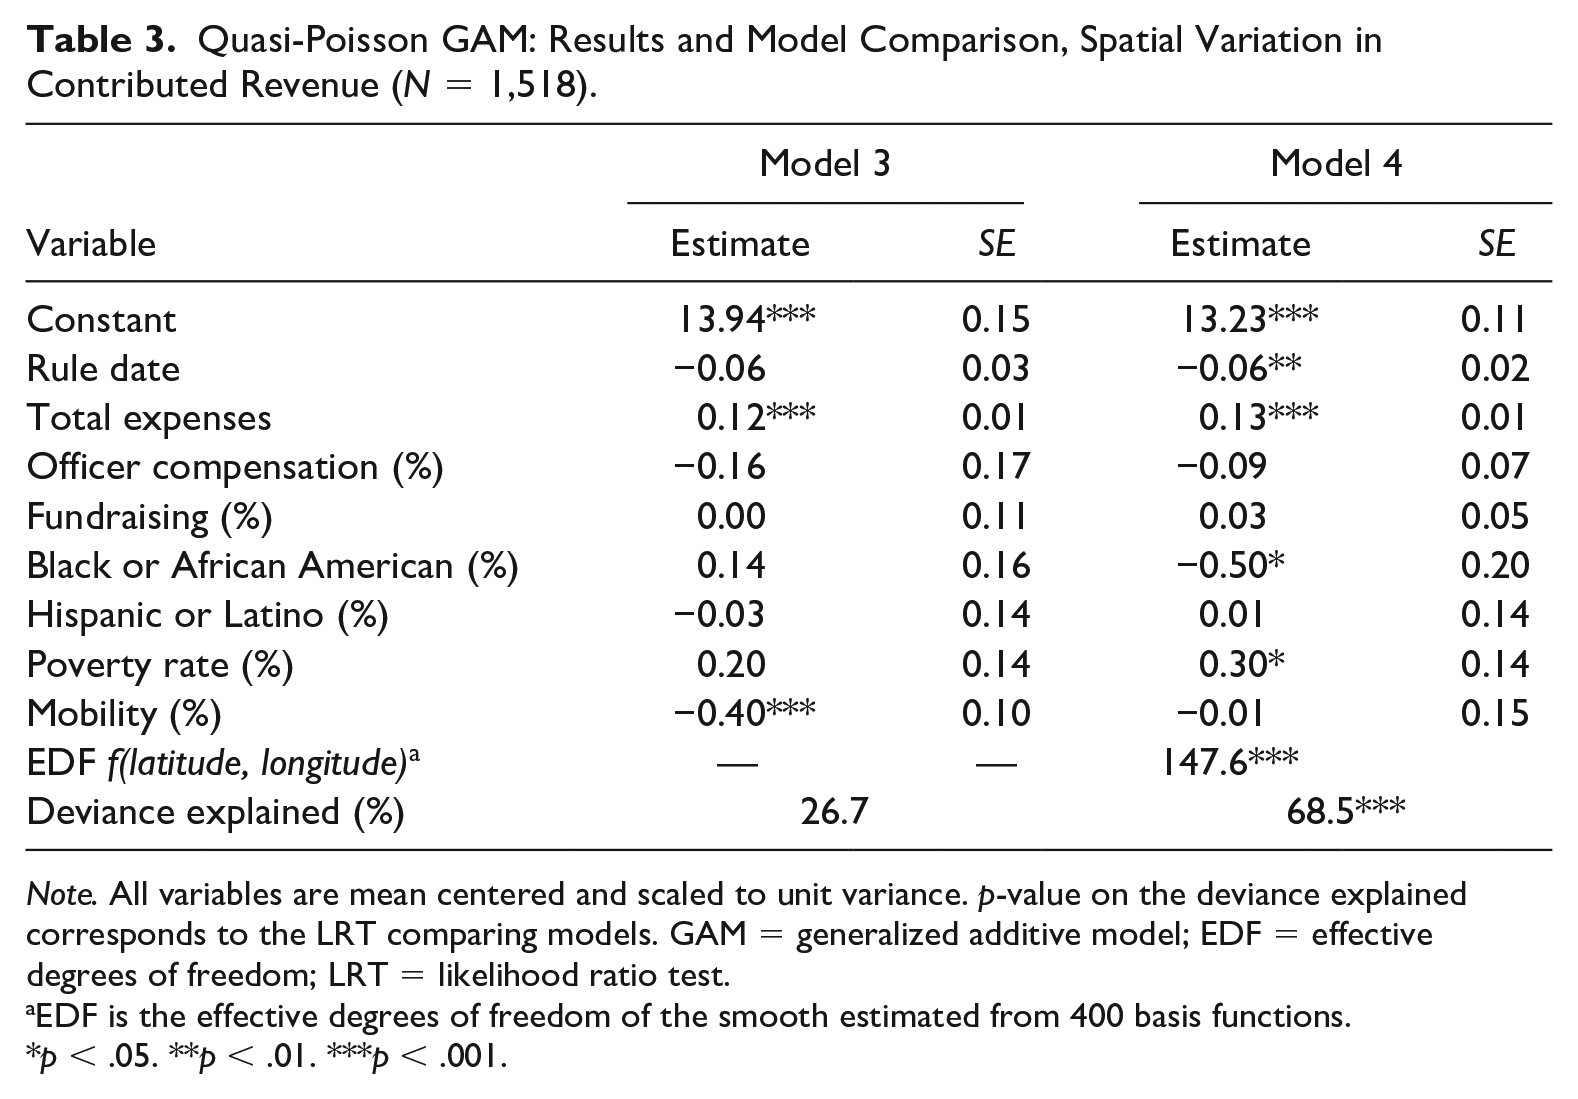
Note. All variables are mean centered and scaled to unit variance. p-value on the deviance explained corresponds to the LRT comparing models. GAM = generalized additive model; EDF = effective degrees of freedom; LRT = likelihood ratio test.
EDF is the effective degrees of freedom of the smooth estimated from 400 basis functions.
p < .05. **p < .01. ***p < .001.
These models are examined again with contributed revenue as the outcome. As discussed above, this limits the sample to those that receive revenue from contributions and leads to the omission of the percent of revenue received from contributions and program services. The results of these models are shown in Table 3.
Model 3 in Table 3 shows total expenses and residential mobility are positively and negatively associated with contributions, respectively. Again, model comparison shows the importance of the location effect as the LRT rejects the adequacy of Model 3 in favor of Model 4 where the location effect explains an additional 42% of the deviance in contributed revenue. After accounting for location effects, the estimate for the percent of the tract that identifies as Black or African American is significant and negative, while the estimate for the percent of the tract below the poverty line is positive and significant. A 20% increase in poverty rate predicts an increase of nearly 35% in contributions, while an increase of nearly 30% in the percent of the tract that identifies as Black or African American predicts a decrease in contributions of just over 60%, holding other variables constant. Further, the variance in the estimate for rule date is reduced and shows a relationship that is statistically significant and negative.
Model comparison in Tables 2 and 3 shows that nonprofit location is an important component of these outcomes, addressing RQ1. After point estimates for the location effect over the observed coordinates are recovered, they are mapped in Figure 1. Figure 1 shows great variation over space, with estimated location effects varying from just below negative 2.5 to just over 4 for total and contributed revenue. Estimated on the log scale, these are substantial effects for even the smallest nonprofits. For example, a location effect of 1 for an organization that receives 50,000 dollars in total revenue corresponds to a predicted increase of just over 85,000 dollars, while a location effect of −1 corresponds to a decrease of just over 30,000 dollars. 3 RQ2 involves examining the pattern of spatial effects, as shown in Figure 1.
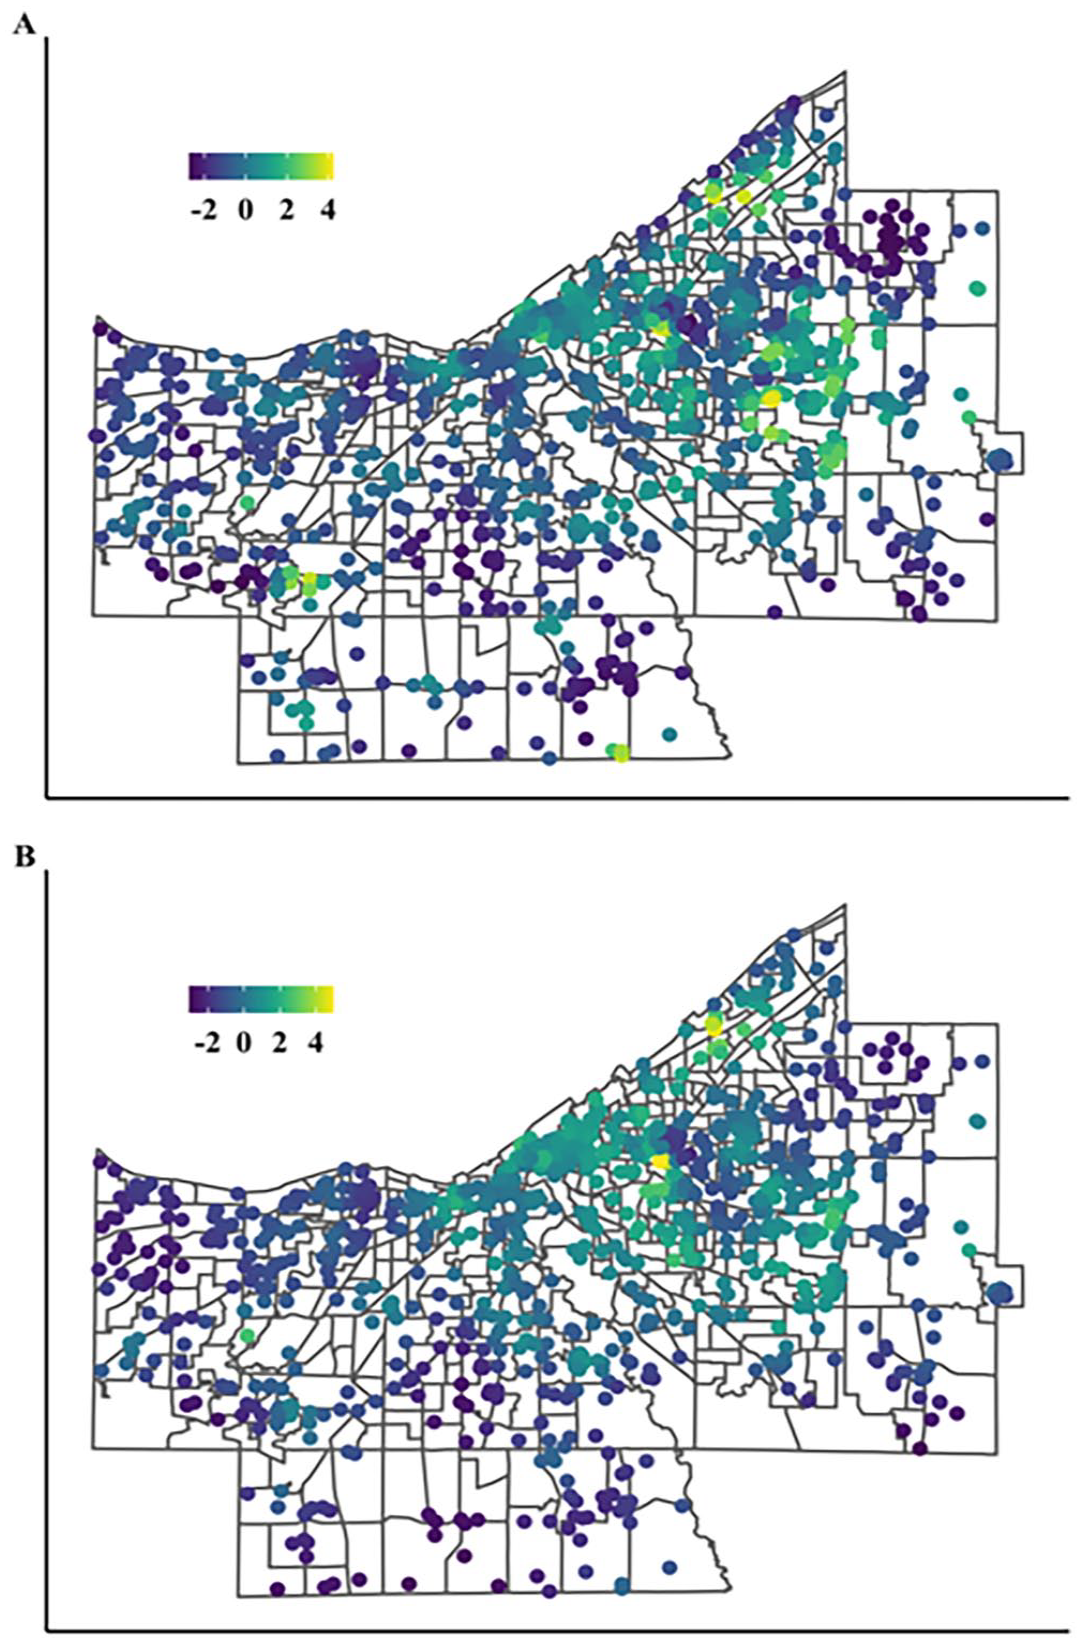
Maps of Estimated Spatial Effects, Model 2 for Total Revenue (A), and Model 4 for Contributed Revenue (B).
There are similar patterns in both maps, with a concentration of positive spatial effects located near the center of the county. The maps show, with few exceptions, organizations are clustered around positive effects, with location effects decreasing as a function of distance from these areas. This pattern also follows organizational density, with positive effects found in regions with the most organizations. Yet, this is limited to organizations with financial information and a visual inspection of the map. The relationship between the spatial effects and nonprofit density using the pairwise distances of all geolocated organizations in the BMF is shown in Table 4.
Results for the Relationship Between Nonprofit Density and Estimated Spatial Effects, Total and Contributed Revenue.
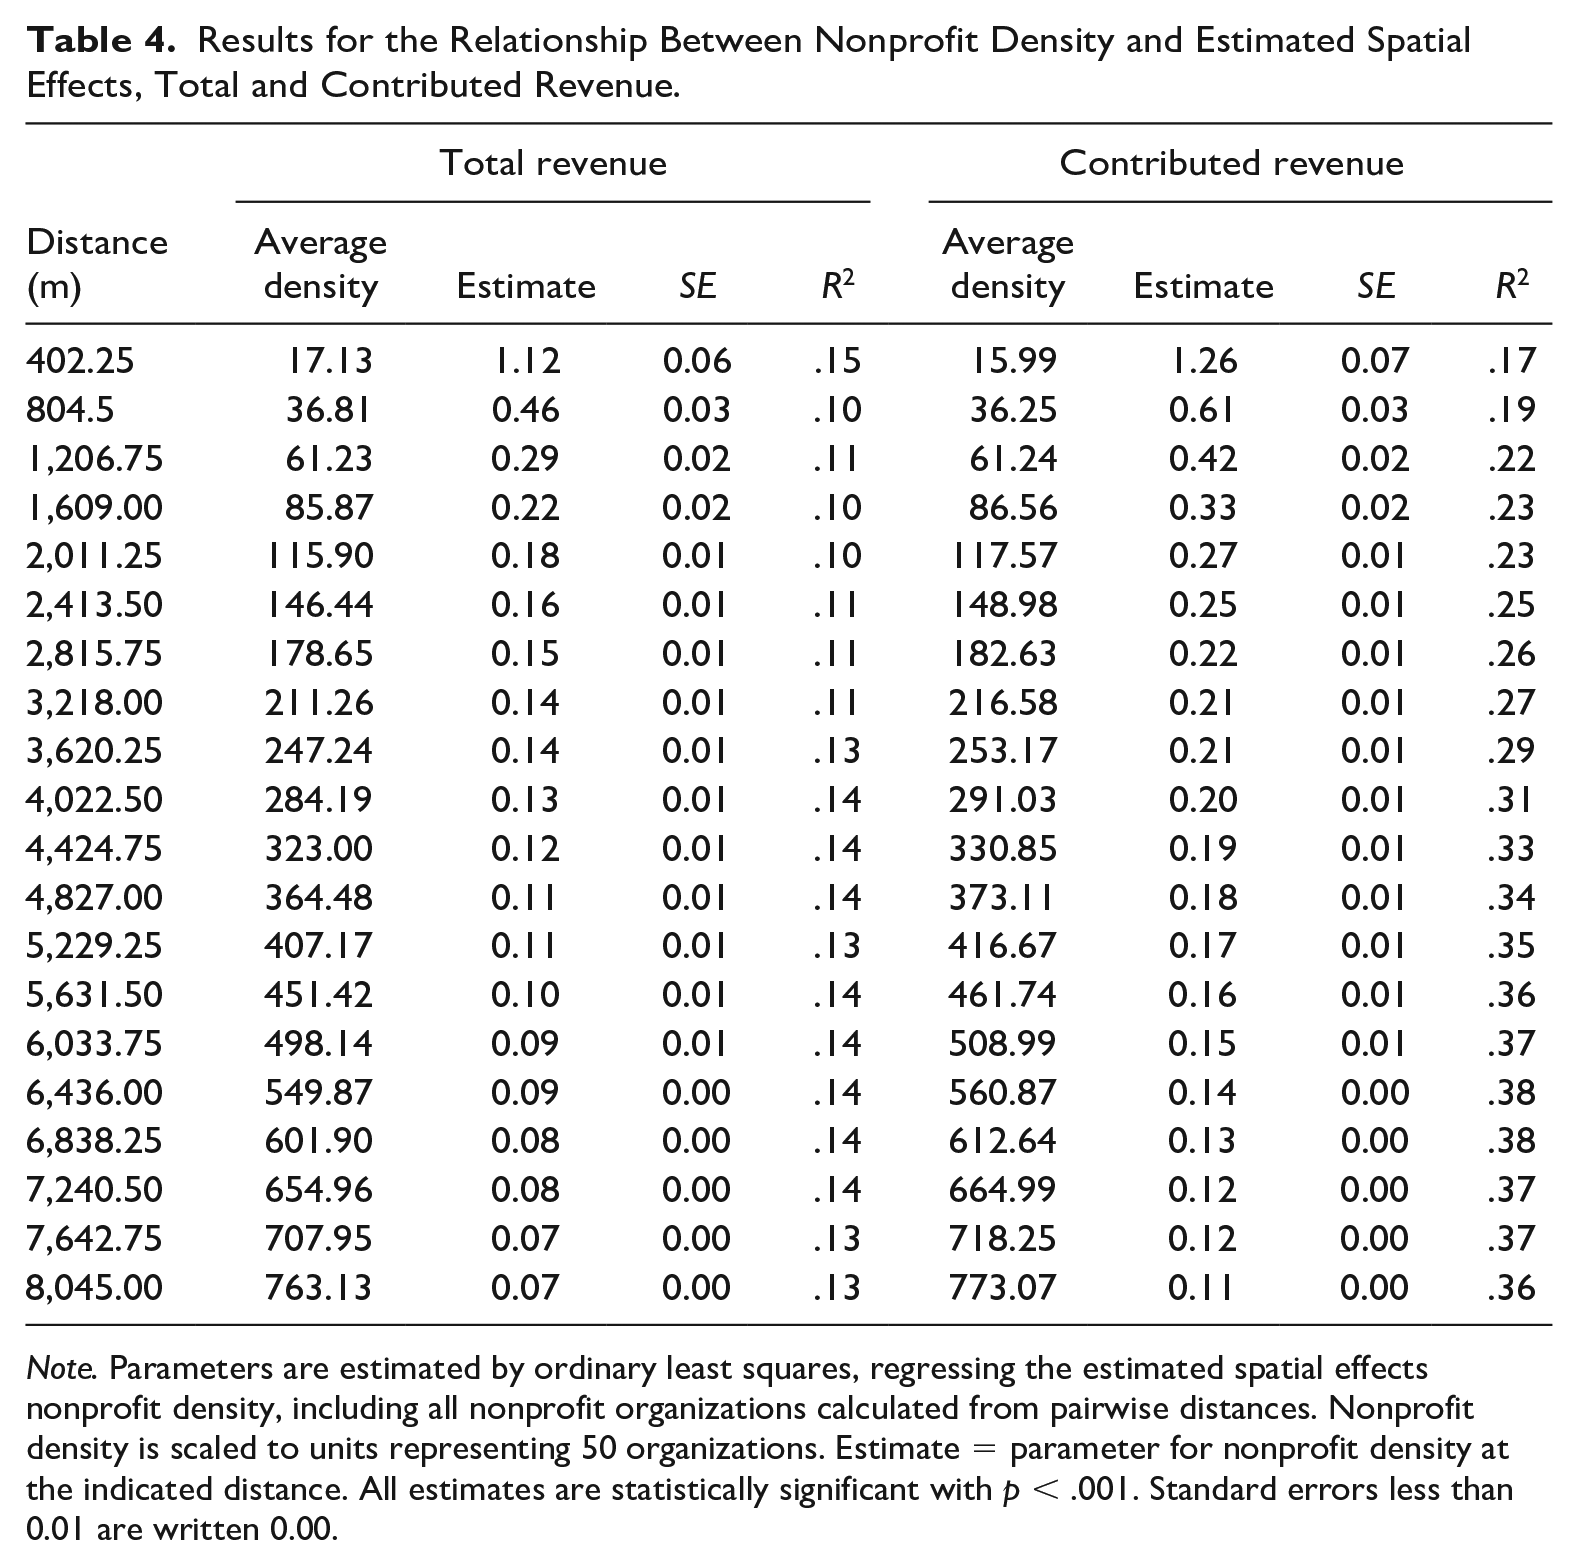
Note. Parameters are estimated by ordinary least squares, regressing the estimated spatial effects nonprofit density, including all nonprofit organizations calculated from pairwise distances. Nonprofit density is scaled to units representing 50 organizations. Estimate = parameter for nonprofit density at the indicated distance. All estimates are statistically significant with p < .001. Standard errors less than 0.01 are written 0.00.
Table 4 shows the results of regressing the location effects obtained from Models 2 and 4 on the number of nonprofit organizations, aggregated at different distances, ranging from a radius of roughly a quarter of a mile to five miles for total revenue and scaled to units of 50 organizations to facilitate comparison. The average density for the distances varies between 17 organizations within a quarter mile to over 750 within a five-mile radius. Importantly, the relationship between the location effects and nonprofit density is positive and statistically significant across all choices of distance and in both outcomes, indicating the relationship is robust to the choice of radius and that greater location effects, on average, are found for locations with more nonprofits nearby. Furthermore, Table 4 shows nonprofit density explains between 10% and 15% of the variation in the location effects for total revenue, and between 17% and 38% of the variance in the location effects for contributed revenue. The largest marginal effects, per organization, are found at the smallest radius and decreases as the radius increases. The model predicts an increase of 1.1 in the spatial effects for an increase by 50 organizations at the smallest radius, and .06 for an increase of 50 organizations within a five-mile radius. This suggests that while nonprofits may be sensitive to the nearby organizations, this sensitivity is not uniform across distances, and the location effects are most responsive to variation in organizations in their immediate proximity.
Discussion
Ecological theories have long posited the importance of organizational location providing access to economic networks, legitimacy, and exposure to competition. In this context, this paper has presented the first study to enter location as a key variable, addressing two key research questions. The first research question in this study asks whether the location of nonprofit organizations affects their total and contributed revenue and the second question asks about the relationship between the location effects and nonprofit density. While most studies consider nonprofit density at larger geographic scales, such as counties, this paper makes a unique contribution to the literature by showing the organization’s location may have serious implications for their financial performance. The results show the location effects are positively related to nonprofit density across a range of distances, suggesting that the “best” locations are those with more nonprofits nearby. This implies that while agglomeration matters for nonprofit performance, the position within agglomerative patterns may be particularly important, with the largest effects found central to agglomerative clusters.
Questions related to density in the operations and health of the nonprofit organizations continue to be crucial for the sector, as scholars seek to understand the implications of nonprofit market structures. The results from this study contribute to this discussion and build on prior literature related to the benefits of density and operating nonprofits in markets with many organizations and consumers (Guo & Brown, 2006; Paarlberg et al., 2018; Paarlberg & Hwang, 2017; Sullivan et al., 2023), showing larger location effects are found in areas with more organizations. Nonprofits in dense regions may be hardened by prolonged exposure to competition resulting in more efficient operations (Guo & Brown, 2006; Sullivan et al., 2023), seen in larger location effects. In addition, nonprofits that co-locate with existing organizations may benefit from the groundwork previously laid in the community. Nonprofits operating in dense regions may share legitimacy and other institutional factors, facilitating fit with their surrounding communities, easing resource mobilization (Sorenson & Audia, 2000; Wiewel & Hunter, 1985). Consistent with this idea, Paarlberg and Hwang (2017) suggest that organizations with dispositions toward fundraising may have created strong philanthropic cultures in a region, expediting fundraising efforts for those nearby.
This study also questions the classic theories of competition among nonprofits that largely assume organizations draw on a common, finite set of resources (the “supply approach,” Paarlberg & Varda, 2009), and as density increases these organizations compete or risk reductions in their share of resources. Theories of competition suggest that the best locations are those with unclaimed resources and fewer organizations. On one hand, the findings from this study broadly challenge the predications of the supply approach, as the highest location effects are those with more nonprofits nearby. However, another possibility is that resources in these areas are not claimed, for example, as nonprofits may cluster near prolific grant makers that focus on distributing funds locally (Bielefeld et al., 1997).
The results of this study suggest organizations may benefit from locating in areas dense with other nonprofits; however, this raises important questions for managers, policy makers, and those interested in the development of a region’s civic and social infrastructure. The location choices of nonprofits have implications for the residents of the region, as a lack of nonprofits may correspond to a lack of access to services and reduced ability to solve collective action problems (Bielefeld et al., 1997; Crubaugh, 2020; Greve & Rao, 2012; D. J. Mayer, 2023a, 2023b; Wo, 2018). Managers must be creative when locating in regions that bring the possibility of low legitimacy and network embeddedness, perhaps marketing their innovation or commitment to the region (Ressler et al., 2021). Similarly, policy makers may consider intervening to ensure equity, incentivizing alternative location choices for new nonprofits.
The finding that contributed and total revenue are positively related to tract-level poverty rates and negatively related to the percent of the tract that identifies as Black or African American may merit future investigation, particularly as prior research has suggested fewer nonprofits locate in disadvantaged neighborhoods (McDonnell et al., 2020; Wo, 2018). One possibility is that government funding prioritizes nonprofits in higher poverty areas, believing the presence of nonprofits may improve conditions 4 , however, more research is needed (Crubaugh, 2020; D. J. Mayer, 2023a, 2023b).
There are several limitations that must be noted when interpreting the results of this study. The BMF is widely regarded as the best source of information for counts of U.S. nonprofit organizations (Crubaugh, 2020; D. J. Mayer, 2023a, 2023b; Wo, 2018; Yan et al., 2014), yet may still undercount certain types of organizations such as those focused on religion, and conflates organizations and establishments. Similarly, the reliance on the form-990 for financial information may leave an incomplete picture of the sector, omitting organizations that do not submit 990s and combining important revenue sources. The study is also limited to one county; however, the patterns of nonprofit location may vary greatly with respect to race and poverty over place and time (McDonnell et al., 2020). This does not alter the interpretation of the effect of location, yet the role of community characteristics (e.g., of the census tract) may be contingent on place, and further study is needed in other regions.
Religious participation provides an additional community-level variable that may have implications for the location decisions of nonprofits, as well as their revenue. However, the data used in this study do not contain a measure corresponding to religious participation, future research may benefit from integrating additional data into empirical applications. The extant literature suggests organizational age is a strong determinant of legitimacy, which may provide enhanced access to resources when newer nonprofits co-locate with exiting organizations. Although this study has also allowed spatial effects to vary over organizations, future research in this area may benefit from considering heterogeneity or mediation in the location effects by organizational age. In addition, this study has focused on nonprofit organizations; yet, nonprofits increasingly compete and collaborate with for-profit organizations to achieve mission-related goals (Jeong & Cui, 2020; Mosley, 2020). Future research may benefit from investigating the role of for-profit organizations or social enterprises.
Total and contributed revenue, the outcomes studied in this article, are meaningful measures for organizations and are sensitive to changes in density. Yet, any two outcomes are unlikely to capture the full story of county-level density and nonprofit operations. Clearly, the choice of outcome is important, and those interested in the structure of the sector have identified a number of measures of practical and theoretical importance, including but not limited to measures of solvency, liquidity, and margin (Paarlberg et al., 2018; Prentice, 2016). Future research may benefit from exploring the intra-county implications of location and density for alternative measures of nonprofit performance and health.
Conclusion
Advancing a rich line of inquiry related to ecological processes in the nonprofit sector, this article has examined the function of nonprofit location and its relationship to nonprofit density. The study has presented novel evidence that agglomerative configurations have implications for financial performance, emphasizing heterogeneity in organizational populations due to location dependence. The results show the location chosen by a nonprofit may have serious material consequences and that nonprofits can realize substantial benefits from operating in high-density regions. The study has also shown the benefits of incorporating spatial elements into theory and empirical applications and used a unique geostatistical approach, which casts further doubt on the homogeneous treatment of organizational populations. The article calls for increased attention to spatial aspects of the nonprofit sector and has raised important questions of equity for management teams and those deciding on the location of an organization.
Footnotes
Declaration of Conflicting Interests
The author(s) declared no potential conflicts of interest with respect to the research, authorship, and/or publication of this article.
Funding
The author(s) received no financial support for the research, authorship, and/or publication of this article.
