
Abstract
In the United States, a substantial share of philanthropic giving supports educational causes, yet comparatively little is known about donations made by parents and families to K–12 education. Drawing on a nationally representative survey of 2,474 parents with at least one child enrolled in kindergarten through high school, this study examines the prevalence, magnitude, and distribution of family giving across public, charter, and private schools. We find that approximately one in four U.S. families with school-aged children reported making a donation related to K–12 education in the past year, with most contributions ranging between US$50 and US$500. Families with children enrolled in private and charter schools are significantly more likely to donate than those with children in public schools, and families with children in private schools also tend to give larger amounts.
Introduction
Nonprofit organizations have long played a key role in the field of education stretching from preschools, elementary schools, secondary schools, and universities to library services, vocational training organizations, alumni associations, and parent–teacher groups. As observed by Bromley et al. (2018), education represents one of the largest domains of nonprofit activity around the world. In the United States, the education field is also a major recipient of philanthropic support and giving to education has grown steadily over the past four decades, approaching US$88 billion in 2023 (Giving USA, 2024).
As a result, educational giving has attracted plenty of attention from researchers. There are numerous studies, quantitative and qualitative, examining giving to higher education (e.g., Shaker & Borden, 2020) as well as inquiries into philanthropic support for education and educational policymaking from foundations and elite philanthropists (e.g., Maclean et al., 2021; Reckhow & Snyder, 2014). A third line of research focuses on individual giving aimed at primary and secondary education (K–12 education), including donations from individuals to K–12 education in times of crisis (e.g., Wu et al., 2023), individual giving to private nonprofit religious schools (e.g., Wasif & Prakash, 2017), and giving going to public schools via so-called school supporting entities such as parent–teacher organizations or local school/school district foundations (e.g., Nelson & Gazley, 2014).
Although interest in individual giving to K–12 education appears to be on the rise, particularly regarding donations to public schools and their short- and long-term implications (Murray, 2019; Reich, 2018; Voyer, 2019), this line of research can be challenging. One complicating aspect is the diversity of the U.S. K–12 education landscape, which includes a mix of public, charter, and private schools, along with an increasing number of hybrid models such as micro schools (Horn, 2015). This diversity means that individual giving to K–12 schooling is not uniform and therefore difficult to pin down and grasp in its entirety. Furthermore, individuals may choose to donate directly to a school or channel their contributions through various intermediary entities, which can operate at different levels, ranging from a single school to an entire school district. A second complicating factor, which follows from the fragmented K–12 landscape and the multiple pathways for individual giving, is that, at least to date, there is no singular or comprehensive source for identifying K–12 donors or gifts to K–12 education, which makes large-scale quantitative and comparative studies hard to conduct. For that purpose, we focus in this study particularly on parent donations to K–12 education.
Concretely, the purpose of this research note is to present findings from a 2024 survey of over 2,400 U.S. parents with at least one child enrolled in school from kindergarten through high school, offering new insights into patterns of giving to K–12 education. The survey explores whether families with children had made any donations related to K–12 schooling during the past academic year, the amounts donated, and the types of schools that benefited from the donations. When reporting on the findings, we draw on the existing nonprofit literature about donors and individual donations (Bekkers & Wiepking, 2011; Konrath & Handy, 2018; Wiepking & Bekkers, 2012) to explore how factors such as education level, income, and religiosity relate to the likelihood of giving to K–12 education. In this research note, we focus exclusively on families with children currently enrolled in K–12 schools, rather than donors more broadly. These families represent the most directly affected stakeholder group, making their giving behavior theoretically and empirically central to understanding K–12 education philanthropy. Practically, they are also the most likely and frequent targets of school-based fundraising efforts and thus critical to the success of such efforts. Their close connection to schools also uniquely positions them to perceive real-time resource gaps and respond to immediate institutional needs, insights that are directly actionable and of interest for educational leaders as well as policymakers.
This study provides an exploratory, descriptive examination of family giving to K–12 education using recent national survey data. By documenting the prevalence, magnitude, and correlates of parental donations across school sectors, the analysis offers timely baseline evidence on an understudied form of educational philanthropy. Examining these basic questions is an important undertaking for several reasons. First, primary and secondary schooling is becoming an increasingly discussed matter among an array of stakeholders ranging from parents, teachers, and school leaders to politicians, policymakers, and philanthropists in the aftermath of the pandemic. Many public schools are likely to face growing fiscal gravity as the additional federal pandemic support for K–12 education ended in late 2024 and the number of school-age children in America is declining, thereby reducing enrollment-based funding streams even as many operating costs remain fixed. Thus, philanthropic support for K–12 education is likely to become an even more germane and common feature moving forward. Second, if monetary gifts from parents and families are indeed becoming a more prolific part of U.S. K–12 education, it elicits important questions about school governance and performance. For example, what demands are attached by families with children to their donations and how does the rise and role of such contributions relate to inequality within and between schools? Given the scarcity of large-scale samples reporting on how U.S. K–12 parents and families give to K–12 schooling, our study provides focal baseline information on K–12 donors. This foundational understanding can help scholars and practitioners develop propositions and begin figuring out the complex implications of the fiscal challenges to K–12 education, and the growth of philanthropic funding in public schooling.
Understanding Giving to K–12 Education
The association between philanthropy and K–12 education is far from new. As observed by Lenkowsky (2005, p. 79), donor support for schools was a critical element during colonial times when ‘[. . .] a mixture of gifts and tax revenues sustained the earliest schools’. Today, public schools are the primary providers of K–12 education and philanthropic support only constitutes a fraction of total K–12 spending. Unquestionably, alongside tuition, donations remain a vital source of support for many private nonprofit schools. However, several researchers have begun to recognize and discuss the growing role of individual/parental giving to public schools and districts. (e.g., Hansen, 2007; Murray, 2019; Nelson & Gazley, 2014). According to Reich (2018, p. 94): There have long been parent-teacher associations (PTAs) that raise modest amounts of money. Think of bake sales, car washes, and spaghetti dinners. But over the past generation fund-raising efforts for many local schools and school districts in the United States have become more serious, less a matter of community building or bringing parents into closer connection with the school and more forthrightly and unembarrassedly about maximizing the amount of money made.
It is feasible to assume these fundraising efforts will indeed intensify as public education budgets are often stretched and there is, as Reich notes (p. 95), ‘a general reluctance in many states to boost education funding’. Furthermore, in response to the pandemic, the federal government provided US$190 billion in federal pandemic aid, but these funds are now depleted and will not be renewed. Schools across America are also experiencing declining enrollment numbers due to the falling U.S. birthrate, and many public schools face increased competition for students as school choice options (e.g., school vouchers) have been implemented in many U.S. states.
Donations targeting K–12 education, especially gifts going to a particular individual school, school district, and/or local school supporting entity, have a natural constituency in parents and families whose children are currently enrolled in that school or school district. It is conceivable for any individual to support K–12 education because they value K–12 education as an important good in general and/or because they have key connections to such causes (e.g., the donor is an alum, has had children participating in K–12 schooling). However, we consider families with children who are currently enrolled in a school from kindergarten through high school to be an essential donor group to focus on. For example, this group, and parents in particular, are likely to possess information and knowledge to help them better understand, connect to, and empathize with the specific needs and/or opportunities that a donation toward a K–12 school will support. Furthermore, nonprofit researchers have noted how procuring self-oriented private benefits can be a motivation for donors (Konrath & Handy, 2018), and according to the so-called opportunity hoarding perspective, one reason for families giving to K–12 education is to gain influence and to improve their children’s chances of educational success (Voyer, 2019).
Common Predictors of Philanthropic Behavior
As K–12 actors seek to boost individual giving, a reasonable starting point is the rich literature on the reasons why individuals give money. Reviews of the giving literature and attempts to create measures of donor motivation (e.g., Bekkers & Wiepking, 2011; Konrath & Handy, 2018; Wiepking & Bekkers, 2012) reveal multiple, and often complex, mechanisms that help explain donors’ decisions to give ranging from the awareness of need by the donor, being asked/solicited to give, and altruism to fiscal incentives and the donors’ reputational concerns and values.
Although families with children represent a key constituency in K–12 educational giving, they are not a homogeneous group, and we therefore consider it appropriate to look to the general literature on giving to better understand parents as donors. Nonprofit researchers have illuminated several common variables to consider that further help explicate who and why individuals give including education, income, trust, and religiosity (Bekkers & Wiepking, 2011; Wiepking & Bekkers, 2012).
Education, commonly measured as the level of formal education, is considered a significant predictor of the likelihood of giving and the amount of giving. Not only is education believed to be a catalyst for prosocial behavior, but it is also positively related to social capital, meaning individuals with more education have greater chances of being solicited and connected to a variety of causes (Bekkers & Wiepking, 2011).
Income is also viewed as a predictor of the amount being donated, as individuals with higher income can afford to donate more, all else equal (Wiepking & Bekkers, 2012). However, the role of income as it relates to the likelihood of giving is more complex. Bennett (2012, p. 873) suggests that different life experiences among individuals at different income levels can result in having ‘different perspectives of the issues that are most deserving assistance’. For example, to be poor typically means being adjacent to multiple and particular social problems, which is likely to make them more aware of the social needs of others (Bennett, 2012). Giving is also a chance to express personal preferences (e.g., interests, tastes), and individuals with different incomes may prefer to donate to different causes, making it an important variable to include when studying K–12 education.
A third key variable connected to individual giving is trust, as a greater level of trust is considered to represent an important ingredient that increases the likelihood of making voluntary donations but also predicts higher levels of giving compared to donors with lower levels of trust (Chapman et al., 2021). This is true for general trust (Bekkers, 2003), but even more so for trust directed at the specific organization receiving the donation (Chapman et al., 2021). This is natural, as greater trust in the organization makes the donor feel more confident that the donation will be used for its intended purpose. Moreover, prior research suggests that trust plays a particularly important role in contexts characterized by information asymmetries and limited transparency (Bekkers, 2003), such as K–12 education. Specifically, there is often a disparity in the information available to different education stakeholders, for example, parents, teachers, and school administrators. For example, schools may have more detailed knowledge about their policies, teaching quality, or resource allocation than students or their parents. This means that also trust in a specific school and educational system in general—as an intangible but strong relational component—becomes essential to bridge this gap, as families with children must rely on schools to act in their best interests despite the imbalance of information.
The final factor to be considered is religiosity, which Bekkers and Wiepking (2011), together with education, deem as one of the ‘ubiquitous’ correlates of giving. Religiosity is a significant predictor of both the likelihood and level of giving, driven by stronger prosocial values and adherence to social norms among religious individuals, and frequent solicitation for religious causes. In addition, Bekkers and Wiepking (2011, p. 340) observe that religiosity, while primarily linked to giving to religious organizations, is also positively associated with secular giving, that is, ‘[. . .] giving to organizations other than the church itself [. . .]’.
Several of the variables mentioned here also connect to and can be interpreted through various theoretical lenses. For example, altruism as well as the theory of ‘warm-glow’ giving (Andreoni, 1990) suggest that individuals donate both to benefit others and to experience personal satisfaction from the act of giving. These are expectations that align with findings that more educated and more religious individuals tend to internalize stronger prosocial values and norms of generosity. Social capital theory (see, for example, Wang & Graddy, 2008) further highlights how donations to school organizations can serve to reinforce community belonging and reciprocity, as giving often occurs in the context of various school-supporting organizations where reputational benefits also accrue. At the same time, the so-called parental investment perspective helps frame donations as strategic efforts to enhance one’s own child’s educational environment and future opportunities (see, for example, Attanasio et al., 2022), specifically when families have the resources to do so. Together, these perspectives help explain why features of education, income, and religiosity can be utilized to help predict giving as they shape both the capacity to give and the motivations, ranging from moral duty to social positioning to direct investment in children, that make families active donors in the K–12 schooling arena.
Given the exploratory nature of this research note, we consider the elements outlined above as a starting point for comprehending individual giving to K–12 education. We acknowledge they are broad elements, and it is possible that we need to develop more specific and/or additional factors at work to begin to unpack the drivers for parental and family giving to K–12 educational causes.
Data, Measures, and Method
To collect data for this research project, we collaborated with the U.S. educational nonprofit organization EdChoice. Specifically, we utilized information from EdChoice’s Public Opinion Tracker project, an ongoing initiative that surveys national samples of U.S. citizens monthly on issues related to K–12 education such as school quality, school choice, and personal preferences.
For this study, we draw on data collected from surveys in June and July 2024 of current U.S.-based K–12 parents, that is, all respondents currently having at least one child partaking in K–12 public or private education. As noted earlier, while giving to K–12 education is not limited to current parents, we deem this group one of the most essential donor categories to study, especially when it comes to giving for local schools or school districts. The final sample for these monthly parent surveys consists of the parent-only responses from a national monthly public opinion poll consisting of approximately 2,200 U.S. adults (nonrepetitive participants of parents and non-parents) combined with responses from a monthly oversample survey by EdChoice of approximately 800 K–12 school parents. Respondents were recruited through online panel providers using non-probability, stratified quota sampling with targets based on the U.S. Census Bureau’s 2021 American Community Survey on age, gender, region, race/ethnicity, and educational attainment. As with any non-probability online survey, potential limitations include non-response bias, coverage bias, and possible overrepresentation of parents who are more engaged with school-related issues. For this study, we combined the data from two parent surveys, consisting of a total of 2,623 parent respondents (i.e., 1,156 respondents from the public opinion poll and 1,467 respondents from the oversample of school parents). After removing respondents with missing values on any of the variables included in our study, the final sample consisted of 2,474 respondents.
For the months of June and July, EdChoice allowed the authors to include a section in their general survey with a small number of questions related to individual giving. The section included an opening statement articulating an interest in comprehending the extent to which individuals give monetary donations to K–12 schooling, which includes donations given directly to a K–12 school, a school foundation connected to a single school or a school district, and/or school-bonded entities such as a parent–teacher association, parent–teacher organization and/or booster club. The opening statement was followed by three questions: (a) ‘Have you or members of your family given a charitable donation(s) related to K–12 schooling in the last twelve months?’ (Response options: yes/no), 1 (b) ‘Altogether, what was the total dollar value of all donations you and your family made in the last twelve months toward K–12 schooling?’, where respondents could pick from seven categories ranging from ‘less than US$50’ to ‘US$2,000 or more’; and (c) ‘What type of school this donation(s) benefited?’, with four response options: (1) public school or school district, (2) charter school, (3) private religious/parochial school, and (4) private non-religious school. For this third question, respondents could select all that apply.
Our analytical strategy includes descriptive statistics and a binary logistic regression model to estimate the likelihood of a respondent indicating having made a charitable donation to K–12 schooling in the past 12 months, using a dichotomous dependent variable (1 = donated, 0 = did not donate). Moreover, we fitted an ordinal logistic regression using donation amount categories as the dependent variable (see Appendix).
In the regressions, we include several independent variables, which are standard variables in the EdChoice public opinion poll. Income is included as a categorical variable with three levels: ‘Low income’ (<US$35K)’, ‘Middle income’ (US$35K to < US$75K)’, and ‘High income’ (US$75K+)’. Education and gender are modeled as binary (dummy) variables, where respondents with a college education are coded as 1 and those without as 0. Female respondents are coded as 1 and male as 0. We also included what generation the respondent belonged to categorized into four groups: ‘Gen Z (1997–2012)’, ‘Millennials (1981–1996)’, ‘Gen X (1965–1980)’, and ‘Baby Boomers (1946–1964)’. In addition, a geographic variable was included categorizing respondents as living in an ‘Urban area’, ‘Suburban area’, ‘Small town’, or ‘Rural area’. To account for race and ethnicity, we include two variables from the standard EdChoice questions. The first is a categorical variable with the categories ‘Black’, ‘Asian’, ‘Native American’, and ‘Other’. Due to data limitations, the ‘Other’ category includes both respondents who identified as White and those who selected ‘Other’ in the original survey. Based on prior years’ data, the majority of these respondents likely identified as White. The second is a dummy variable indicating whether the respondent identifies as ‘Hispanic’. The Hispanic variable is coded independently of race, meaning that respondents could identify as both Hispanic and any of the race categories.
In addition to demographic variables, we also include variables pertaining to political ideology, religious attendance, and trust. Political ideology was measured via a categorical variable with the options ‘Conservative’, ‘Liberal’, and ‘Moderate.’ The variable of religious attendance was measured by asking how frequently the respondent attended religious services, ranging from 1 = never to 7 = every day. Finally, even though we did not have an explicit variable in the survey directly aimed at measuring trust in the K–12 related organization receiving the donation, we looked to a measure for the overall sense of direction of K–12 education in the local school district as a proxy variable. The sense of direction variable prompted the respondent to indicate if they felt local K–12 education was generally going in the right direction or if they felt things have generally gotten off on the wrong track (there was also a ‘don’t know/no opinion option’). Finally, the EdChoice survey also includes a question asking the respondents to indicate what type of school their children attend. Respondents could select more than one school type if they had children attending different types of schools; however, the vast majority (approximately 95%) reported only one type. We include dummy variables that indicate if a respondent has a child who attends ‘Private’ or ‘Charter’ schools, with ‘Public’ as the reference category.
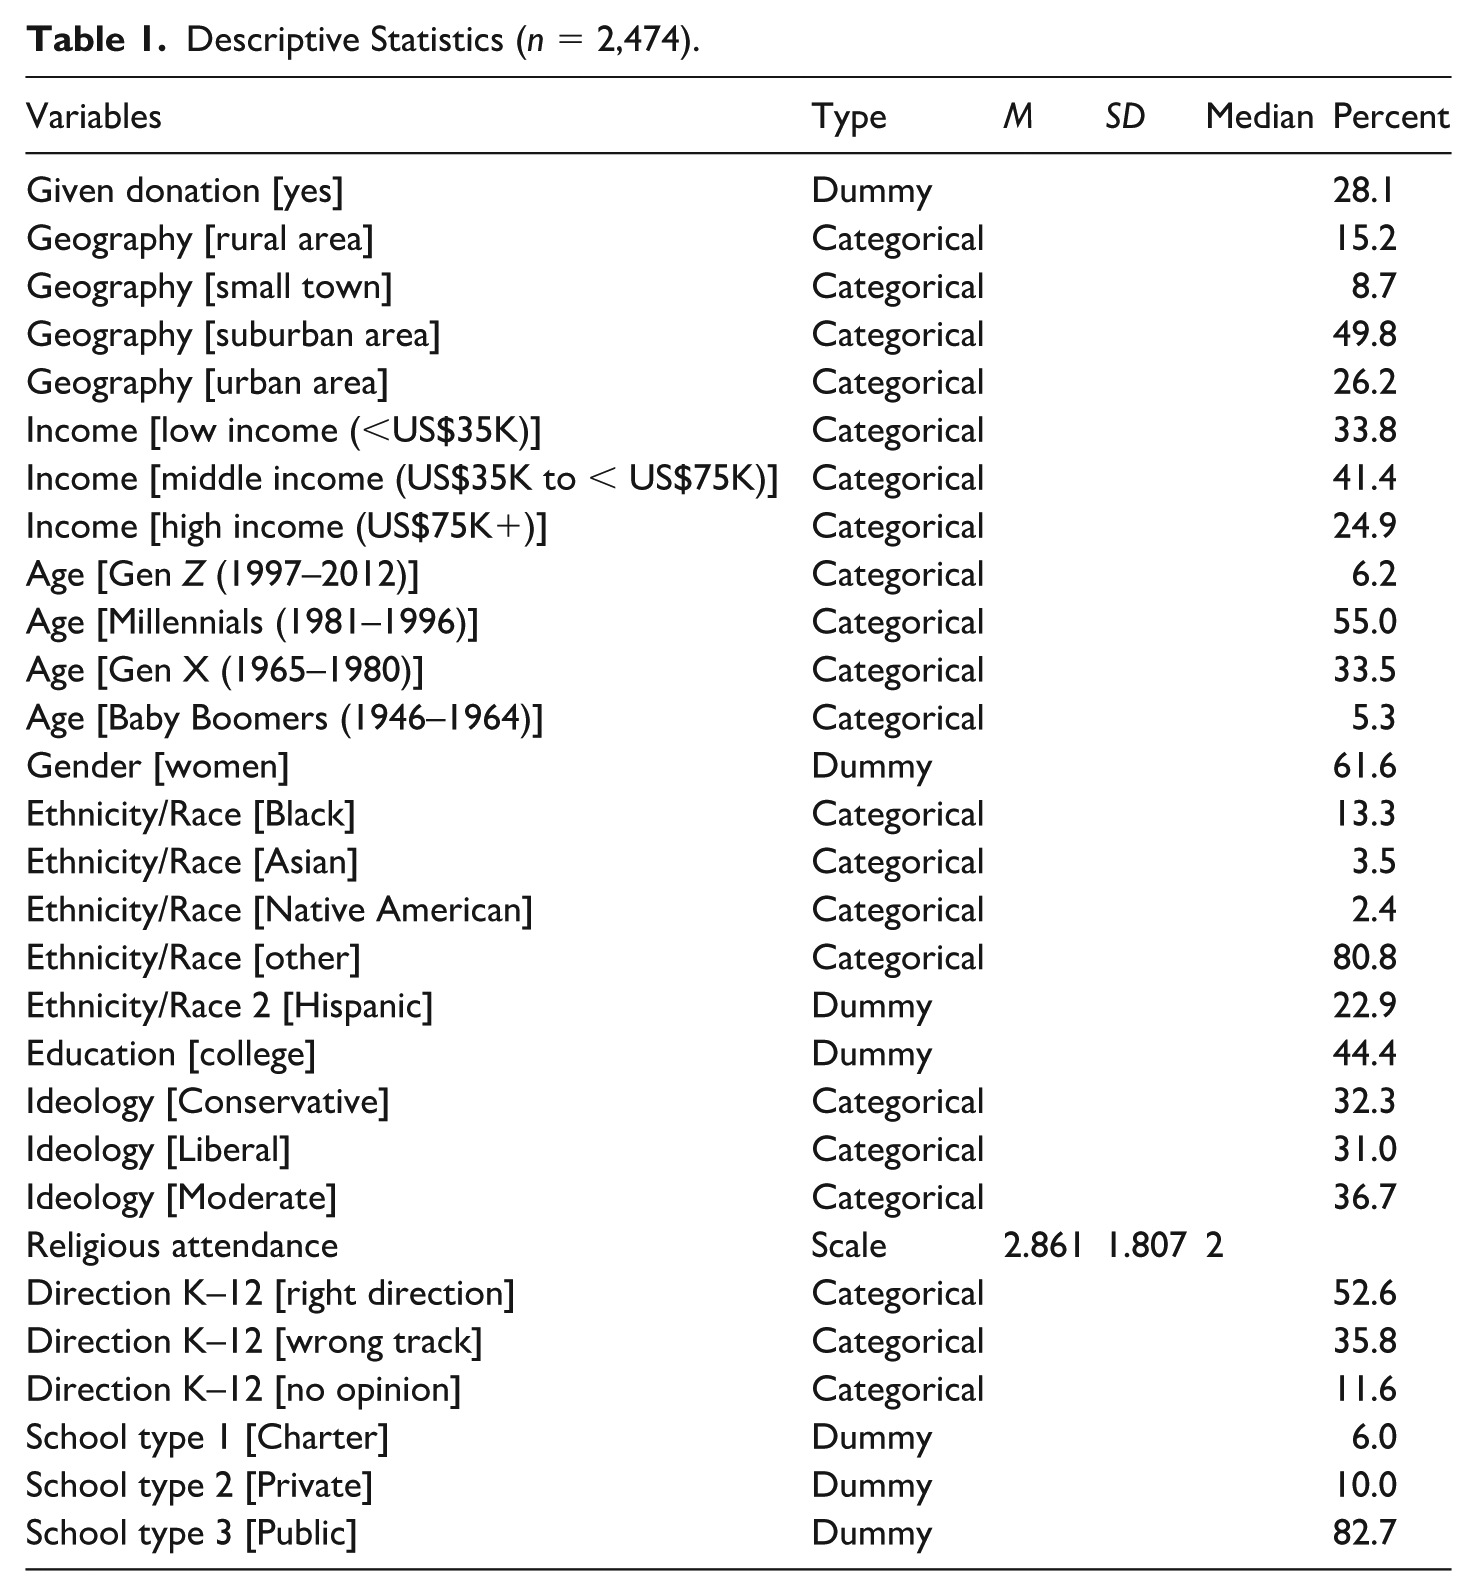
We conducted a multicollinearity diagnostic using Generalized Variance Inflation Factors (GVIF). All adjusted GVIF values were well below 2, suggesting that multicollinearity is not a concern in our model. Table 1 displays descriptive statistics of the variables included in the regression for our sample.
Descriptive Statistics (n = 2,474).
Results
Descriptive Statistics
As indicated in Table 1, approximately one in four families with children (28%) signal they have given a charitable donation(s) related to K–12 schooling in the last 12 months. However, as illustrated in Figure 1, giving rates differed depending on what type of school the respondents have indicated that their children attend.
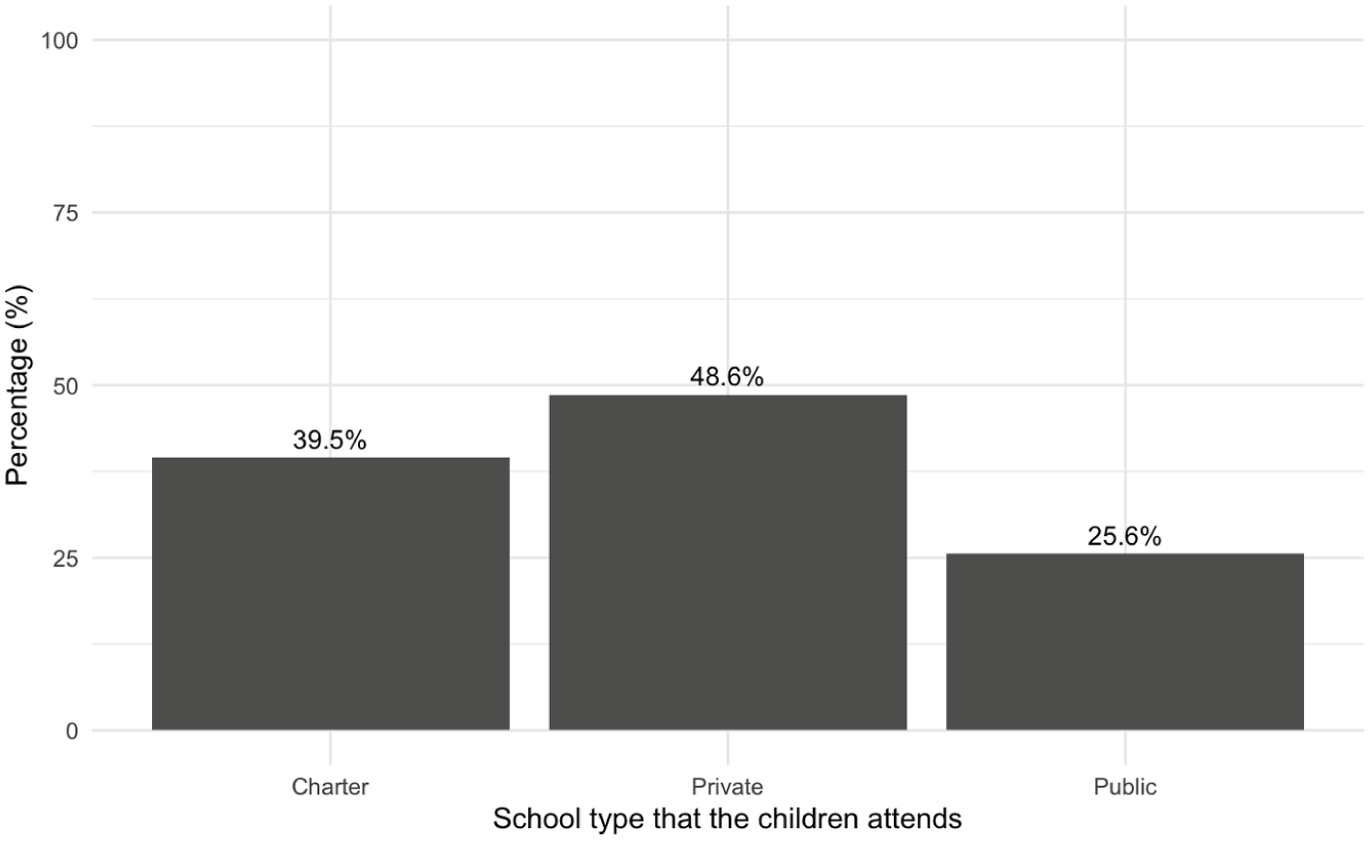
Percentage of parents with children attending different types of schools who have given a school-related donation in the last 12 months (n = 2,474)
Figures 2 and 3 focus on the size of the donation from respondents answering ‘yes’ to having donated in the last 12 months, and the difference in donation amounts across school types benefiting from the donation. In Figure 3, we have compressed the donation amounts into three groups: less than US$100, US$100 to US$499, and US$500 and above.
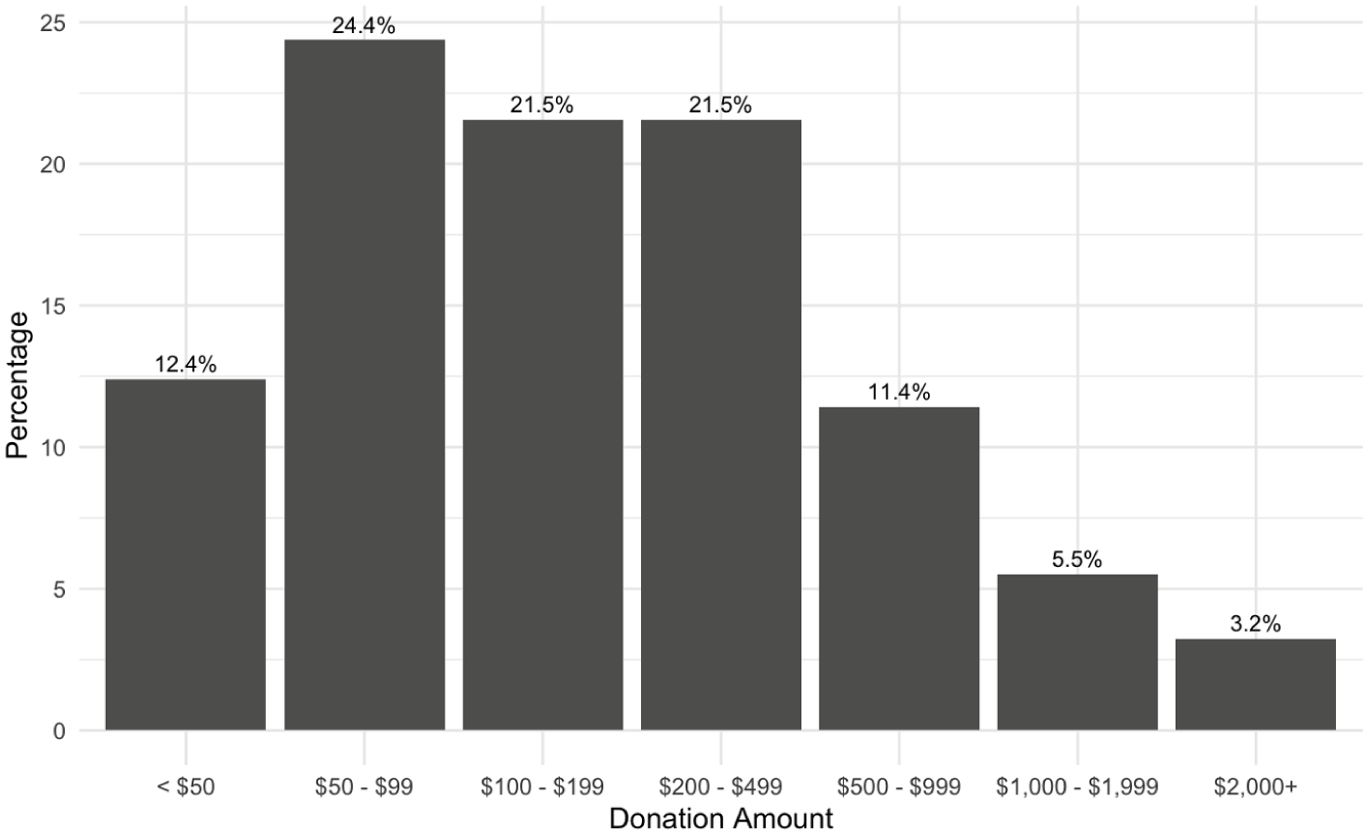
Distribution of donations across donation amount categories (n = 695)
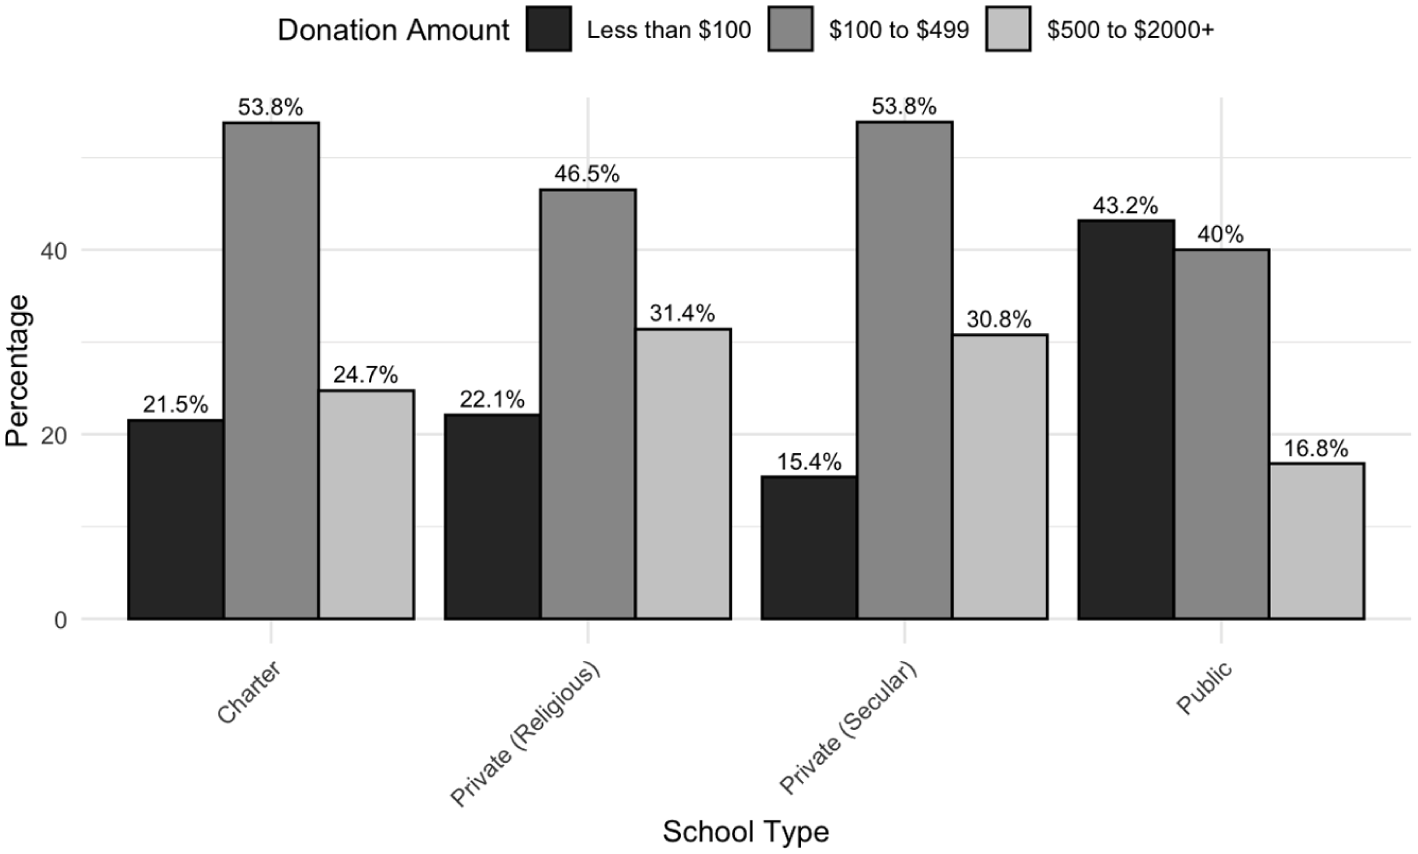
Distribution of donations by amount and school type benefited (n = 695).
Figures 1 to 3 indicate that the majority of donations (67.4%) fall within the US$50 to US$500 range. In addition, donations to private schools are both more frequent and larger, on average, compared to donations to public schools. Moreover, non-charter public schools receive the largest number of small donations (less than US$100) and the least number of larger gifts (US$500 or more), whereas giving patterns in terms of donation amounts to charter schools are more similar to those of private schools than public schools.
Logistic Regression
Table 2 presents the results of the logistic regression, with the dependent variable being whether the parent or their family members have made charitable donations related to K–12 schooling within the past 12 months.
Logistic Regression Predicting Donation to K–12 Education in the Past 12 Months (n = 2,474).
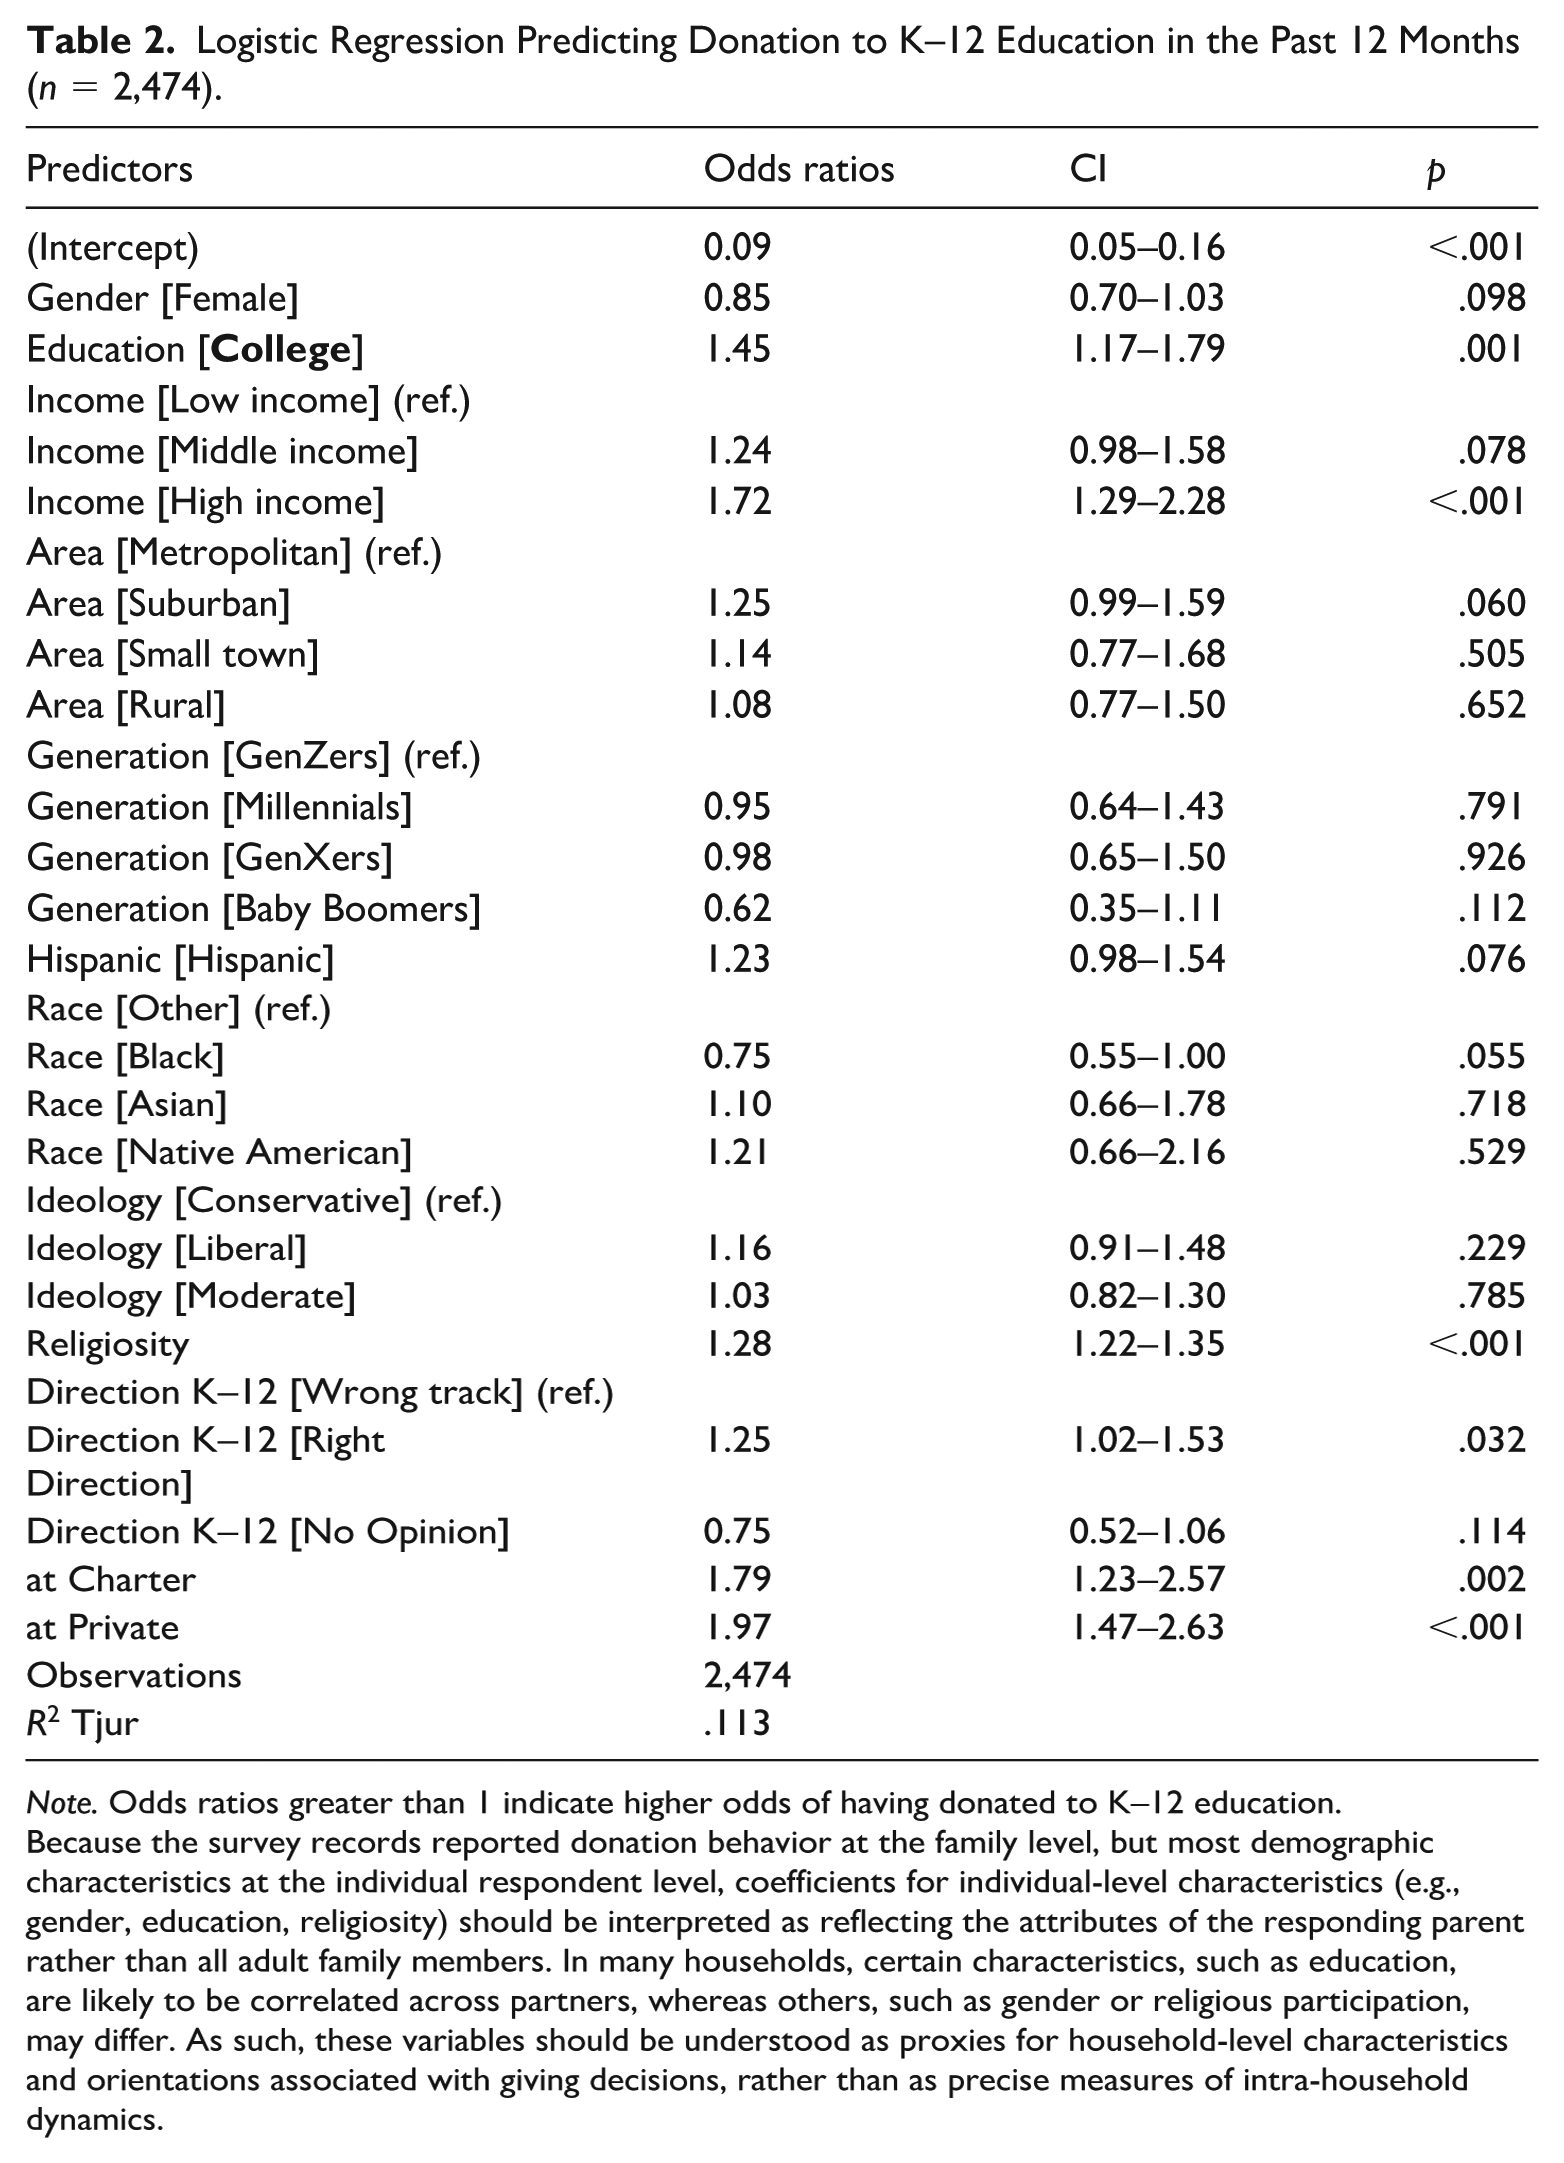
Note. Odds ratios greater than 1 indicate higher odds of having donated to K–12 education.
Because the survey records reported donation behavior at the family level, but most demographic characteristics at the individual respondent level, coefficients for individual-level characteristics (e.g., gender, education, religiosity) should be interpreted as reflecting the attributes of the responding parent rather than all adult family members. In many households, certain characteristics, such as education, are likely to be correlated across partners, whereas others, such as gender or religious participation, may differ. As such, these variables should be understood as proxies for household-level characteristics and orientations associated with giving decisions, rather than as precise measures of intra-household dynamics.
Consistent with the previous literature on individual giving (Bekkers & Wiepking, 2011; Wiepking & Bekkers, 2012), we find that education, income, and religiosity are significant factors increasing the likelihood of donating to K–12 schooling in the last 12 months. Specifically, respondents with a college education are more likely to indicate a donation being made (odds ratio (OR) of 1.45, p = .001). Similarly, respondents belonging to the high-income bracket were also more likely to indicate a donation being made (OR = 1.72, p < .001). Moreover, parents who attended religious services more frequently were more likely to indicate a donation being made (OR = 1.28, p < .001). Turning to racial and ethnic background, none of the coefficients for the race or Hispanic variables are statistically significant at the .05 level.
The logistic regression results further indicate that families with children in charter and private schools have significantly higher odds of donating than those with children in public schools, with odds ratios of 1.79 (p = .002) and 1.97 (p < .001), respectively. This suggests that families with children in these school settings are more inclined to contribute financially compared to their public-school counterparts. Finally, our proxy measure for trust was also significant, showing that families perceiving that things in K–12 education are generally going in the right direction are more likely to donate to K–12 schooling. None of the other variables showed any significant results.
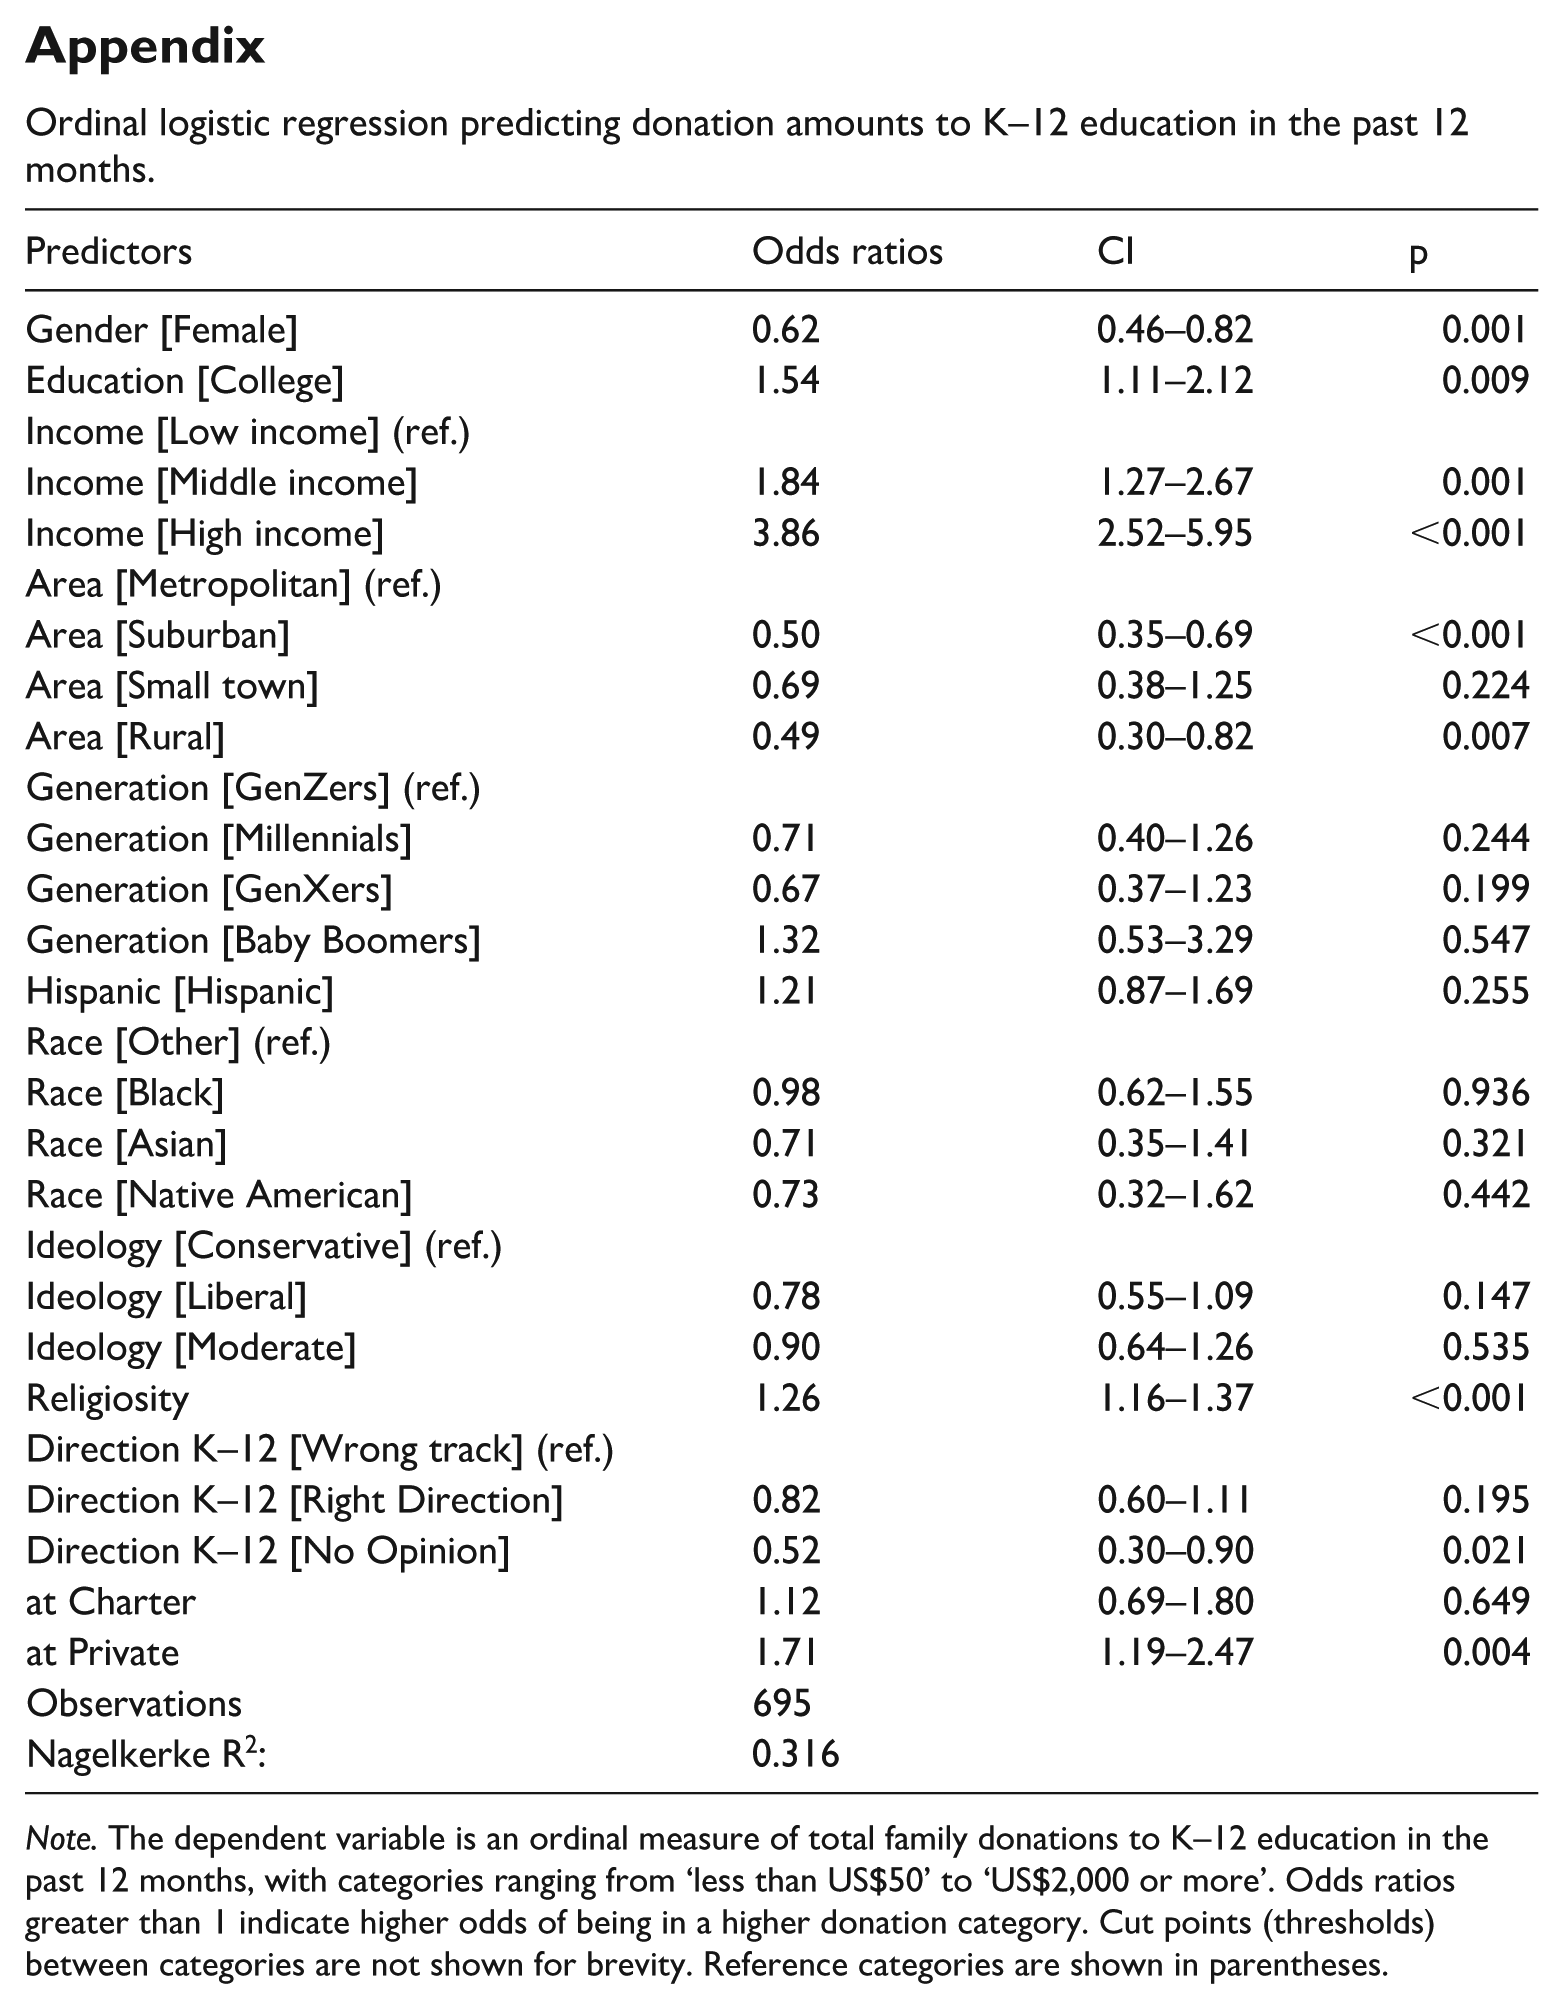
For respondents who indicated that they or a member of their family had donated money to K–12 schooling in the past year, we fitted an ordinal logistic regression with donation amount categories as the dependent variable (Table 1). The results show that higher income, college education, religiosity, and having children in private schools are associated with donating larger amounts, whereas suburban or rural residence and being female are associated with lower donation amounts. About the difference in gender, this might be surprising as the main dependent variable is about donations at the family level, and for most couples, this should then not relate to a gender difference. However, some other studies have shown that men—at least in particular countries—tend to report more and/or higher donations (Wiepking et al., 2022). While this might be a mere aspect of different survey response behaviors rather than actual behavior (Einolf, 2010), there are indeed several studies that observe gender differences in reported donation behavior (De Wit & Bekkers, 2015). However, given the limits of our data, these interpretations need further validation in other studies that capture survey responses as well as actual behavior.
Discussion
In this research note, we have explored patterns of giving among families with children to K–12 education, including differences across school types, donation amounts and predictors of giving. We found that families with children in private schools are more likely to donate money, and are also more likely to make larger donations, compared to families with children in public schools. In addition, both income and religiosity showed a positive relation with the likelihood of donating money to a school, factors that can also be related to private schooling as higher-income families are significantly more likely to enroll their children in private schools (Murnane et al., 2018), and close to three-quarters of private school K–12 students in America are enrolled in a religiously affiliated school (Schaeffer, 2024). Private schools are also predominantly nonprofit organizations and therefore may have sophisticated fundraising and development units that know how and when to solicit donations from donors, including parents. Hence, the positive associations of income and religiosity with school donations clearly align with long-standing evidence in philanthropy studies (Bekkers & Wiepking, 2011), and in the K–12 setting, they may indeed reflect both parents’ desire to invest in their children’s future and opportunities as well as broader commitments to the school community. The stronger propensity to give among charter school families could stem not only from financial pressures but also from a heightened sense of affiliation and choice-based engagement.
Given that most American children enrolled in K–12 education attend a public school, and that these schools are funded by federal, state, and local governments, it is worth noting that 25% of families with children in public schools and close to 40% of families with children in charter schools have made donations to schooling in the past 12 months. As was shown in Figure 3, a majority of these donations were US$100 or more, and approximately 17% of donations to public schools and 25% to charter schools were more than US$500. This suggests that families with children are not only a frequent but also an important source of funds for public schools.
Our regression results show that families with children in charter schools are more likely to donate compared with those with children in regular public schools. One possible explanation is that even though charter schools are funded by public money, they often receive less per-student funding than traditional public schools and thus have stronger incentives to look for private donations. Clearly, more research is warranted to examine how and why charter schools and regular public schools engage in fundraising activities.
Another regression-based observation is that families with children who believed local K–12 education was generally heading in the right direction were more likely to donate than those who felt it had gotten off on the wrong track. We treated this variable as a proxy for trust, suggesting that families may seek reassurance that their donations will directly benefit students or school improvements, rather than being mismanaged or allocated to activities that do not impact educational outcomes. Our data did not capture whether parents or family members frequently restricted their donations to specific uses, such as funding particular programs or school improvements, but this remains an important topic for future research. Moreover, the positive relation between giving and the feeling that K–12 education is going in the right direction suggests families with children are more willing to support success rather than donating to help fill gaps due to decreasing or lagging public funding. Future surveys could strengthen this line of inquiry by including more direct measures of trust in the receiving organizations.
Notably, the factors associated with whether families donate to K–12 education are also closely linked to the size of the financial contributions they make. Household income, educational attainment, and religiosity are positively related not only to the likelihood of giving but also to higher donation amounts, suggesting that family resources and normative orientations shape both participation in charitable giving and the scale of financial commitment to schools. In particular, families with children enrolled in private schools tend to make larger donations, underscoring how institutional context and fundraising expectations may influence not just who gives, but how much is given. Taken together, these patterns indicate that family philanthropy operates along multiple dimensions (participation and magnitude) each of which has implications for how private contributions supplement public funding and potentially reinforce differences in schools’ fundraising capacity.
The idea that parents and their families engage in various activities, such as donating to a school, to enhance their children’s educational success has, in previous literature, been referred to as opportunity hoarding. As Voyer (2019, p. 7) explains: ‘[p]arent money in public schools can be seen as opportunity hoarding because such funds provide school-based academic advantages over schools without such parent investments [. . .]’. The opportunity hoarding standpoint raises critical questions about the implications of donations in K–12 schooling. Clearly, donations from families with children, along with other forms of private philanthropy, can enhance educational opportunities by supplementing public funding. These contributions enable schools to offer extracurricular activities, STEM initiatives, arts education, and other enrichment programs that might otherwise receive insufficient or declining public support. Such donations may also support teachers by funding professional development, classroom resources, and even salary supplements, which can serve as a magnet for attracting and retaining high-quality educators.
At the same time, it is equally important to acknowledge the potential downsides of a public education system where donations from parents and their families take a more prominent role. Our research shows a positive relationship between income and donations, indicating that high-income families, which are likely to be living in affluent school districts, may be sending their donations to already prosperous schools and thus exacerbate current funding inequalities between schools. Furthermore, regulators and policymakers may use donations as a reason to save on public funding for K–12 education, shifting the responsibility for education more toward private organizations such as foundations and families. Although this research note cannot provide any major insights regarding these concerns, it has demonstrated that donations from families with children are both frequent, and often substantial, meaning future research focusing on why and how parents and their families donate to K–12 education is warranted, for example, how many of these donors elect to restrict their gifts, and if so, what those restrictions entail. Moreover, while this study focuses on the perspective of donors, further research can increasingly also deal with how schools, both public and private, develop strategies to complement other income streams with donations for their core, as well as complementary educational activities. Furthermore, further research can also explore how our findings hold for post-secondary education and/or for non-formal education.
In sum, our results highlight an important open question: do parent contributions merely displace what schools would otherwise receive from public budgets, or do they genuinely add to the pool of resources available? Future studies could also examine whether such giving reinforces resource gaps between affluent and less advantaged schools, or whether governance mechanisms can redirect private support in more equitable ways. These issues remain central for policymakers concerned with balancing community engagement and fairness in education funding.
Our study also comes with key limitations. First, it relies on survey data, which means we do not observe actions directly but rather rely on self-reports of giving and subjective estimates of donation amounts. Self-reported donation data may be subject to recall errors or memory decay as well as social desirability bias, meaning that our estimates in this study could potentially be either underestimated or overestimated. Second, we only collect data on monetary donations, but giving can also include the giving of time (volunteering) and in-kind donations. Future research ought to ask about these other forms of giving when querying K–12 parents and their families. Third, we only covered one academic year, and it will be critical to assess how and if these donations change over time and how sustainable they are for schools as a source of funding. Finally, we know very little about the recipients of the donations, that is, the schools and school-supporting entities, and future research would benefit from being able to track gifts from parents to schools and the use of the donated funds.
Conclusion
This study offers new national insight into the scope and characteristics of family financial contributions to K–12 education in the United States. Drawing on survey data from more than 2,400 parents, the analysis shows that a substantial share of families with school-aged children provide monetary support to K–12 schools, with clear differences across school sectors. Families with children enrolled in private and charter schools are more likely to donate, and families with children in private schools tend to give larger amounts than those with children in public schools. Together, these findings indicate that parental philanthropy is an increasingly salient feature of the contemporary K–12 education landscape.
Taken together, the results underscore the growing importance and complexity of family donations in an era of fiscal pressure, declining enrollment, and heightened reliance on nonprofit and private support. While parental giving can supplement public resources and enable schools to expand educational opportunities, it also raises important questions about governance and the ways in which private contributions may interact with existing differences in school resources and fundraising capacity. By establishing baseline patterns of giving among families with children, this study lays the groundwork for future research on how parental philanthropy complements public funding and influences the organization and financing of K–12 education. For scholars, practitioners, and policymakers alike, understanding the role of family donations is essential to assessing the evolving boundaries between public provision and private support in K–12 education.
In sum, this study provides baseline evidence on an increasingly salient but underexamined source of educational funding. The findings have practical implications for school leaders and nonprofit organizations seeking to design sustainable fundraising strategies, and policy implications for policymakers concerned with the growing role of private contributions in publicly funded education systems. In particular, the results underscore the need to consider how reliance on family donations may reinforce disparities across schools and districts, especially in contexts of declining public funding and enrollment.
Footnotes
Appendix
Ordinal logistic regression predicting donation amounts to K–12 education in the past 12 months.
| Predictors | Odds ratios | CI | p |
|---|---|---|---|
| Gender [Female] | 0.62 | 0.46–0.82 | 0.001 |
| Education [College] | 1.54 | 1.11–2.12 | 0.009 |
| Income [Low income] (ref.) | |||
| Income [Middle income] | 1.84 | 1.27–2.67 | 0.001 |
| Income [High income] | 3.86 | 2.52–5.95 | <0.001 |
| Area [Metropolitan] (ref.) | |||
| Area [Suburban] | 0.50 | 0.35–0.69 | <0.001 |
| Area [Small town] | 0.69 | 0.38–1.25 | 0.224 |
| Area [Rural] | 0.49 | 0.30–0.82 | 0.007 |
| Generation [GenZers] (ref.) | |||
| Generation [Millennials] | 0.71 | 0.40–1.26 | 0.244 |
| Generation [GenXers] | 0.67 | 0.37–1.23 | 0.199 |
| Generation [Baby Boomers] | 1.32 | 0.53–3.29 | 0.547 |
| Hispanic [Hispanic] | 1.21 | 0.87–1.69 | 0.255 |
| Race [Other] (ref.) | |||
| Race [Black] | 0.98 | 0.62–1.55 | 0.936 |
| Race [Asian] | 0.71 | 0.35–1.41 | 0.321 |
| Race [Native American] | 0.73 | 0.32–1.62 | 0.442 |
| Ideology [Conservative] (ref.) | |||
| Ideology [Liberal] | 0.78 | 0.55–1.09 | 0.147 |
| Ideology [Moderate] | 0.90 | 0.64–1.26 | 0.535 |
| Religiosity | 1.26 | 1.16–1.37 | <0.001 |
| Direction K–12 [Wrong track] (ref.) | |||
| Direction K–12 [Right Direction] | 0.82 | 0.60–1.11 | 0.195 |
| Direction K–12 [No Opinion] | 0.52 | 0.30–0.90 | 0.021 |
| at Charter | 1.12 | 0.69–1.80 | 0.649 |
| at Private | 1.71 | 1.19–2.47 | 0.004 |
| Observations | 695 | ||
| Nagelkerke R2: | 0.316 | ||
Note. The dependent variable is an ordinal measure of total family donations to K–12 education in the past 12 months, with categories ranging from ‘less than US$50’ to ‘US$2,000 or more’. Odds ratios greater than 1 indicate higher odds of being in a higher donation category. Cut points (thresholds) between categories are not shown for brevity. Reference categories are shown in parentheses.
Funding
The authors received no financial support for the research, authorship, and/or publication of this article.
Declaration of Conflicting Interests
The authors declared no potential conflicts of interest with respect to the research, authorship, and/or publication of this article.
Data Availability Statement
The authors did obtain the data for this research note from EdChoice, and are not in the position to share the data.