



Abstract
Background
The relationship between the functional recovery of patients in the subacute phase of stroke and descending neural drives from the non-injured hemisphere to the paretic lower limb muscles during movement remains unclear. We investigated this relationship in patients with severe paralysis.
Methods
Twenty-nine patients with stroke were recruited and categorized into three groups based on paralysis severity. Within 1 month of admission, each patient received 10 min of anodal tDCS applied to the cortical motor areas of the injured or non-injured hemispheres. Each stimulation condition was performed in a random order, one day at a time, with a 7-day washout period. Before and after each stimulation, patients performed multiple voluntary knee extensions on the paretic side 20% of their maximal strength, sustained for 6 s. Coherence analysis of EMG signals from proximal and distal segments of the vastus medialis muscle was conducted to quantify common neural drive from each cortical motor-related area based on coherence variations before and post stimulation in each condition. We investigated the relationship between the excitability of the descending neural pathway from the non-injured hemisphere in the initial phase and motor function recovery at 3 months.
Results
No significant differences emerged across groups in the change in coherence values when the non-injured hemisphere stimulated. However, within the severe group, an increase in β-band coherence following non-injured hemisphere stimulation correlated with greater recovery of paretic-side muscle strength and trunk function at 3 months.
Conclusion
Our findings deepen understanding of paralysis pathophysiology based on severity level and may support the development of targeted neuromodulation strategies to enhance motor recovery.
Introduction
The severity of lower limb paralysis in the early post-stroke period has been linked to clinical outcomes, such as motor function and gait ability (Tanino et al., 2014; Veerbeek et al., 2018). However, some patients with severe lower limb paralysis unexpectedly display better recovery (Tanino et al., 2014; Veerbeek et al., 2018).
Recent advances in neurophysiological techniques such as transcranial magnetic stimulation (TMS), diffusion tensor imaging (DTI), and functional magnetic resonance imaging (fMRI) have enabled studies on corticospinal tract (CST) excitability and other descending neural drives in patients with stroke (Auriat et al., 2015). These studies indicate that changes in the excitability of cortical motor areas and the degree of excitability of ipsilesional descending tracts projecting to the affected limb, as well as their fiber volume, determine variations in recovery (Jang et al., 2016; Kim et al., 2006; Yang et al., 2010). Notably, CST fibers are susceptible to post-stroke damage, and the increase in excitability of the ipsilesional CST is limited in patients with severe paralysis. Some of these patients have increased excitability of descending neural pathways projecting from the non-injured hemisphere to the affected lower limb muscle group (Benecke et al., 1991; Jang et al., 2016; Jayaram et al., 2012). In particular, descending neural pathways originating from non-injured motor-related sites, such as the contralesional CST and the cortico-reticulospinal tract dominate the lower as well as the upper extremities (Cleland & Madhavan, 2021). In patients with mild paralysis, increased excitability of the contralesional CST results in negative effects, such as abnormal patterns of muscle activity and reduced walking speed (Bani-Ahmed & Cirstea, 2020; Jayaram et al., 2012). However, previous studies suggest that increased excitability of the contralesional CST is an effective compensatory mechanism in patients with severe paralysis in the chronic phase (Jang & Cho, 2022). Additionally, given that the contralesional CST fiber volume increases in the subacute phase, this is likely to be associated with the recovery of patients with severe paralysis in the subacute phase (Jang et al., 2016). However, the role of the descending neural drives from the non-injured hemisphere in the restoration of motor function and gait ability in severely affected patients during the subacute phase of recovery remains unknown.
Electromyography (EMG)–EMG coherence is an important indicator of descending neural drives from cortical motor areas (Grosse et al., 2002). Motor evoked potentials (MEP) amplitude assesses the structural connectivity of a pathway, which is not necessarily associated with the level of contribution of that pathway to movement (Bestmann & Krakauer, 2015). EMG–EMG coherence measures the synchrony of muscle activity and provides a degree of actual functional connectivity during movements (Ritterband-Rosenbaum et al., 2017). The β frequency band is particularly associated with corticospinal drive (Fisher et al., 2012; Grosse et al., 2002).
Moreover, transcranial direct current stimulation (tDCS) has been used in previous studies to non-invasively increase the excitability of motor areas and their CST fibers during movement (Nitsche & Paulus, 2000). Studies on healthy individuals and patients with stroke have shown that anodal tDCS of the primary motor cortex increases β-band intermuscular coherence during upper limb movement (Power et al., 2006). Anodal stimulation of the motor cortex of the non-injured hemisphere increases the excitability of the contralesional CST in patients with severe paralysis (McCambridge et al., 2018). We propose that using tDCS to modulate motor-related areas in the non-injured hemisphere can assess the functional connectivity of descending neural drives from contralesional motor-related areas of the lower limb in patients with stroke.
This study aimed to investigate the relationship between the descending neural drives from the non-injured hemisphere and clinical recovery in patients with severe stroke during the subacute phase. We hypothesized that the increased contralesional descending neural drives would lead to improved recovery of motor function and gait ability of the affected lower limb.
Materials and Methods
Study Design and Participants
In this randomized, single-mask, crossover study (Table 1), we recruited patients with stroke treated at the Hospital involved in the study. Inclusion criteria were as follows: (1) 1–3 months post-stroke, (2) Functional Ambulation Category (FAC) < 3, and (3) partial knee extension ability on the paretic side. Exclusion criteria were as follows: (1) history of cerebrovascular/orthopedic diseases, (2) lower limb pain, (3) metal implants (intracranial/cardiac), (4) Mini-Mental State Examination <24, (5) task comprehension issues, (6) impaired consciousness, and (7) bilateral/cerebellar lesions. The Ethics Committee of the Hospital involved in the study provided ethical approval (ethics review number: 20220007). All patients provided informed consent. Baseline measurements and initial evaluations were performed within 1 month of admission.
Differences in Clinical Evaluations Between Groups.
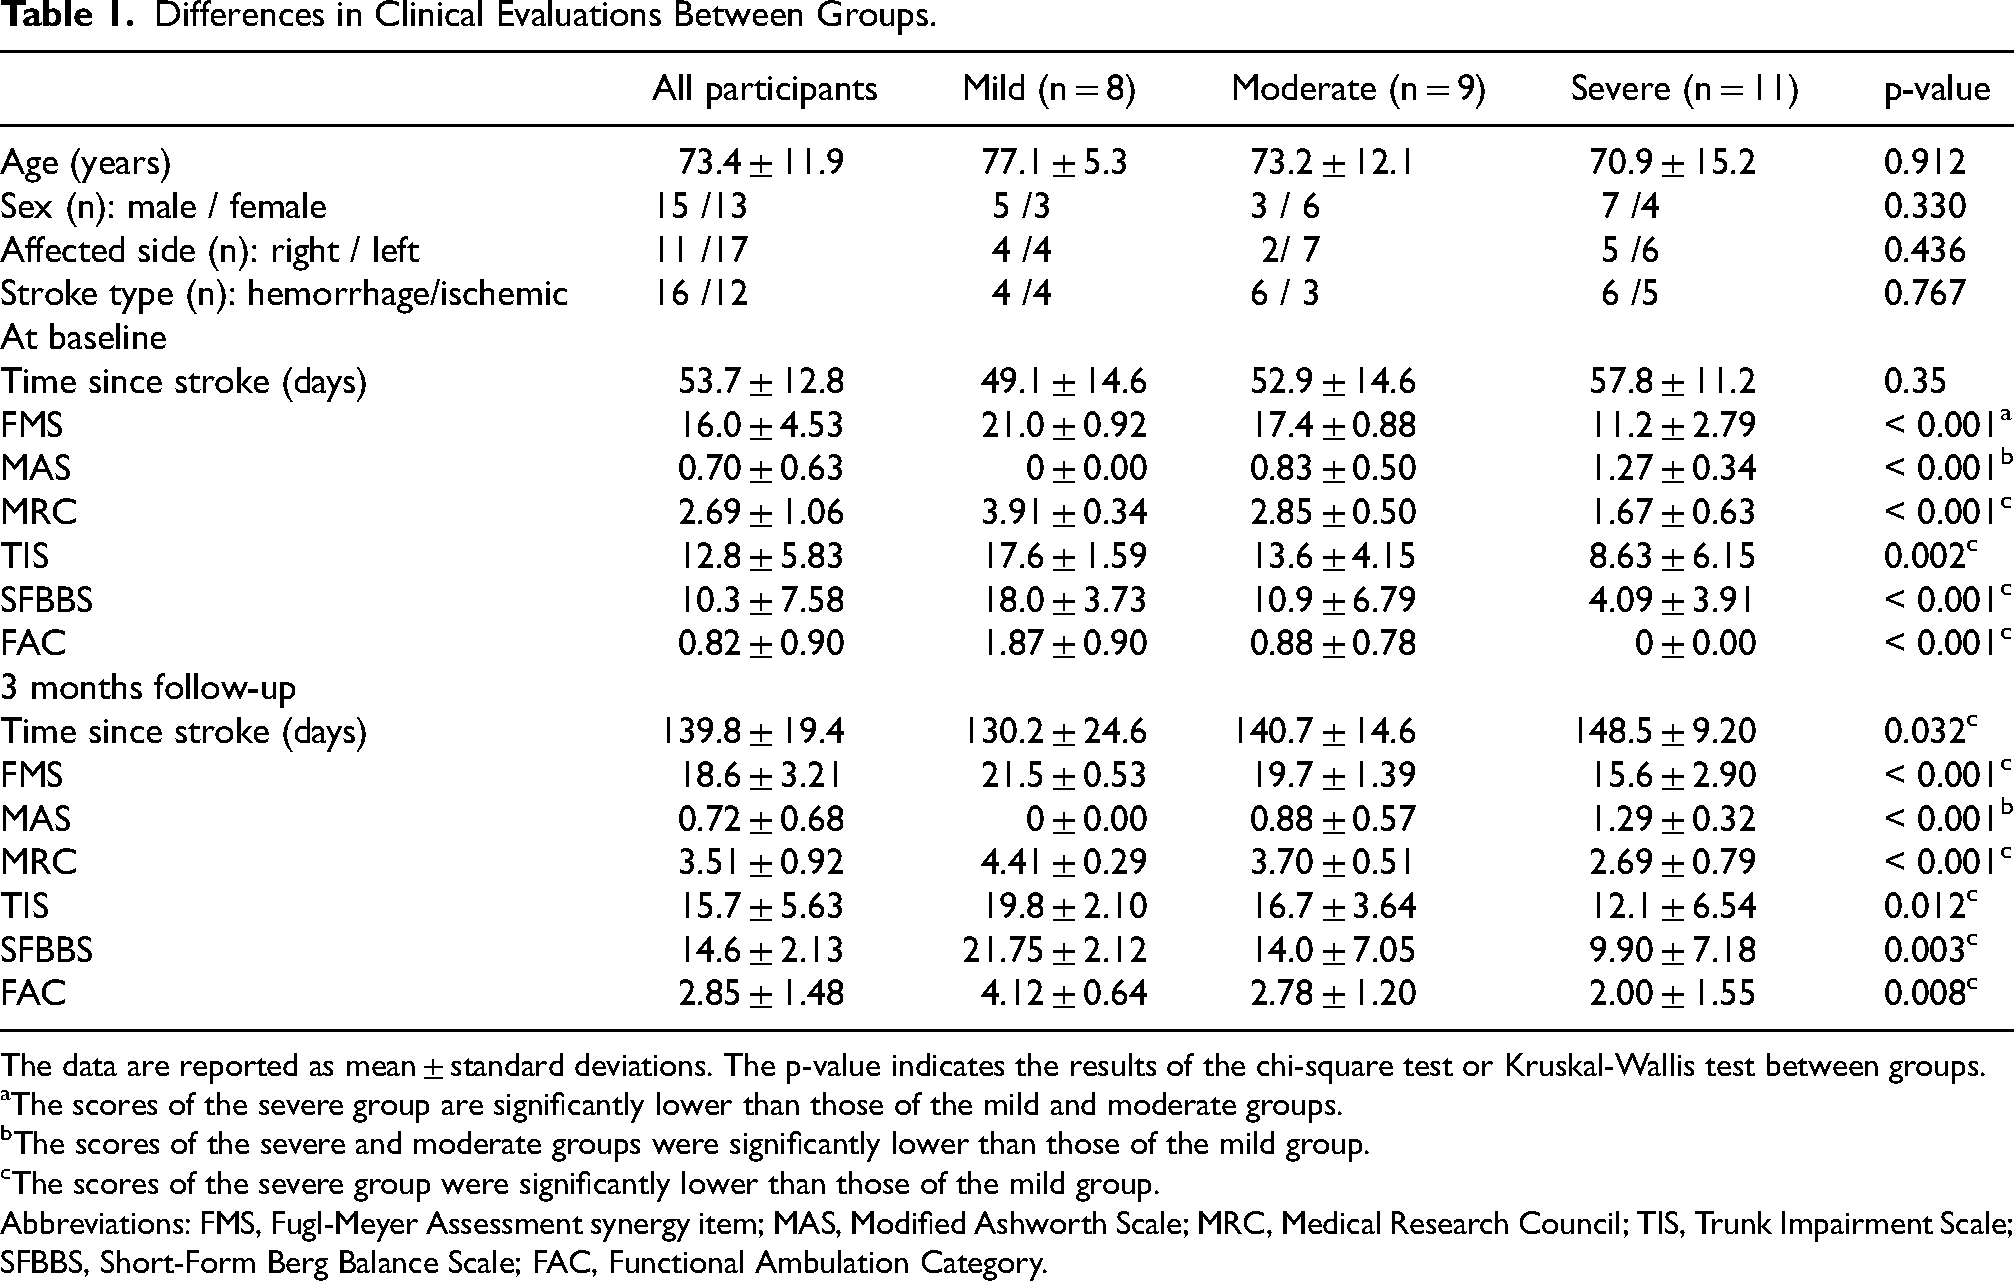
The data are reported as mean ± standard deviations. The p-value indicates the results of the chi-square test or Kruskal-Wallis test between groups.
aThe scores of the severe group are significantly lower than those of the mild and moderate groups.
bThe scores of the severe and moderate groups were significantly lower than those of the mild group.
cThe scores of the severe group were significantly lower than those of the mild group.
Abbreviations: FMS, Fugl-Meyer Assessment synergy item; MAS, Modified Ashworth Scale; MRC, Medical Research Council; TIS, Trunk Impairment Scale; SFBBS, Short-Form Berg Balance Scale; FAC, Functional Ambulation Category.
Experimental Setup and Protocol
Figure 1 outlines the experimental protocol. Patients within 1 month of admission, in the first half of the subacute phase (1–3 months post-stroke), were seated with hip and knee joints at 90°. Patients performed isometric knee extensions 3 × 6 s each at maximal voluntary contraction (MVC). Muscle strength was assessed using a manual muscle strength meter (Power gauge: Namba Manufacturing Co., Kanagawa, Japan), with the highest value recorded used as the MVC. Patients then performed six isometric extensions at 20% MVC for 6 s with feedback from the EMG waveforms and researcher. The participants received tDCS applied to motor areas of the injured or non-injured hemispheres for 10 min. They also performed knee extensions on the affected side at 20% MVC pre- and post-stimulation. The participants were in a resting state during the stimulation. Each stimulation condition was performed in a random order, one day at a time, with a 7-day washout period. To assess the excitability of the initial descending neural pathway and the extent of functional recovery in patients, clinical evaluations were repeated at 3 months post-baseline. Patients discharged within 2 months were excluded. Daily physical, occupational, and speech therapy continued without tDCS during the study period.
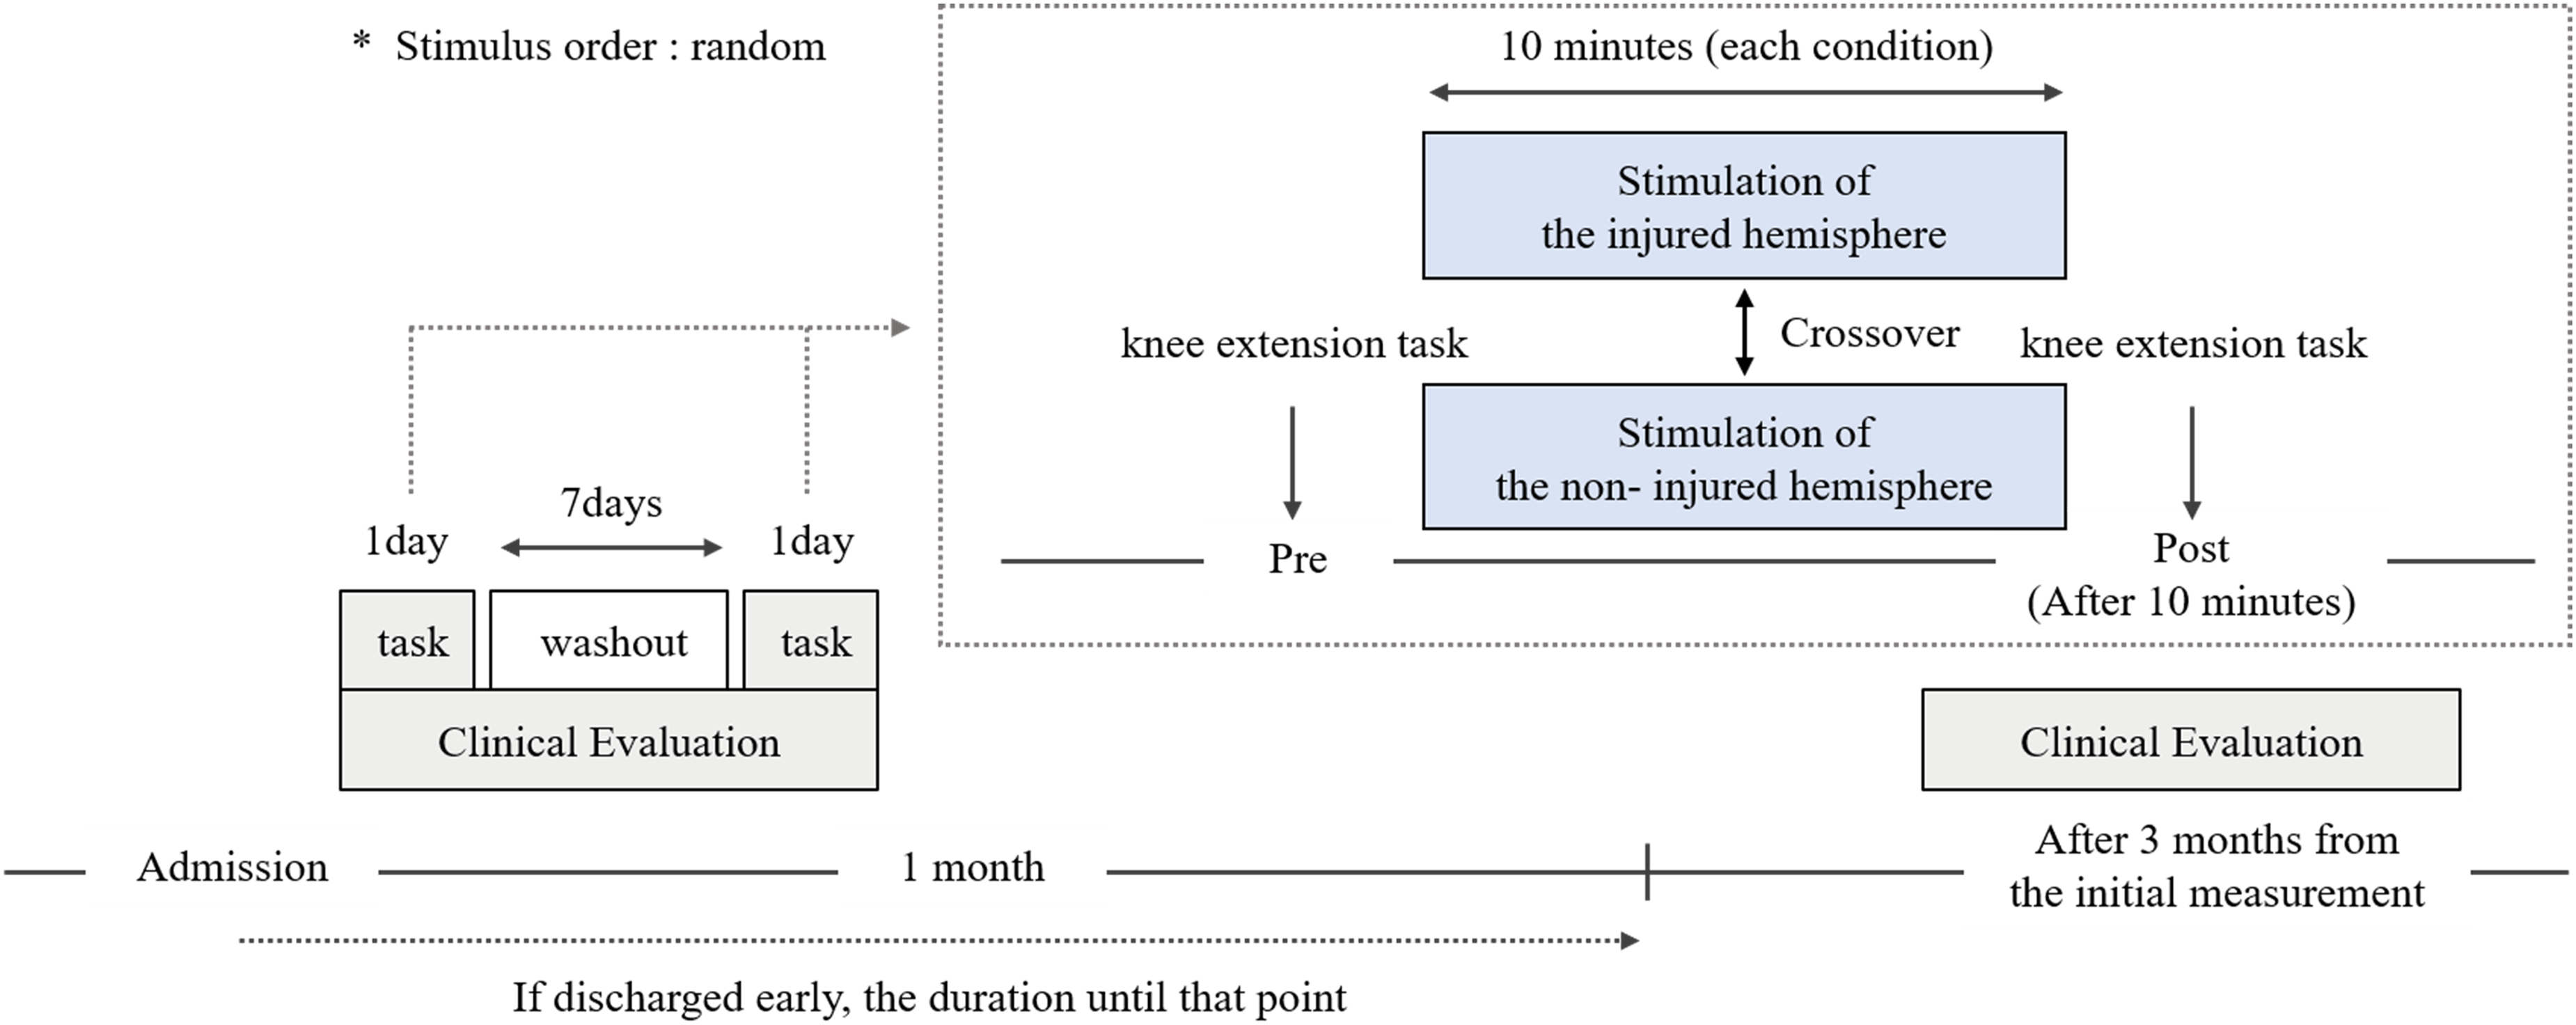
Experimental Protocol. Stimulation of the Injured or Non-Injured Hemispheres was Performed in a Random Order, One Day at a Time Within 1 Month of Admission. Experimental Tasks Were Performed Before and 10 min After Each Stimulation. Clinical Assessments Were Conducted at Enrollment and After 3 Months.
Measurement Items and Clinical Evaluation
We assessed paralysis severity and sensory impairment using the Fugl–Meyer Assessment (FMA) tool of the lower limb. Subsequently, we categorized patients into three groups using the FMA lower limb synergy (FMS) score (Bowden et al., 2010): mild (>19 points), moderate (16–19 points), and severe (<16 points), based on paralysis severity at the initial evaluation. The reason for dividing patients into groups based on the severity of paralysis at the initial evaluation was to assess the degree of longitudinal functional recovery in patients with similar levels of paralysis at the initial evaluation. This study focused specifically on functional recovery in the group that was severely ill at the initial evaluation. Spasticity was evaluated using the Modified Ashworth Scale (MAS) for plantar flexors (Gregson et al., 2000), with a score of 1 + recorded as 1.5. We assessed lower limb strength during hip flexion, knee extension, and dorsiflexion on the paretic side using the MRC scale (Gregson et al., 2000), with scores ranging from 0 to 5, and calculated mean scores. Additionally, we assessed trunk function, balance ability, and gait ability using the trunk impairment scale (TIS) (Verheyden et al., 2004), Short Form Berg Balance Scale, and FAC (Mehrholz et al., 2007), respectively.
EMGs were recorded in the proximal and distal parts of the paretic vastus medialis (VM) muscle using bipolar Ag-AgCl surface electrodes with 2.0 cm inter-electrode distance (Gait Judge System: Pacific Supply Corporation, Osaka, Japan; sampling rate: 1 kHz). In addition, the lower leg angular velocity was recorded using an inertial sensor (Gait Judge System, Pacific Supply Co., Ltd., Osaka, Japan, sampling rate: 1 kHz) affixed just above the external ankle joint on the affected side. We chose the VM because we believe that the thigh muscles contribute more to the recovery of walking ability in patients with severe stroke than distal muscles such as the tibialis anterior(Hayashi et al., 2024; Norton & Gorassini, 2006). In addition, previous studies using TMS and EMG–EMG coherence have reported that CST controls the thigh muscles (Jayaram et al., 2012; Norton & Gorassini, 2006).
The tDCS Set-up
The tDCS was not used as an intervention, but as a way of assessing the excitability of the descending neural pathways originating in each hemisphere during movement. The tDCS stimulation electrodes and sponge pads (DC-Stimulator Plus, NeuroConn, Germany) were 5 × 7 cm (35 cm2). We soaked the sponge pad surface in physiological saline and applied a conductive gel under the electrodes to reduce contact impedance. We positioned the Anodes from Cz to C3 or C4 according to the International EEG 10–20 method and cathodes in the supraorbital region. Stimulation intensity was 2.0 mA for 10 min with a current density of 0.057 mA/m², within safety guidelines (Bikson et al., 2009; Nitsche et al., 2003). Resistance between electrodes was <5 kΩ (DaSilva et al., 2011). Side effects, such as discomfort or site redness, were evaluated during tDCS (Thair et al., 2017).
Data Recording and Analysis
All EMG preprocessing followed the guidelines outlined in the Surface Electromyography for the Non-Invasive Assessment of Muscles. Electrode pairs for the VM muscles were placed at least 10 cm apart to minimize the risk of crosstalk (Hansen et al., 2005). Surface electrodes were positioned over the muscle bellies after the participant's skin was gently cleaned with alcohol. Raw EMG signals were processed with a zero-lag fourth order Butterworth filter and a 10–450 Hz bandpass filter. Signals were subjected to mean subtraction, rectification, and subsequent smoothing using a fourth-order zero-lag Butterworth filter and a 10-Hz low-pass filter. Mean muscle output was calculated from six measurements using a manual muscle tester. The difference from 20% MVC was the average absolute difference between 20% MVC and muscle output. Muscle activity onset was identified using an inertial sensor. Proximal and distal VM amplitudes were calculated for each trial.
Coherence
We also performed an EMG–EMG (intramuscular) coherence analysis on two time-series signals (rectified data) recorded from the proximal and distal VMs. Wavelet coherence analysis (Morlet), which is used to analyze the correlation between two signals in different time and frequency bands and is suitable for analyzing non-stationary time series data, was employed (Bigot et al., 2011). The ‘wcoherence’ function in MATLAB R2021b (MathWorks, Inc., Natick, MA, USA) was used for this calculation. In this analysis, the coherence was calculated using data from six trials for each participant, where each trial consisted of a 4-s segment corresponding to the central part of the knee extension movement (excluding 1 s before and after the movement). The total number of trials for each participant was 24 (4 s × 6 trials), as it captured stable muscle activity during the task. The wavelet coherence of the two variables x and y is defined as follows:
The coherence function assesses linear correlation within the frequency domain, providing values from 0 to 1, where 1 indicates a perfect linear correlation. EMG–EMG coherence estimate reveals the proportion of activity in one surface EMG signal at a given frequency that can be predicted by activity in the other surface EMG signal. This quantifies the strength and frequency ranges of common synaptic inputs distributed across the motor neuron pool in the spinal cord and time series. Given that β band (15–30 Hz) coherence reflects the degree of excitability of the descending neural pathway from the motor cortex, we computed the mean of the β band values for each trial (Barthélemy et al., 2010; Fisher et al., 2012; Grosse et al., 2002; Ritterband-Rosenbaum et al., 2017). In addition, tDCS increases EMG-EMG (Power et al., 2006; Tomczak et al., 2013) and EMG-EEG (Dutta & Chugh, 2012) coherence in the β band. We z-transformed coherence values for pre- and post-stimulation and between-patient comparisons (Nojima et al., 2018) and indexed the excitability of the common neural drives from each cortical motor-related area based on the change in pre- and post-stimulation coherence values for each condition. Figure 2 shows a typical case of a patient with severe motor paralysis. Figure 2c and f show the change in coherence pre- and post-stimulus in each hemisphere. In a previous study, changes in EMG–EMG coherence of the contralateral upper limb muscles pre and post 10 min of tDCS stimulation were significantly correlated with changes in MEPs induced by TMS (Power et al., 2006). This supports the hypothesis that EMG–EMG coherence reflects both the structural and functional connectivity of the neural drive (Fisher et al., 2012; Norton & Gorassini, 2006; Ritterband-Rosenbaum et al., 2017), and that changes in EMG–EMG coherence reflect the excitability of descending neural pathways originating from the stimulated side. Therefore, the observation of increased coherence values after tDCS stimulation in this study was recorded as an indicator of the descending neural drive excitability from the motor-related areas of the stimulated side during lower limb movement. Since tDCS modulation is related to the severity of damage (Nemanich et al., 2023; Schlaug et al., 2008), stimulation of the injured hemisphere may increase the β-band coherence in mild cases, whereas stimulation of the non-injured hemisphere may increase it in severe cases.

Time Series Waveforms of Muscle Activity and Coherence During the Task in a Single Patient. (a–c) Depict Activity Originating from the Injured Hemisphere, while (d–f) Depict Activity Originating from the Non-injured Hemisphere. (a) and (d) Show Muscle Activity and β-band Coherence Before Stimulation of Each Hemisphere, Whereas (b) and (e) Show Them After Stimulation. (c) and (f) Illustrate the Changes in Coherence Before and After Stimulation, with (c) Representing Common Neural Drive from the Injured Hemisphere and (f) Representing Common Neural Drive from the Non-Injured Hemisphere. A Positive Change Indicates an Increase in Neural Drive from the Stimulated Side.
Statistical Analyses
A Shapiro–Wilk test was used to assess the assumption of normality. Chi-squared and Kruskal–Wallis tests (with post hoc Steel–Dwass testing) examined differences in baseline characteristics and clinical scores between baseline and 3-month follow-up in each group (mild, moderate, severe). A 2 × 2 × 3 [condition (injured/non-injured hemisphere) × time (pre/post) × group (mild/moderate/severe)] repeated-measures analysis of variance (ANOVA) was performed to assess differences in mean muscle output and deviation from 20% MVC pre- and post-stimulation. A 2 × 2 [condition (injured/non-injured hemisphere) × time (pre/post)] repeated-measures ANOVA assessed coherence values differences pre- and post-stimulation for each condition. Additionally, a 2 × 3 [condition (injured/non-injured hemisphere) × group (mild/moderate/severe)] repeated-measures ANOVA examined coherence differences for each group under each condition. Post-tests used Bonferroni correction for significant main effects and interactions. Spearman's rank correlation coefficients determined the relationship between descending neural drives from the injured and non-injured hemispheres and clinical outcomes at 3 months. Statistical significance was set at p < 0.05. All analyses were performed using MATLAB R2021b (MathWorks Inc., Natick, MA, USA).
Results
Among the 30 enrolled patients, the mean age was 73.4 ± 11.9 years, and the mean duration since the onset of stroke was 53.7 ± 12.8 days. There were no reports of adverse events, such as pain, itching, or discomfort, at the site of electrode application during or after the experiment following the use of tDCS.
Clinical Evaluation in Each Group
Two patients were excluded owing to early discharge. Eight patients were assigned to the mild group, nine to the moderate group, and eleven to the severe group. Baseline characteristics and clinical outcomes at enrollment and the 3-month follow-up are in Table 1. In the post-hoc test (Steel–Dwass testing), clinical scores were significantly lower in the severe group than those in the mild and moderate groups at both assessments. However, some patients in the severe group showed improvements in motor paralysis and muscle strength to the same extent as those in the mild and moderate groups.
Differences in Muscle Output
Supplementary eFigure 1 shows mean muscle force differences pre- and post-stimulation and differences from 20% MVC. There was a main effect of group on mean muscle force (F [2, 50] = 9.895, p < 0.001). Post-hoc tests revealed the severe group had significantly lower scores than the mild group (p < 0.001), and the moderate group had lower scores than the mild group (p = 0.010). No main effects of condition (F [1, 50] = 0.212, p = 0.647) or timing (F [1, 50] = 0.005, p = 0.946) or their interactions were found. There was a main effect of group on the difference at 20% MVC (F [2, 50] = 17.076, p < 0.001), with post-hoc tests showing the severe group had lower scores than the mild (p < 0.001) and moderate (p = 0.009) groups, and the moderate group had lower scores than the mild group (p = 0.009). No main effects of the condition (F [1, 50] = 0.019, p = 0.891), timing (F [1, 50] = 1.199, p = 0.279) or their interactions were found. These results show that in tasks involving 20% MVC, the mild group had greater muscle output and better ability to control muscle output than the moderate and severe groups. They also show that intra-individual effects, such as tDCS and measurement timing, were small for all groups.
Comparison of Coherence Between all Patients and Groups
Figure 3 shows pre- and post-stimulation coherence differences and intergroup comparisons for each condition at the initial measurement. Coherence values increased after stimulation in all conditions, with a main effect of time (F [1, 55] = 4.643, p = 0.015), but no interaction (F [1, 55] = 0.162, p = 0.688). Change in coherence values showed an interaction between groups and conditions (F [2, 25] = 3.909, p = 0.041). The mild and moderate groups showed a greater change in coherence values when the injured hemisphere was stimulated than the severe group (p = 0.048, p = 0.037).

Comparison of Coherence Between all Patients and Groups. Each Figure Displays the Pre- and Post-Stimulation Coherence Differences for Each Condition at the Initial Measurement (a), and the Intergroup Comparisons of Change in Coherence Values for Each Condition at the Initial Measurement (b). The Crosses in (a) Indicate Values Above the Upper Quartile (75%) or Below the Lower Quartile (25%) That Exceed 1.5 Times the Interquartile Range. The Horizontal Line in (b) Represents the Mean of Each Value. Cross,triangle, and circle Indicate the Mild, Moderate, and Severe Groups, Respectively. The Asterisks Indicate That a Significant Difference was Found by Post-hoc Testing (Bonferroni Correction). Coherence Values Increased Significantly in all Conditions (a). The Mild and Moderate Groups Showed a Greater Change in Coherence Values When the Injured Hemisphere was Stimulated Than the Severe Group (b). *p < 0.05.
Relationship Between Descending Neural Drives at the Initial Measurement and Each Clinical Evaluation After 3 Months
Figure 4 illustrates the relationship between the change in coherence values when each hemisphere stimulated at the initial measurement and clinical assessments at 3 months, according to groups. The change in coherence values during stimulation of each hemisphere indicates the excitability of the descending neural drive from the motor-related area on the stimulated side during lower limb movement. The change in coherence values when the injured hemisphere stimulated showed significant correlations with FMS (ρ=0.413, p = 0.022), MAS (ρ=−0.467, p = 0.009), and MRC (ρ=0.407, p = 0.040) in all patients. The change in coherence values when the non-injured hemisphere stimulated showed significant correlations with MRC (ρ=0.766, p = 0.006) and TIS (ρ=0.582, p = 0.048) in the severe group, but no significant correlation was observed with FAC (ρ=0.391, p = 0.173). Detailed results are presented in Table 2. Supplementary eTable 1 shows the relationship between β-band coherence values before tDCS and clinical evaluation at 3 months. In the mild group, there was a significant correlation with MRC (ρ=0.757, p = 0.032), but no significant correlations were found in the other groups.
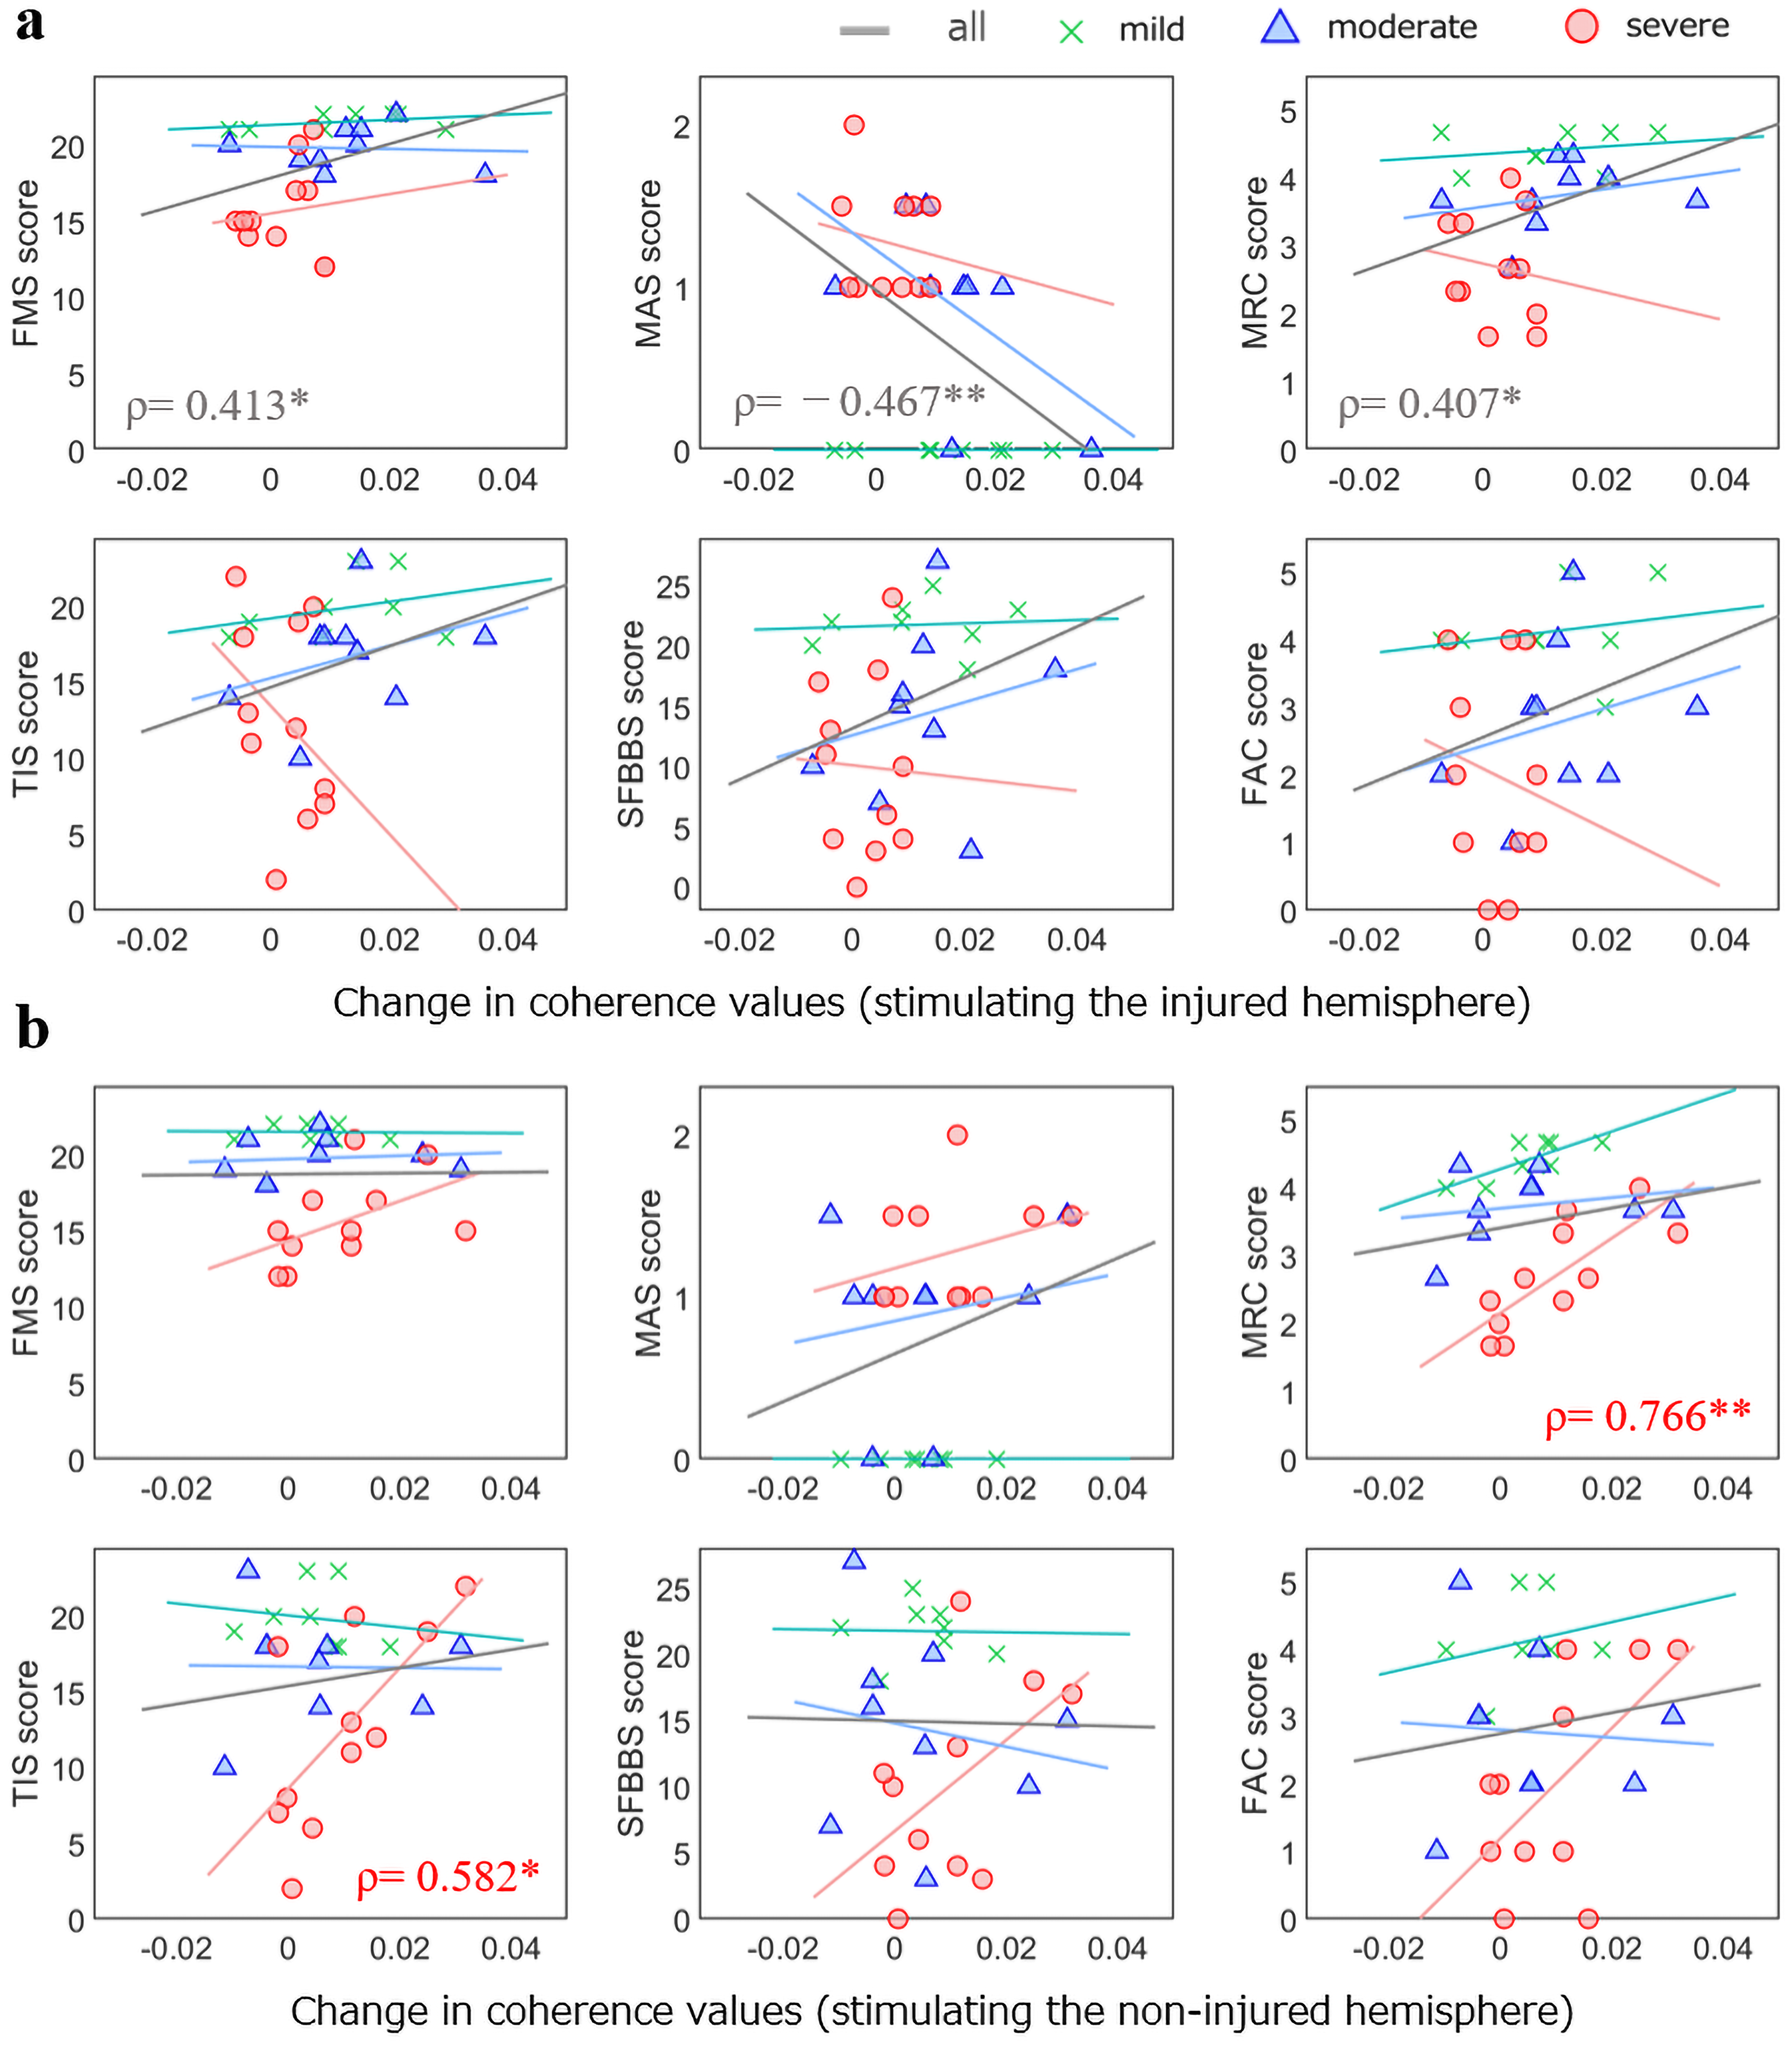
Relationship Between Descending Neural Drives at the Initial Measurement and Clinical Evaluations after 3 Months. (a) Relationship Between Clinical Evaluation and the Change in Coherence Values When the Injured Hemisphere Stimulated; (b) Relationship Between Clinical Evaluation and the Change in Coherence Values When the Non-Injured Hemisphere Stimulated. Gray: All Patients; Cross: Mild Disease Group; Triangle: Moderate Disease Group; and Circle: Severe Disease Group. The Asterisks Indicate that there was a Significant Difference According to Spearman's Rank Correlation Coefficient. *p < 0.05, **p < 0.01. Abbreviations: FMS, Fugl-Meyer Assessment Synergy Item; MAS, Modified Ashworth Scale; MRC, Medical Research Council; TIS, Trunk Impairment Scale; SFBBS, Short-Form Berg Balance Scale; FAC, Functional Ambulation Category.
Spearman's Rank Correlation Results Showing the Relationship Between the Descending Neural Drives at the Initial Measurement and Clinical Evaluations at 3-Month Follow-up.

†p < 0.10, *p < 0.05, **p < 0.01.
Abbreviations: FMS, Fugl-Meyer Assessment synergy item; MAS, Modified Ashworth Scale; MRC, Medical Research Council; TIS, Trunk Impairment Scale; SFBBS, Short-Form Berg Balance Scale; FAC, Functional Ambulation Category.
Discussion
This study investigated the relationship between the change in coherence values when the non-injured hemisphere was stimulated and the recovery of motor function and gait ability in patients with severe stroke. Our results showed that increased excitability was associated with improved muscle strength and trunk function on the paretic side at 3 months, though it was not linked to gait ability. This suggests that descending neural drives from the non-injured hemisphere is an effective compensatory mechanism for motor recovery in the subacute phase post-stroke.
Comparison of Coherence for Each Stimulation Condition
Coherence increased after stimulation across all the conditions. The mild and moderate groups exhibited a greater change in coherence values following stimulation of injured hemisphere than the severe group. Previous studies on stroke patients and children with cerebral palsy have reported that tDCS-induced modulation of the injured hemisphere was greater in cases of mild injury (Nemanich et al., 2023; Schlaug et al., 2008). This suggests that the severity of the injury influences neuroplastic changes induced by tDCS. In this study, we did not directly assess the extent of neural pathway damage using TMS or DTI; however, FMS is a relevant indicator. Therefore, in the mild to moderate group, where FMS scores were higher, tDCS-induced modulation may have been more pronounced, leading to greater changes in coherence values. Additionally, although the mean FMS score of the severe group was low at the initial assessment (11.2 points), no significant intergroup differences were observed in the change in coherence values following stimulation of the non-injured hemisphere. Previous studies have shown that tDCS of the non-injured hemisphere modulates contralesional CST excitability in patients with severe stroke (McCambridge et al., 2018). This may be related to the subacute stage of the disease. During this phase, patients experience bilateral hemispheric hyperactivity, which decreases in mild cases over time (Jang et al., 2016; Kim et al., 2006). Early subacute phase enrollment may have led to similar coherence changes across groups. Coherence is a measure of functional neural connectivity that assesses the excitability of neural pathways during specific movements. Previous studies applying tDCS to the motor cortex of the non-injured hemisphere used resting MEP as a measure of structural neural connectivity (McCambridge et al., 2018). Therefore, unlike structural neural connectivity, functional connectivity may be less likely to increase during the subacute phase.
Relationship Between Baseline Descending Neural Drives and Lower Limb Muscle Strength and Trunk Function After 3 Months
The change in coherence values when the injured hemisphere stimulated was correlated with FMS, MAS, and MRC in all patients, consistent with previous studies on CST excitability (Chang et al., 2015). This underscores the importance of the descending neural drive from the injured hemisphere. In the severe group, the change in coherence values when the non-injured hemisphere stimulated was linked to the recovery of paretic lower limb muscle strength and trunk function. Increased excitability of the CST from the non-injured hemisphere can strengthen inhibitory connections between hemispheres in patients with mild paralysis (Binder et al., 2021), leading to reduced coordination and slower gait (Bani-Ahmed & Cirstea, 2020; Jayaram et al., 2012; Madhavan et al., 2010). However, in severe cases, inhibitory connections may weaken or convert to facilitatory connections, aiding recovery (Plow et al., 2016). A previous study demonstrated that the volume of contralesional CST fibers was associated with ankle dorsiflexion strength in patients with severe chronic-phase paralysis (Jang & Cho, 2022), suggesting similar results may apply to our patients with subacute stroke. Additionally, the contralesional descending tract's extensive neural connections control trunk muscles (Strutton et al., 2004), with studies linking contralesional trunk muscle MEPs to trunk function in patients with subacute stroke (Fujiwara et al., 2001). Although this study focused on the VM muscle, VM coherence may relate to trunk function through these pathways.
Relationship Between Baseline Descending Neural Drives and Gait Ability at 3 Months
The change in coherence values when the non-injured hemisphere was stimulated showed no association with full gait recovery. Previous studies have shown that the CST and other pathways, like the cortico-reticulospinal tract, are linked to gait recovery in patients with stroke (Yeo et al., 2020; Yoo et al., 2014). Nevertheless, when CST and other cortical pathways are impaired after a stroke, the excitability of brainstem pathways, such as the reticulospinal and vestibulospinal tracts, increases (Li et al., 2019). These pathways, crucial for muscle tone control, may significantly influence gait recovery. Coherence values indicate the degree of synchronization between the brain, spinal cord, and muscles, rather than directly reflecting the excitability of specific neural pathways (such as the CST). However, previous studies have suggested that β-band coherence is partially related to CST excitability (Barthélemy et al., 2010; Fisher et al., 2012; Grosse et al., 2002; Ritterband-Rosenbaum et al., 2017). Additionally, the correlation between tDCS-induced changes in MEPs and coherence suggests that changes in coherence may also be associated with CST excitability (Power et al., 2006). Therefore, while changes in coherence values reflect the excitability of descending neural drive from the cortex, gait recovery in severe cases also relies on brainstem pathways other than the CST. As a result, coherence changes alone may not be sufficient to predict gait recovery.
Our findings offer insights into the pathophysiology and intervention strategies for stroke based on paralysis severity. Traditionally, TMS and tDCS have been used to reduce the activity of the non-injured hemisphere and mitigate its inhibitory effect on the injured hemisphere (Schlaug et al., 2008). However, in patients with severe stroke, stimulating the motor cortex of the non-injured hemisphere can enhance upper limb function (McCambridge et al., 2018). Most tDCS studies on lower limb function in patients with stroke have focused on anodal stimulation of the injured hemisphere's motor cortex, and the effect of stimulation of the non-injured hemisphere has not been investigated (Lima et al., 2023). Although this study did not test tDCS on the non-injured hemisphere, our findings support tailored neuromodulation strategies for the subacute phase, depending on severity. Additionally, contralesional CST excitability likely increases during recovery, especially from the acute to subacute phase (Jang et al., 2016). Therefore, our results may be relevant for patients with subacute stroke, though further research on gait recovery in severely affected patients is needed.
This study has some limitations. First, the sample size was relatively small. Therefore, further studies with larger sample sizes are required to provide generalizable results. Second, the study did not account for changes in coherence in the presence of sham stimulus. Third, we did not confirm whether tDCS in the injured or non-injured hemisphere only stimulated the desired hemisphere. However, the tendency for the change in coherence values to differ between the groups depending on the stimulation conditions and the correlation between coherence values and stimulation suggests that this effect is negligible. Fourth, we used coherence to assess the excitability of the descending pathway, but it will be necessary in the future to combine this with an indicator that directly reflects the excitability of the CST, such as changes in MEPs after TMS. Finally, the excitability of the descending neural pathway during walking was not assessed.
Conclusions
This study investigated the relationship between the descending neural drives from the non-injured hemisphere and the recovery of function in patients in the subacute phase following a stroke episode. Our findings suggest that the descending neural drives originating from the non-injured hemisphere were less associated with full gait recovery in severely affected patients; however, they contributed to the recovery of lower limb muscle strength and trunk function. We believe that these results provide important insights into the pathophysiology of paralysis.
Supplemental Material
sj-docx-1-rnn-10.1177_09226028251358166 - Supplemental material for Relationship Between Descending Neural Drives from the Non-Injured Hemisphere and Lower Limb Motor Function and Gait Ability in Patients Following Severe Stroke
Supplemental material, sj-docx-1-rnn-10.1177_09226028251358166 for Relationship Between Descending Neural Drives from the Non-Injured Hemisphere and Lower Limb Motor Function and Gait Ability in Patients Following Severe Stroke by Sora Ohnishi, Naomichi Mizuta, Naruhito Hasui, Yuki Sato, Junji Taguchi, Tomoki Nakatani and Shu Morioka in Restorative Neurology and Neuroscience
Supplemental Material
sj-docx-2-rnn-10.1177_09226028251358166 - Supplemental material for Relationship Between Descending Neural Drives from the Non-Injured Hemisphere and Lower Limb Motor Function and Gait Ability in Patients Following Severe Stroke
Supplemental material, sj-docx-2-rnn-10.1177_09226028251358166 for Relationship Between Descending Neural Drives from the Non-Injured Hemisphere and Lower Limb Motor Function and Gait Ability in Patients Following Severe Stroke by Sora Ohnishi, Naomichi Mizuta, Naruhito Hasui, Yuki Sato, Junji Taguchi, Tomoki Nakatani and Shu Morioka in Restorative Neurology and Neuroscience
Footnotes
Abbreviations
Acknowledgements
We thank the staff at the Department of Therapy, Takarazuka Rehabilitation Hospital of Medical Corporation SHOWAKAI and the Neurorehabilitation Research Center, Kio University, for their advice and help. This study was funded by the Hyogo Physical Therapists Association (2022).

Informed Consent
All patients provided verbal and written informed consent to participate in the study.
Author Contributions
All authors contributed to the study conception and design. Material preparation and data collection were performed by Sora Ohnishi, Naomichi Mizuta, Naruhito Hasui, and Yuki Sato. Data analysis was performed by Sora Ohnishi. The first draft of the manuscript was written by Sora Ohnishi and all authors commented on previous versions of the manuscript. All authors read and approved the final manuscript.
Funding
The authors disclosed receipt of the following financial support for the research, authorship, and/or publication of this article: This study was funded by the Hyogo Physical Therapists Association (2022).
Declaration of Conflicting Interests
The authors declared no potential conflicts of interest with respect to the research, authorship, and/or publication of this article.
Data Availability Statement
The datasets used and/or analyzed in this study are available from the corresponding author upon reasonable request.
Supplemental Material
Supplemental material for this article is available online.
References
Supplementary Material
Please find the following supplemental material available below.
For Open Access articles published under a Creative Commons License, all supplemental material carries the same license as the article it is associated with.
For non-Open Access articles published, all supplemental material carries a non-exclusive license, and permission requests for re-use of supplemental material or any part of supplemental material shall be sent directly to the copyright owner as specified in the copyright notice associated with the article.
