



Abstract
Background
Primary open-angle glaucoma (POAG) is a chronic, progressive and irreversible eye disease. Currently, there is no effective way to prevent optic nerve damage.
Objective
This study explored POAG gene markers to identify high-risk groups at an early stage and to find new effective therapeutic targets.
Methods
The mRNA and clinical information of POAG patients and normal samples were downloaded from the Gene Expression Omnibus (GEO) database. Through Weighted correlation network analysis (WGCNA) and generalized linear models (GLM), random forests (RF), support vector machines (SVM), and extreme gradient boosting (xGB) models, key risk genes were identified and an early diagnosis model was established. Functional enrichment analysis and CIBERSORT algorithm were used to further reveal the changes in the POAG immune environment and find emerging therapeutic targets.
Results
HERPUD1, IQCK, MRPL40, SRSF7 and TMEM243 were identified as risk genes, and the prediction model and nomogram constructed based on them had good early prediction efficiency. At the mechanistic level, the heterogeneity of T cell subsets seems to be a key factor affecting the progression of POAG and has potential therapeutic value.
Introduction
Primary open-angle glaucoma (POAG) is a chronic, progressive optic neuropathy characterized by the gradual loss of retinal ganglion cells and their axons, leading to irreversible vision loss and, eventually, blindness if left untreated.1,2 As the most common form of glaucoma, POAG accounts for a significant proportion of the 76 million cases of glaucoma globally, a number projected to rise to 111.8 million by 2020.3,4 Traditionally, elevated intraocular pressure (IOP) has been considered the primary risk factor for POAG. 5 However, it is now well-established that POAG can also occur in individuals with normal IOP, known as normal-tension glaucoma, 6 suggesting that factors beyond IOP contribute to the disease pathogenesis.
Recent advancements in glaucoma research have expanded our understanding of POAG, revealing the involvement of genetic 7 and vascular factors. 8 Genetic predispositions have been identified, with several genes linked to increased susceptibility to POAG, such as myocilin (MYOC), 9 Optineurin (OPTN), 10 and cytochrome P450 family 1 subfamily B member 1 (CYP1B1). 11 Additionally, vascular dysregulation, leading to compromised blood flow and ischemia of the optic nerve head, has been implicated in the disease process. 12 However, it is worth noting that the impact of more abnormal gene expression and regulatory patterns on POAG has not been fully revealed, and people's understanding of the molecular pathology of POAG is still lacking.
An emerging area of interest in POAG research is the role of immune dysregulation. 13 Immune mechanisms have been recognized as critical contributors to various chronic diseases, and their relevance to POAG is gaining increasing attention. Immune dysregulation in POAG encompasses a complex interplay of immune cells and inflammatory mediators, contributing to the progressive damage of the optic nerve. 14 This shift in understanding highlights the need for comprehensive research into immune mechanisms driving POAG. Otherwise, Immune biomarkers offer potential for early detection, diagnosis, and personalized treatment of POAG, 15 aiding in identifying at-risk individuals and monitoring disease progression and treatment response.
Bioinformatics approaches are increasingly used to uncover the molecular mechanisms of immune dysregulation in POAG.16,17 By integrating genomics, transcriptomics, and proteomics data, bioinformatics identifies key immune-related genes, pathways, and networks involved in the disease. These analyses have shown upregulation of pro-inflammatory cytokines and immune-related genes in the optic nerve head of POAG patients. Integrating bioinformatics with clinical research promises novel immunomodulatory treatments and personalized medicine approaches to restore immune homeostasis and improve treatment outcomes.
In this article, we will use a combination of bioinformatics analysis methods including Weighted gene co-expression network analysis (WGCNA), multiple machine learning, and CIBERSORT to reveal the gene change patterns at the core of POAG and the disease-related immune cell dysregulation landscape, aiming to provide new ideas and directions for the clinical diagnosis and treatment of POAG.
Methods
Data acquisition and processing
The datasets used in this study were downloaded from the Gene Expression Omnibus (GEO) database. Through careful retrieval, a total of 4 POAG datasets (GSE2378, GSE9944-GPL8300, GSE9944-GPL571, GSE27276) were included in the study. The 4 datasets contained mRNA expression levels and related clinical information of 43 POAG patients and 67 normal individuals. The “limma” R package was used to remove batch effects between different datasets and identify differentially expressed genes (DEGs) between POAG vs normal samples. Among them, genes with P < 0.05 and |logFC|>0.1were identified as DEGs for the next step of analysis.
Functional enrichment analyses
The “ClusterProfiler” R package (v4.8.2) was used to conduct Gene Ontology (GO) and Kyoto Encyclopedia of Genes and Genomes (KEGG) functional/pathway enrichment analysis, where relevant biological processes or signaling pathways with P < 0.05 were considered significant. The results of functional enrichment analysis were visualized using the “ggplot2” R package.
WGCNA
The WGCNA R package was employed to build a weighted coexpression network focusing on gene clusters relevant to POAG. To enhance the network's reliability, the samples underwent normalization, and outliers were excluded. The optimal soft threshold value was identified by determining the best weighting parameter for the neighbor function using the pick soft threshold method. Subsequently, the adjacency matrix was converted into a topological overlap matrix (TOM), and the corresponding phase dissimilarity measure (1 − TOM) was computed. Gene modules related to the onset of POAG were then constructed through hierarchical clustering with a dynamic tree cutting approach.
Multiple machine learning methods to screen key genes
In order to screen out the altered genes closely related to POAG; we used the genes overlapping with the WGCNA core modules of differentially expressed genes (DEGs) for various machine learning. These identified genes were considered to be closely related to the onset of POAG and have diagnostic and predictive value for POAG. Specifically, the “caret” R package was used to integrate the analysis and comparison of multiple machine learning diagnostic models, including generalized linear models (GLM), random forests (RF), support vector machines (SVM), and extreme gradient boosting (xGB) models. In addition, we also evaluated the predictive performance of the single core genes screened out and verified the actual expression of each core gene in the dataset.
Prognostic model construction and evaluation
To better address the needs of clinical diagnosis and treatment, core genes related to POAG were utilized to construct a nomogram. The nomogram was created using the “rms” R package. Additionally, we generated the Hosmer-Lemeshow calibration curve and the Decision Curve Analysis (DCA) curve to assess the accuracy and practicality of the nomogram model.
Immune infiltration analysis
CIBERSORT is a widely used tool for evaluating immune cell types within the microenvironment. It operates on the principle of a linear support vector to deconvolute the expression matrix of immune cell subtypes. The tool encompasses 547 biomarkers and 22 human immune cell phenotypes, including plasma cells, B cells, T cells, and myeloid cell subsets. In this study, the CIBERSORT algorithm was applied to data from POAG patients to quantify the relative proportions of 22 infiltrating immune cells. Additionally, Pearson correlation analysis was conducted to examine the relationships between immune cells and gene expression.
Results
Identification and functional analysis of differentially expressed genes
The results before and after removing the batch effect are illustrated in (Figure 1A and 1B). After batch effect removal, the heterogeneity among samples from the four datasets was significantly reduced, making the data suitable for further analysis. Figure 1C shows the differentially expressed genes (DEGs), with 401 up-regulated genes and 225 down-regulated genes identified based on the criteria of P < 0.05 and |logFC|>0.5.

Identification and functional analysis of differentially expressed genes. (A) PCA plot before batch effect removal. (B) PCA plot after batch effect removal, showing reduced heterogeneity among samples. (C) Volcano plot of differentially expressed genes (DEGs) with 401 up-regulated (red) and 225 down-regulated (blue) genes (P < 0.05, |logFC|>0.1). (D) GO enrichment analysis of DEGs indicating significant biological processes, cellular components, and molecular functions. (E) KEGG pathway enrichment analysis highlighting pathways such as oxidative phosphorylation and lipid metabolism.
Functional enrichment analysis revealed that the DEGs are predominantly involved in energy metabolism processes, including oxidative phosphorylation, oxidative stress, and lipid metabolism, as shown in (Figures 1D and 1E).
In the WGCNA analysis, we fit and constructed a total of 10 feature modules (Figure 2A). Among them, magenta, red, blue, brown, yellow and pink modules showed significant correlation with POAG (Figure 2B, P < 0.05). In order to further pinpoint the close relationship between the genes of the characteristic modules and POAG, we selected the strongly correlated modules for further analysis, namely the brown (Figure 2C), magenta (Figure 2D) and pink (Figure 2E) modules.
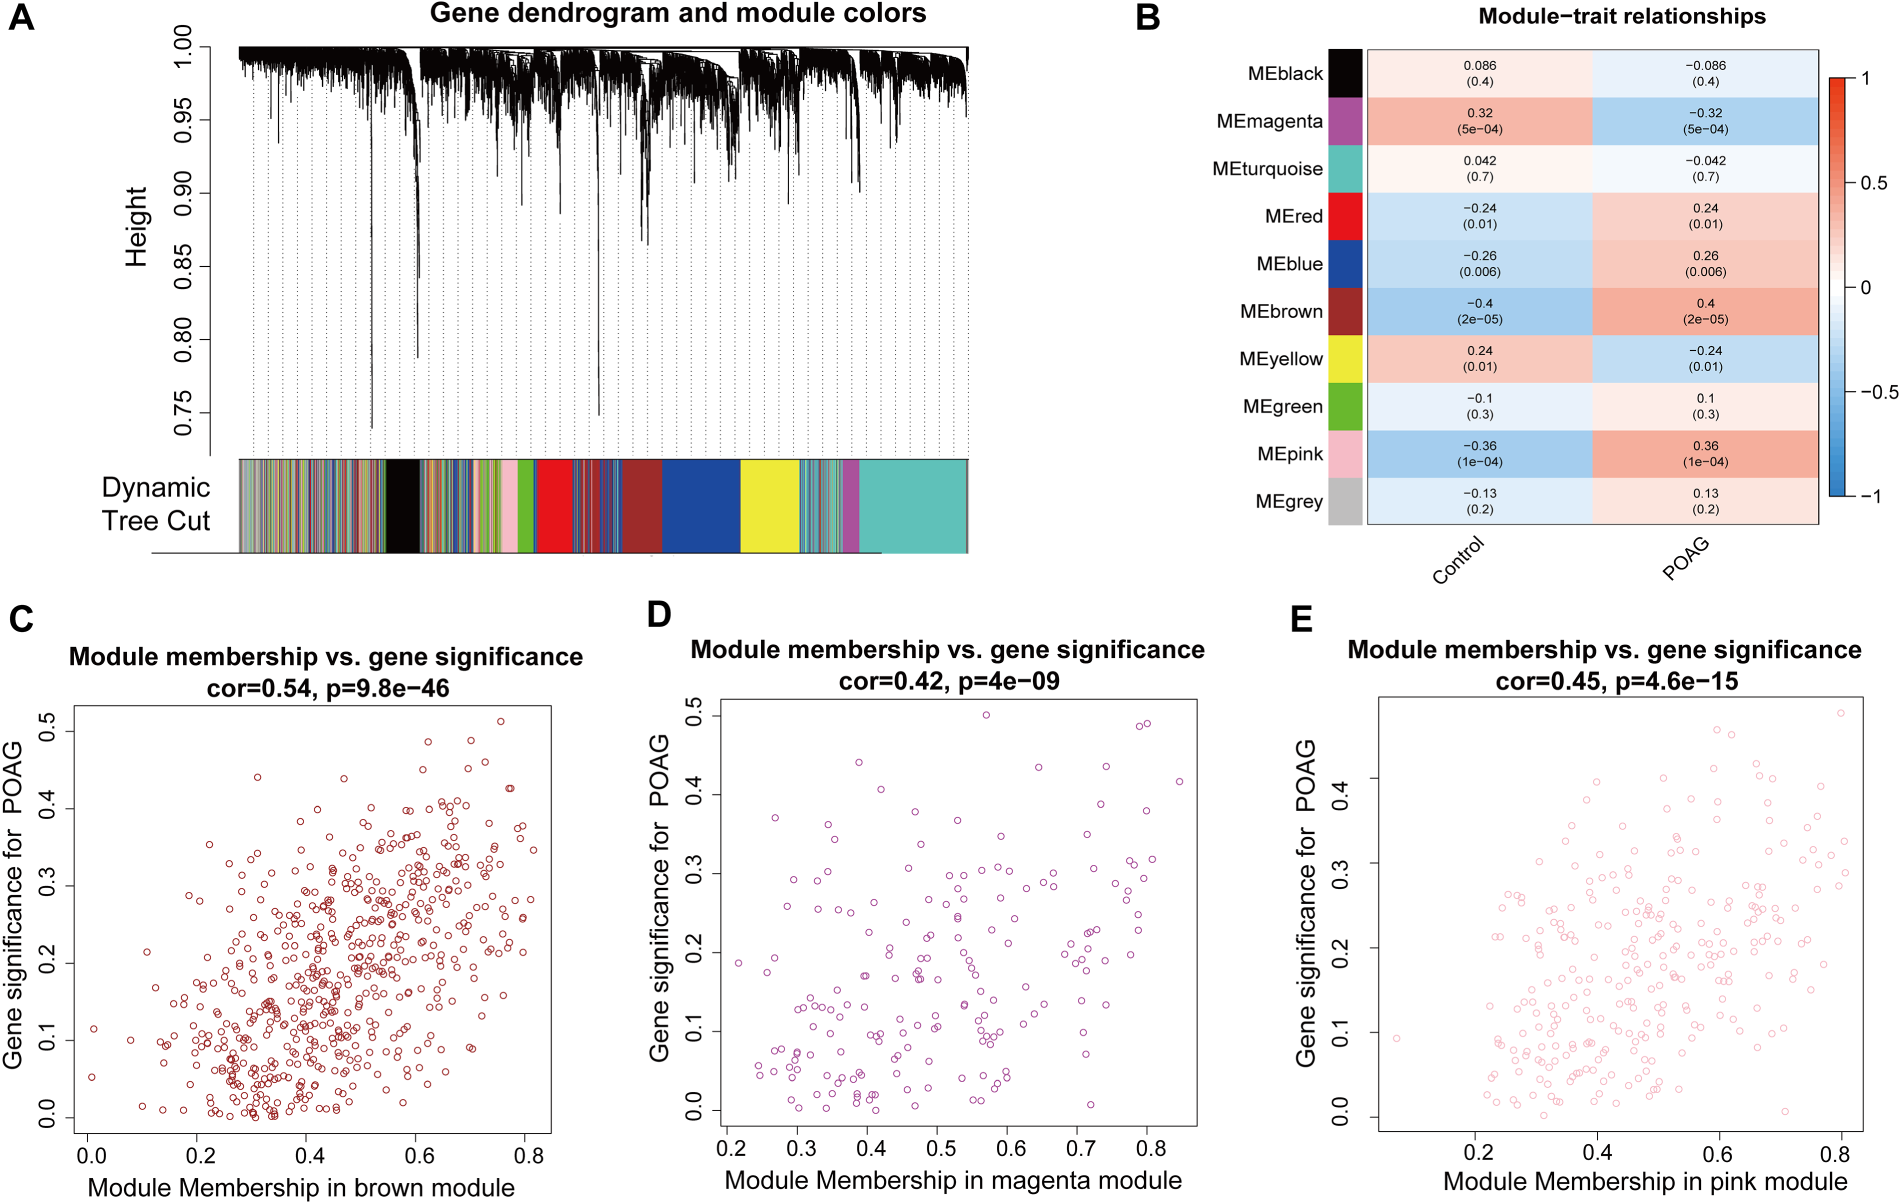
WGCNA result. (A) Gene dendrogram and modules before merging. (B) Pearson correlation analysis of merged modules. (C-E) Scatterplot of MM and GS from the brown, magenta and pink module.
To further investigate the functions of the module genes highly correlated with POAG in WGCNA, we identified the intersection of these module genes and DEGs, resulting in 177 overlapping genes (Figure 3A). Functional enrichment analysis of these genes revealed the following: Gene Ontology-Biological Process (GO-BP) Analysis: The genes were significantly associated with oxidative phosphorylation, viral processes, symbiont interactions, and mRNA metabolic processes (Figure 3B). Gene Ontology-Cellular Component (GO-CC) Analysis: These genes played crucial roles in specific cellular components such as the nucleus, cytoplasm, and mitochondria. They were involved in protein complex formation, gene expression regulation, metabolism, signal transduction, and energy production (Figure 3C). Gene Ontology- Molecular Function (GO-MF) Analysis: The genes were important for catalytic activity, nucleic acid and RNA binding, enzyme binding, redox reactions, electron transfer, and energy metabolism (Figure 3D). Further KEGG enrichment analysis indicated that these genes were involved in oxidative phosphorylation and lipid metabolism. Additionally, they were closely related to T cell activation and differentiation (Figure 3E).
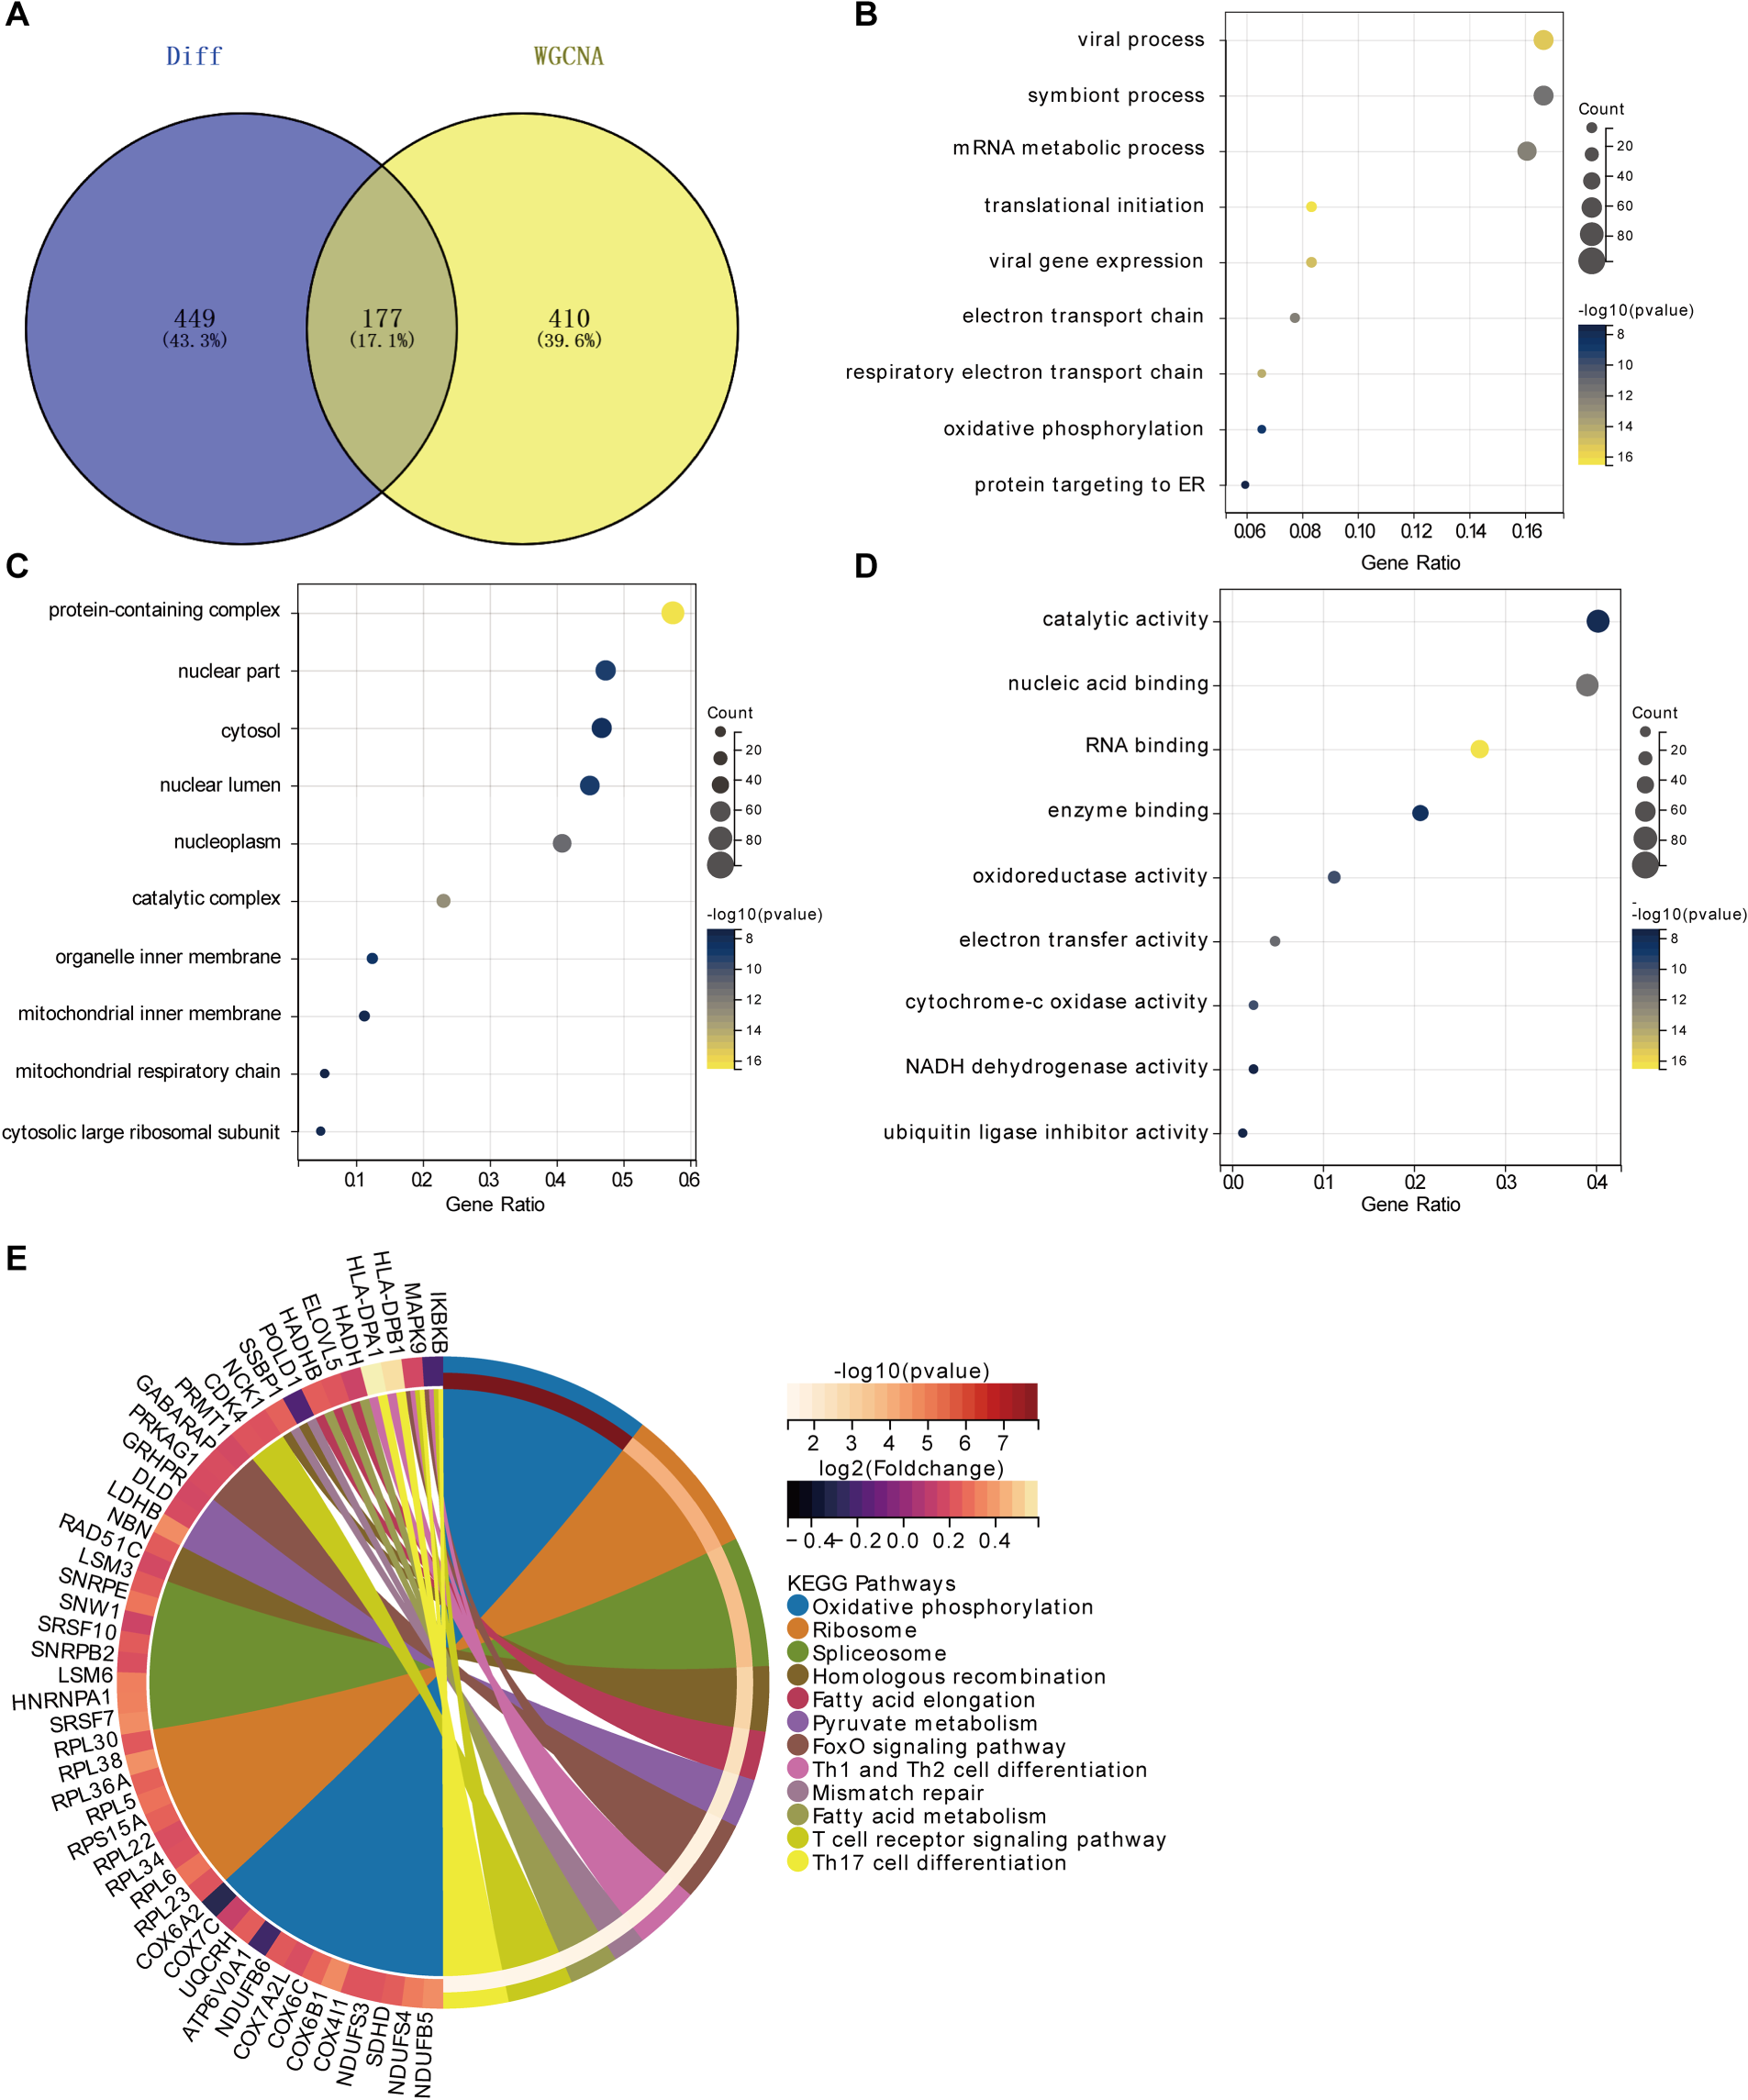
Overlapping gene and functional analysis. (A) Venn diagram showing 177 overlapping genes. (B) GO-BP analysis indicating associations with oxidative phosphorylation, viral processes, symbiont interactions, and mRNA metabolic processes. (C) GO-CC analysis highlighting roles in the nucleus, cytoplasm, and mitochondria, involving protein complex formation, gene expression regulation, metabolism, signal transduction, and energy production. (D) GO-MF analysis showing importance in catalytic activity, nucleic acid and RNA binding, enzyme binding, redox reactions, electron transfer, and energy metabolism. (E) KEGG enrichment analysis demonstrating involvement in oxidative phosphorylation, lipid metabolism, and T cell activation and differentiation.
We put 177 overlapping genes into four machine learning methods. The residuals produced by each machine learning model are shown in Figure 4A. Subsequently, the top 10 significant feature variables of each model were ranked according to the root mean square error (RMSE) (Figure 4B). In addition, the discriminative effect of the four machine learning algorithms on the test set was evaluated by using the five-fold cross-validation method to calculate the receiver operating characteristic (ROC) curve. Among them, Random Forest (RF) and Support Vector Machines (SVM) had the largest Area Under Curve(AUC) (0.789), proving that both have Highest stability (Figure 4C). After comprehensive consideration, we selected 5 genes with the best predictive performance, namely Homocysteine inducible ER protein with ubiquitin like domain 1 (HERPUD1), IQ motif containing K (IQCK), mitochondrial ribosomal protein L40 (MRPL40), serine and arginine rich splicing factor 7 (SRSF7) and transmembrane protein 243 (TMEM243). Plotting the ROC curves of the five genes respectively showed that they all had good predictive performance (Figure 4D-H). Expression verification in the data set found that all five genes were highly expressed in POAG patient samples (Figure 4I).
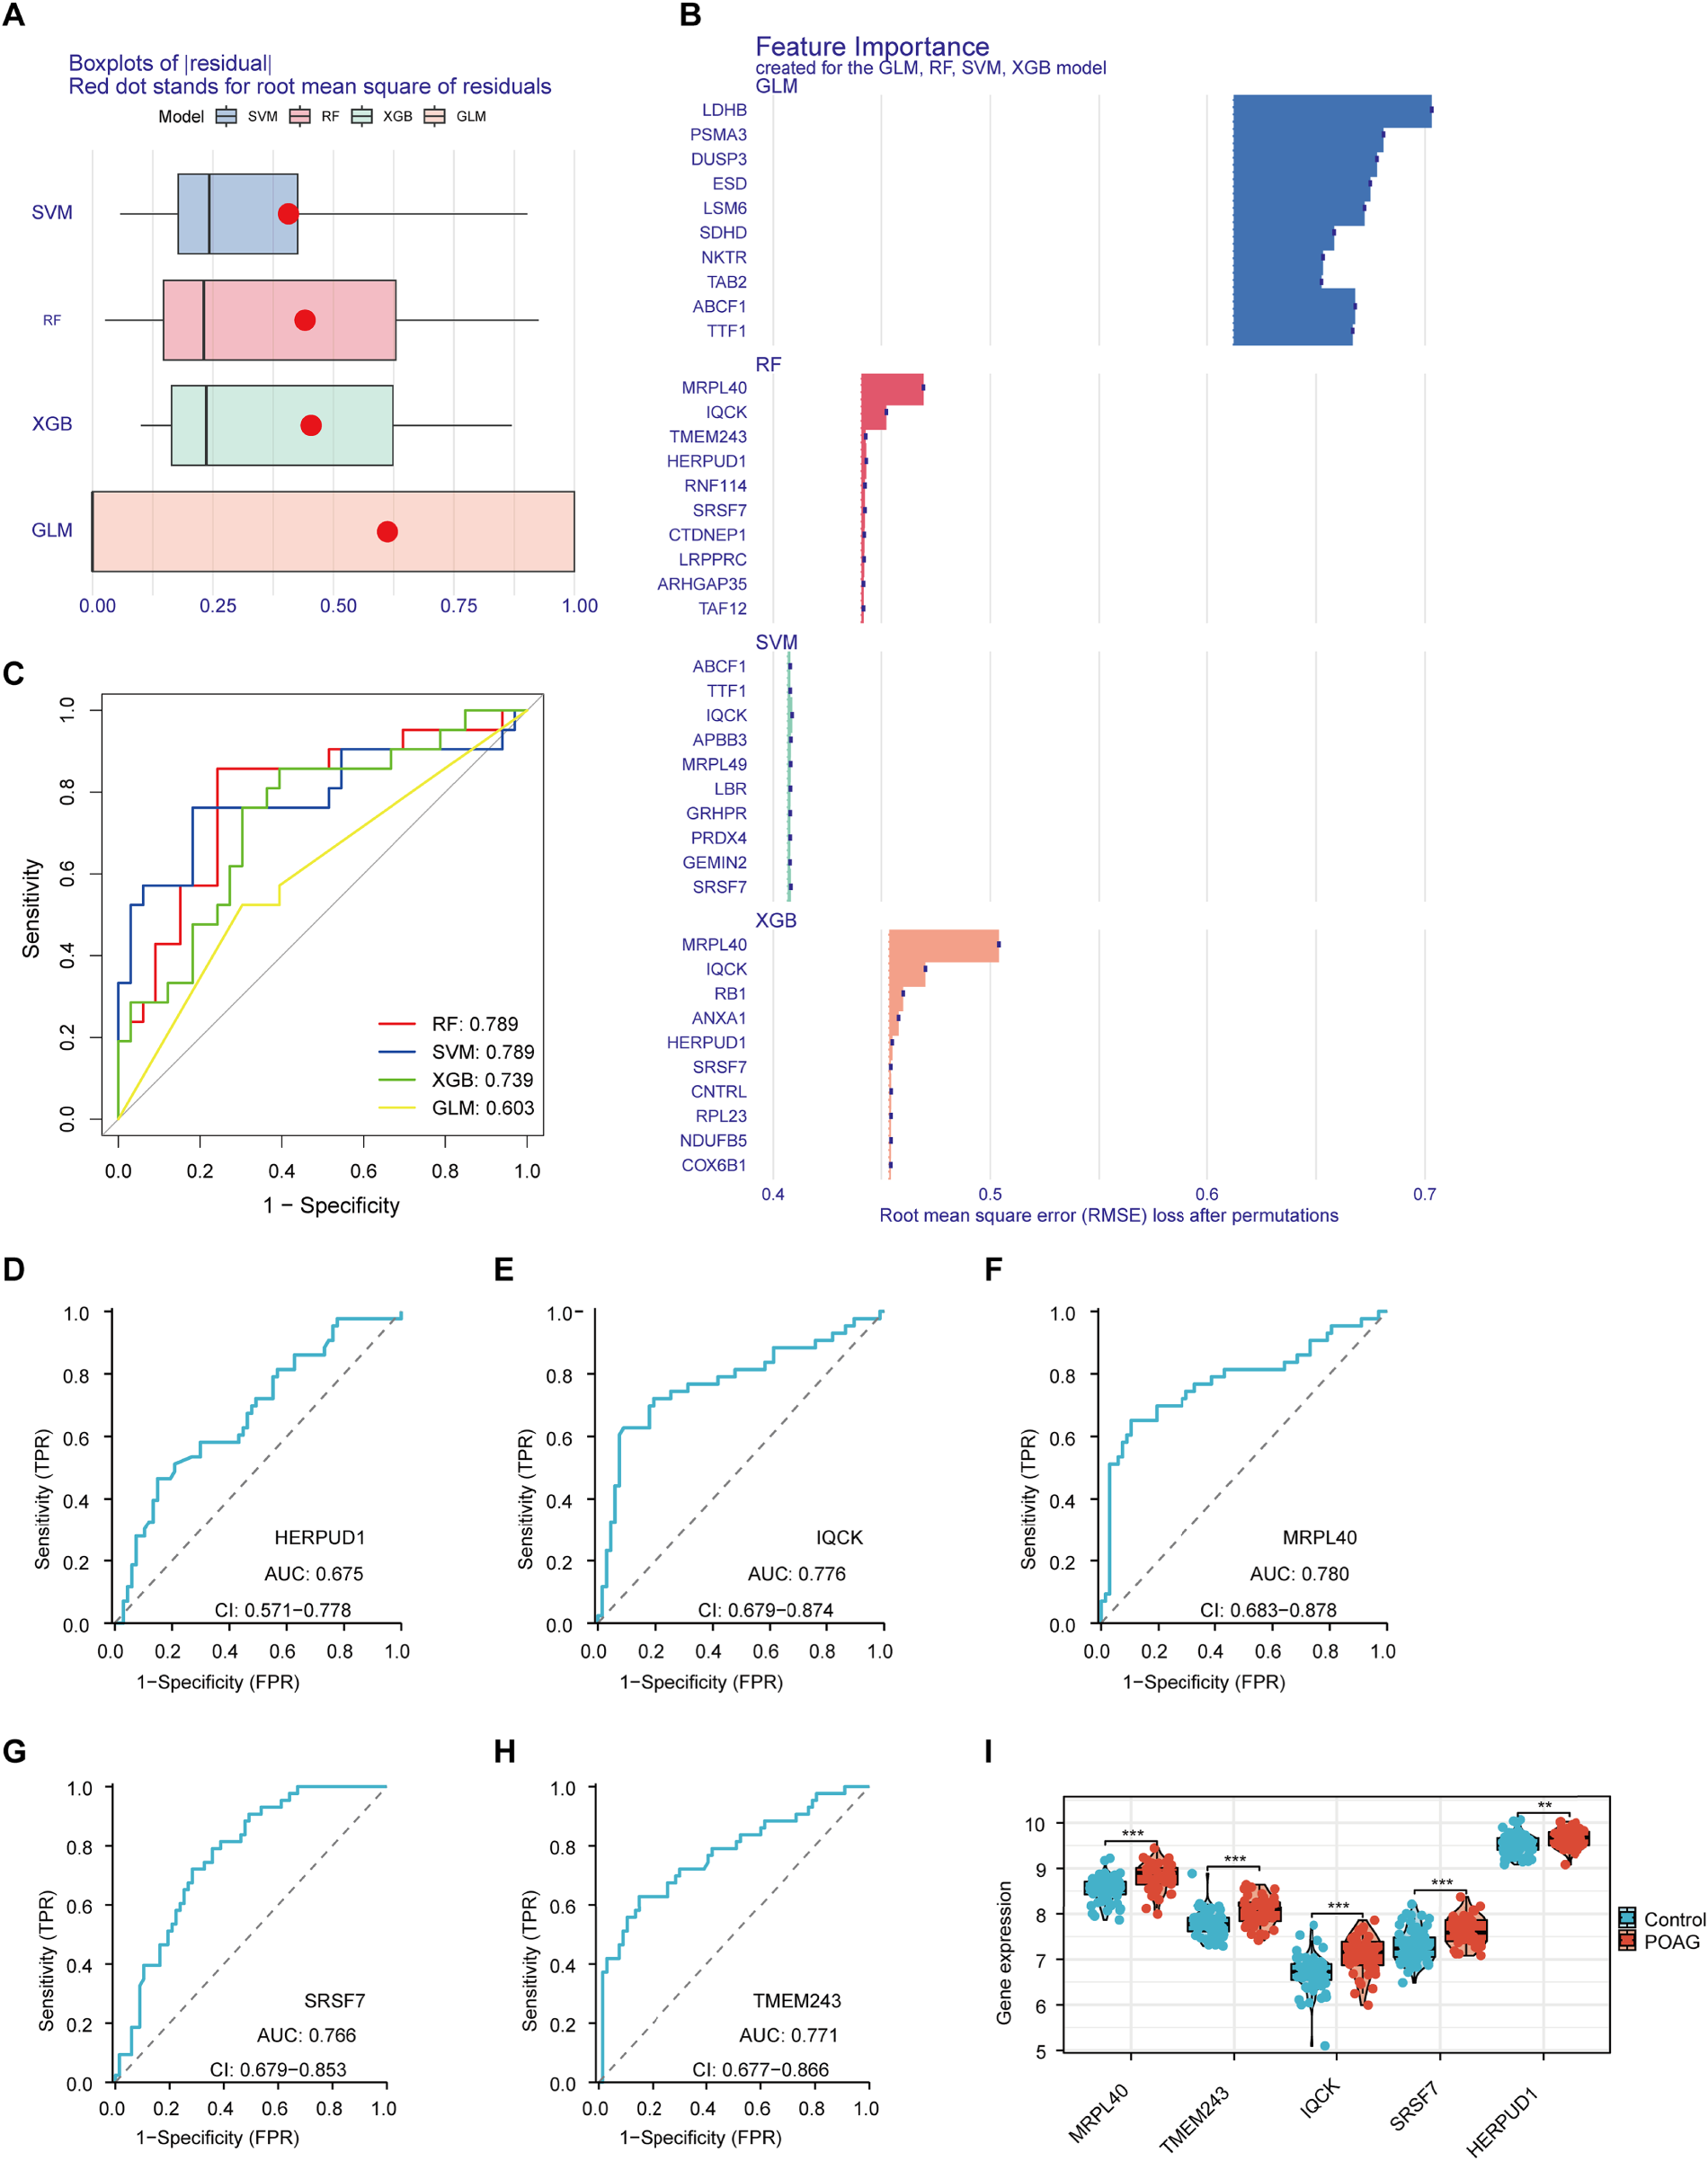
Machine learning analysis of 177 overlapping genes. (A) Residuals from four machine learning models. (B) Top 10 significant feature variables ranked by RMSE for each model. (C) ROC curves from five-fold cross-validation showing RF and SVM with the highest AUC (0.789). (D-H) ROC curves for the top 5 predictive genes: HERPUD1, IQCK, MRPL40, SRSF7, and TMEM243. (I) Expression levels of the five genes in POAG patient samples, indicating high expression.
In order to facilitate the actual clinical use, we used five genes with high predictive efficiency to construct the nomogram, and the results are shown in (Figure 5A). The calibration curve in(Figure 5B)is close to the ideal curve, indicating that the nomogram model has good calibration performance, that is, the predicted probability of the model is consistent with the actual probability of occurrence. The DCA curve is used to evaluate the clinical net benefit of the model at different decision thresholds. The red line in the figure represents the net benefit of the model, and the gray line and black line represent the net benefit of all people receiving treatment (All) and no one receiving treatment (None), respectively. The red curve is higher than the gray line and the black line in most threshold ranges, indicating that the nomogram model has a high clinical net benefit in a wide range of thresholds. In particular, in the lower and medium threshold ranges, the model showed a high net benefit, which proves the potential utility of the nomogram model in practical applications (Figure 5C). Overall, these evaluation results show that the nomogram model has good calibration performance and high clinical net benefit, indicating that the model has good application prospects in the prediction and diagnosis of POAG.

Evaluation of the nomogram model. (A) Nomogram constructed using five genes with high predictive efficiency. (B) Calibration curve indicating good agreement between predicted and actual probabilities. (C) Decision Curve Analysis (DCA) showing the nomogram model (red line) has a higher clinical net benefit compared to treating all (gray line) or none (black line) across a wide range of thresholds.
In previous KEGG analysis of overlapping genes, we found that these genes were closely related to T cell activation and differentiation. Therefore, we used the CIBERSORT algorithm to evaluate the immune cell infiltration landscape of POAG patients. Figure 6A illustrates the correlation landscape of immune cell infiltration in POAG patients, assessed using the CIBERSORT algorithm. Significant positive correlations were observed between various T cell subtypes, such as activated CD4T cells and type 1T helper cells, suggesting a coordinated activation and interaction among these cells in the POAG microenvironment. Negative correlations were noted between certain immune cells, such as neutrophils and regulatory T cells, indicating potential inhibitory interactions. The analysis highlights the prominent role of T cells in the immune landscape of POAG, consistent with previous findings from KEGG analysis showing their involvement in T cell activation and differentiation. Specifically comparing POAG patient samples with normal control samples, we found that POAG patients had higher levels of activated CD8 and CD4T cells and decreased levels of regulatory T cells. In addition, we also found that POAG patients had increased levels of infiltration of the mononuclear macrophage system (Figure 6B).

Immune cell infiltration analysis in POAG patients. (A) Correlation landscape of immune cell infiltration in POAG patients using the CIBERSORT algorithm, showing significant positive correlations between various T cell subtypes and negative correlations between neutrophils and regulatory T cells. (B) Comparison of immune cell infiltration levels between POAG patients and controls, indicating higher levels of activated CD8 and CD4T cells, decreased levels of regulatory T cells, and increased infiltration of the mononuclear macrophage system in POAG patients.
POAG is a complex chronic retinal neurodegenerative disease characterized by alterations in both the anterior and posterior segments of the eye.18,19 Despite current interventions mainly focusing on reducing IOP through pharmacological or surgical means,1,20 these treatments do not completely halt disease progression in all patients, indicating the involvement of non-IOP related factors. The rapid development of bioinformatics provides a powerful strategy for identifying molecular markers that reflect changes at the molecular level, accurately monitor pathological changes in the trabecular meshwork (TM) 21 and optic nerve head (ONH) 22 and offer important insights for diagnosing POAG.
In this study, we analysed bulk RNA-seq datasets from the GEO database to identify pathogenic genes associated with POAG. We performed differential expression analysis, followed by WGCNA, GO and KEGG pathway enrichment analyses, and constructed a POAG-specific transcriptional regulatory network to identify crucial transcription factors. Using machine learning methods, we identified five potential key genes (HERPUD1, IQCK, MRPL40, SRSF7, and TMEM243) in both TM and ONH tissues.
HERPUD1 (homocysteine-inducible, endoplasmic reticulum stress-inducible, ubiquitin-like domain member 1) primarily participates in the endoplasmic reticulum (ER) stress response.23,24 During cellular stress conditions, HERPUD1 activates the unfolded protein response (UPR) to help restore cellular homeostasis. 25 In POAG, the upregulation of HERPUD1 may be linked to chronic stress in ocular tissues. IQCK (IQ motif containing K) is a protein that contains an IQ domain, typically involved in binding calmodulin and participating in intracellular signal transduction.26,27 The upregulation of IQCK may influence calcium ion signalling pathways within cells, affecting cellular function. MRPL40 (mitochondrial ribosomal protein L40) is a component of the mitochondrial ribosome large subunit, essential for mitochondrial protein synthesis.28,29 The upregulation of MRPL40 in POAG may reflect alterations in cellular energy metabolism. Notably, in the functional enrichment analysis, we found that the overlapping genes were closely associated with multiple pathways related to oxidative phosphorylation and lipid metabolism, which may be importantly linked to the upregulation of this gene. SRSF7 (serine/arginine-rich splicing factor 7) plays a critical role in RNA splicing, influencing the maturation and regulation of mRNA precursors.30–32 The upregulation of SRSF7 can lead to widespread changes in gene expression, impacting cellular function. TMEM243 (transmembrane protein 243) is involved in intracellular and intercellular transport processes.33,34
In addition, we discovered that the identified key genes are intricately linked with various immune cells, highlighting their potential roles in the immune response mechanisms of POAG. Both KEGG enrichment analysis and immune infiltration analysis pointed out the important role of T cell populations in the pathogenesis of POAG. Current studies indicate that activation levels of CD4 and CD8T cells are increased in patients with POAG. 35 Activated T cells trigger an inflammatory response in the eye, which may lead to damage to the optic nerve. 36 In addition, Tregs levels are reduced in POAG patients. 37 Tregs play an important role in maintaining immune tolerance and preventing excessive immune responses. 38 Their reduction may lead to uncontrolled inflammation and autoimmune responses, further exacerbating the disease process. Activated T cells and reduced Tregs together contribute to an inflammatory environment within the eye that is harmful to the optic nerve. 39 Chronic inflammation driven by these immune cells can lead to the progressive damage to the optic nerve that is characteristic of POAG. 40 Interestingly, in POAG, T cells differentiate significantly into multiple subtypes such as Th1 cells and other effector T cells. 41 These differentiated T cells can produce pro-inflammatory cytokines, exacerbating ocular tissue damage and promoting disease progression. Based on this, the regulation of T cell populations is expected to become an effective target for POAG treatment.
We identified five key genes (HERPUD1, IQCK, MRPL40, SRSF7, and TMEM243) by bioinformatics, which could serve as diagnostic markers for POAG. And we found that these genes were closely associated with immune infiltration. This provides a new direction for our subsequent in-depth study of the pathogenesis and treatment options of POAG, and subsequent validation of the importance of these genes will help optimize clinical treatment options, improve the success rate of treatment and alleviate the pain of patients during the treatment process.
Of course, there are some limitations in our study, we analyzed it by bioinformatics and did not verify it experimentally, and further in-depth research is needed subsequently. Meanwhile, our data are all from the database, and we need to collect more clinical samples for further verification.
Conclusion
In conclusion, through the application of random forest and SVM algorithms, we identified five key genes (HERPUD1, IQCK, MRPL40, SRSF7, and TMEM243) in TM and ONH tissues that may serve as diagnostic markers for POAG. GO and GSEA analyses provided deeper insights into the specific molecular mechanisms of these genes. The relationship between key genes and immune infiltration in both TM and ONH tissues has been rarely reported, highlighting the need for further exploration. Understanding the roles of these immune cells may identify targets for immunotherapy in POAG, offering potential benefits from immunomodulatory treatments for patients.
Footnotes
Acknowledgments
The authors have no acknowledgments.
Declaration of conflicting interests
The authors declared no potential conflicts of interest with respect to the research, authorship, and/or publication of this article.
Funding
The authors disclosed receipt of the following financial support for the research, authorship, and/or publication of this article: The work was supported by Anhui Provincial Health Commission Subject (AHWJ2023A30243) and Fuyang Municipal Health Commission Subjects(FY2021-076).