
Abstract
Background
Deficits in concentration with social stimuli are more common in children affected by autism spectrum disorder (ASD). Developing visual attention is one of the most vital elements for detecting autism. Eye tracking technology is a potential method to identify an early autism biomarker based on children's abnormal visual patterns.
Objective
Eye tracking retinal scan path images can be generated by eyeball movement during the time of watching the screen and capture the eye projection sequences, which helps to analyze the behavior of the children. The Shi-Tomasi corner detection methodology uses open CV to identify the corners of the eye gaze movement in the images.
Methods
In the proposed ADET model, the corner detection-based vision transformer (CD-ViT) technique is utilized to diagnose autism at an early stage. Generally, the transformer model divides the input images into patches, which can be fed into the transformer encoder process. The vision transformer is fine-tuned to resolve binary classification issues once the features are extracted via remora optimization. Specifically, the vision transformer model acts as the cornerstone of the proposed work with the help of the corner detection technique. This study uses a dataset with 547 eye-tracking retinal scan path images for both autism and non-autistic children.
Results
Experimental results show that the suggested ADET frameworkachieves a better classification accuracy of 38.31%, 23.71%, 13.01%, 1.56%, 18.26%, and 44.56% than RM3ASD, MLP, SVM, CNN, SVM, and our proposed ADET methods.
Conclusions
This screening method strongly suggests that it be used to assist medical professionals in providing efficient and accurate autism detection.
Introduction
Autism is the most prevalent kind of Pervasive Developmental Disorder (PDD). Communication and social issues, as well as the emergence of limited and recurring behavioral patterns, can be characterized by ASD. 1 It is projected that 10 million individuals in India are believed to have ASD. The WHO study on 2022 figures states that one in every 100 youngsters globally has ASD. 2 The greater likelihood of developing autism has been scientifically associated with a variety of factors, including preterm delivery, environmental factors, genetics, maternal health concerns, and advanced parental age. 3 Autism may start to show symptoms in some children as early as twelve months of age, while it may take up to 24 months or more for other children. 4 Generally, the early symptoms of autism arise between the ages of 1 and 2. Lack of eye contact, refusal to become more responsive to noise, and inability to make eye contact are some early indicators of autism in children younger than one year of age. 5
Some two and three-year-old children with ASD show the following symptoms: limited communication, hypersensitivity or decreased sensory stimuli, difficulty following simple instructions such as rejection of affection, overactive or distractive behavior, and recurrent actions like flapping hands, spinning the rotation movement, and creating unusual noises. The typical co-occurrence of ASD with other neurodevelopmental problems and medical comorbidities makes it difficult to detect and diagnose with accuracy.6,7 There are several research investigations that have demonstrated the positive and negative consequences of conducting evaluations without objective diagnostic testing. 8 Missing out on opportunities for appropriate professional education and training, which has resulted in missed opportunities for detecting autism in its early stages. 6 Several research investigation techniques have used various input modes, such as brain signal analysis, brain image analysis, biometrics, sensory inputs, facial expression images, and eye tracking models. 9
Eye tracking studies are discussed by many researchers, and they make the identification of ASD promising. It collects eye movement and eye gaze data from toddlers and preschool children and serves to determine the direction of eye gaze and the latency of eye movements. 10 The person who is an ASD child has a different eye gaze and latency movement when collecting data from different devices. The tracker device's recorded eye movements are sent as diagnostic data.11–14 Eye movements can be categorized into four types: scan routes, fixation, blink rate, and saccades. Recently, eye-tracking technology has diagnosed ASD with new techniques. 15 Normally, eye contact is the most important part of the field of non-verbal and social communication. Children diagnosed with ASD typically exhibit abnormal movements of the eyes. 16
Eye movement-based ASD detection has been extensively studied, yet there are still certain issues. At first, existing technology majorly utilized statistically related analysis to carry out the eye gaze movements of autism and non-autistic children. 17 Even though the requirements of the analysis are too high, it gives a better classification result. Second, many of the algorithms use only the fixation values, which define how many times the eye movements are stationary. 18 But the actual movement of the eyes is a dynamic process, and the relationshipbetween the eyes’ fixations also provides crucial data. 19
Many authors have developed many models for detecting ASD among children. In 2019, Y. Tao and M.L. Shyu 20 determined the SP-ASDNet, which utilizes both the LSTM and CNN networks to detect ASD. It achieves 74.22% classification accuracy, and it takes more computational power. In 2019, M. Krol et al., 21 created a powerful algorithm by comparing the eye-movement sequence, statistically comparing the cross-validated accuracies, and finding the difference between temporal scan path features. By re-running an entire analysis, an explicit dimension reduction function cannot possibly add the new high-dimensional points.
In 2019, Eraslan et al., 22 designed Scan path Trend Analysis (STA), which combines a collection of eye-movement pathways into a single representative path and determines the trending path of a group of users on a webpage. The dataset in this case only includes six web pages, which is insufficient to fully explore the impact of characteristics. In 2020, S. Zhang et al., 23 established a strategy for the combined analysis of children's eye tracking and EEG. It analyzes the connection between eye-tracking and EEG records and emphasizes their functional relationship. The experimental result shows a classification accuracy of 95% for identifying the ASD children. Multi-model fusion analysis always chooses simple fusion strategies; thus, the categorization model's performance is very limited.
In 2020, Roth et al., 24 demonstrate the interactive dyadic system, which combines more communication channels for recording non-verbal behavior, and find the differences using computer aided diagnosis. Limited study samples and random samplings regarding the age factor as well as gender distribution do not provide sustainable results. In 2021, Akter et al., 25 created a k-means clustering algorithm by using an eye-tracking dataset and gave stable results and evaluation metrics that justified the performance of different classifiers. This will be helpful to diagnose the ASD for better treatment. But the age boundaries of the children will help to increase the investigation and detect autism more precisely.
In 2022, Ahmed et al., 19 used eye-tracking scan path images for diagnosing ASD by developing three artificial intelligence techniques such as hybrid models, deep learning and machine learning. Here, the dataset is balanced and the model was adjusted as well as modified to extract the deep features and solve the overfitting problem. Misclassification arises very rarely, and the computational cost of the hybrid model is too high. In 2022, Gaspar et al., 26 took the scan path pictures of 219 ASD and 328 normal children and in order to optimize the kernel extreme machine learning model, a metaheuristic approach was used. It also explains the construction of the Giza Pyramids for classification with an accuracy of 98.8%. More participants are included and eye-movements are recorded in future processes.
In 2022, G. Wan et al., 27 proposed the fixation duration of TD and ASD children using 10-s female speaking videos. This approach does not identify functional level indicators like adaptive and IQ behavior. Moreover, the sample size is very minimal and it cannot find any specific age group of people. According to the previous studies, most of the existing techniques used eye tracking to show that children with autism had distinct gaze patterns from typical kids. The approaches discussed above have certain shortcomings, including less classification accuracy, high computational cost, and less computational power in autism detection. Therefore, in this paper a novelADET model has been proposed to diagnose autism at an early stage using the corner detection-based vision transformer (CD-ViT) technique.
This study's primary contribution is:
Collecting the eye-movement scan path images from autism and non-autistic children. Pre-processing is the most important part, which balances the images present in the dataset and enhances the eye-movement images. Analyze the Shi-Tomasi corner detection method using open CV and identify the corners of the eye gaze movement in the images. Create the vision transformer model to train the data set and it shows a promising result, demonstrating better performance on eye-based image classification tasks. Finally, compare the model with different algorithms; they give better performance.
The following is the arrangement of the remaining portions of the paper: Section 2 presentsan overview of the pertinent research. Section 3 presents a description of the proposedtechnique. Section 4 conducted the experimental evaluation. Section 5 presents a discussion of this study.
Proposed methodology
The methodology explains a brief description of the autism eye retinal scan path image classification process. The input eye retinal scan path image is initially preprocessed by minimizing or maximizing the intensity level of the image, avoiding redundant images and removing the noise. The second stage is to identify the corners of the images that were marked separately which will be helpful to train the model easily and effectively.
The third stage is the feature extraction stage and the features are extracted using the vision transformer model, which usually splits the images into patches. Each patch separates the tokens and trains the image based on self-attention-based approaches. Moreover, the corner vision transformer model differentiates the eye retinal scan path features and classifies the model. The proposed ADET model corner detection image-based vision transformer (CD-ViT) technique is explained in Figure 1.
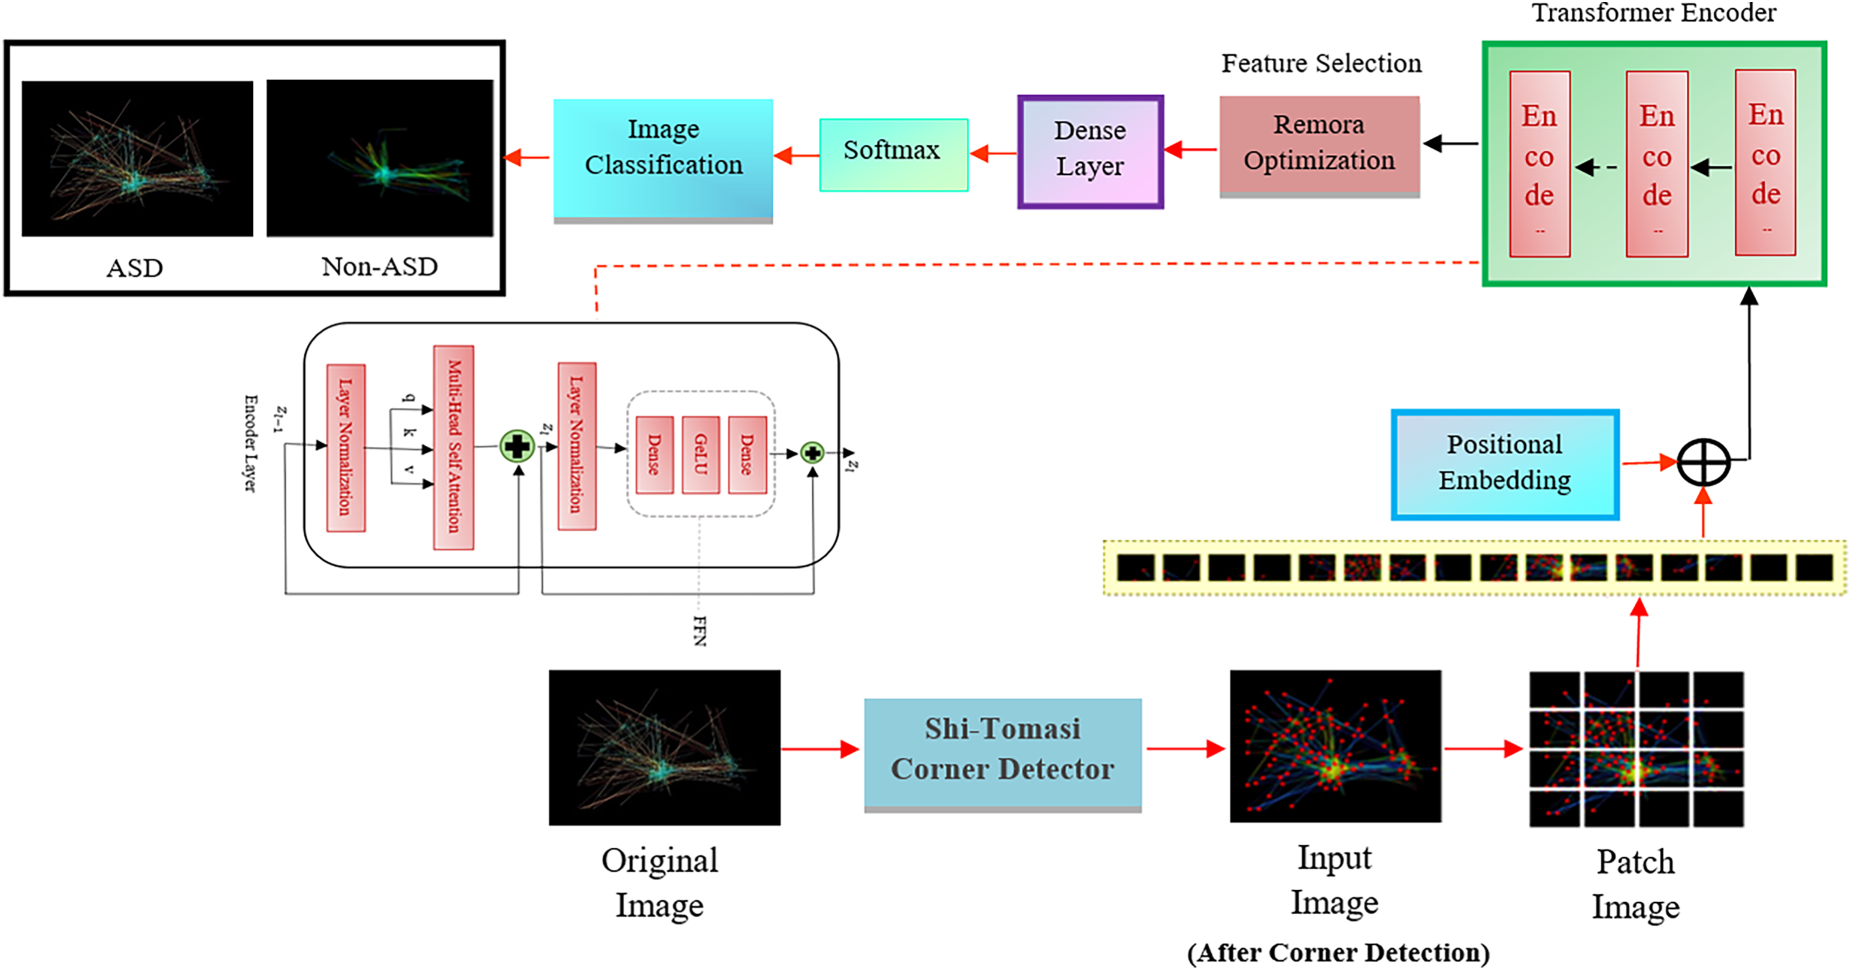
The proposed ADET model architecture.
The dataset contains eye tracking and retinal scan path images, and it is implemented for detecting autism in children. Generally, there are 547 images, which are divided into autism and non-autism images. The split image is described in the following Table 1.
Splitting the eye-tacking retinal scan path image dataset.
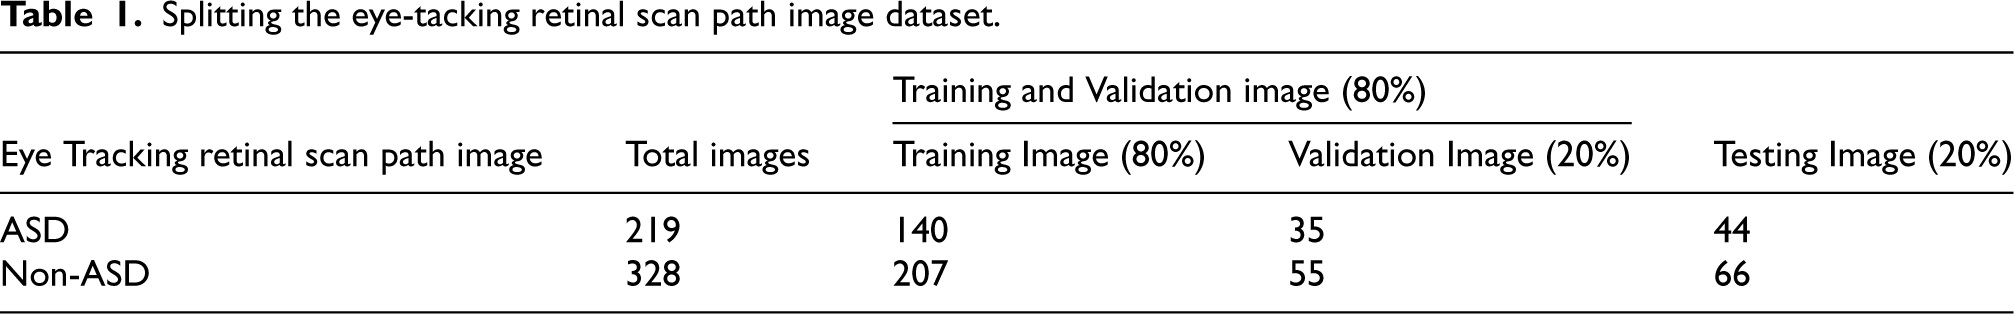
Splitting the eye-tacking retinal scan path image dataset.
Enhancement of the traditional corner identification algorithm, the Harris algorithm, is achieved via the Shi-Tomasi (ST) algorithm. In general, it produces better corners than the Harris algorithm. We will describe the conceptual foundations of the ST algorithm in this part. The Harris algorithm's primary method is to traverse around the image using a local window and determine whether the grayscale (gs) values have changed significantly. If the gs values inside the window (as shown on the gradient map) exhibit notable differences, there is a corner in the area where this window is situated.
At first, a mathematical model is established to identify the windows that will significantly alter the grayscale values. The values of the grayscale pixels at a given spot in the grayscale image are used as the starting value when the window's centre is positioned there. If the window is moved slightly in both the x and y axes, the pixel gs value at that place shows the change in gs values caused by the movement. In the simplest case, when every pixel in the window represents an average filtering kernel with a weight of 1, the formula for the variance in pixel gs values that arises from rotating the window in different directions is as follows:


The ST corner detection algorithm's corner response function is:
Initially, this method uses either Shi-Tomasi or Harris Corner to determine the corner quality score at each pixel. Subsequently, a non-maximum suppression is carried out using this function, keeping the local maximums in the 3 × 3 neighborhood. Subsequently, all corners with a quality score below At this point, the quality score is used to sort every remaining corner in descending order. When a stronger corner is present at a distance shorter than maxDistance, Function discards those corners.
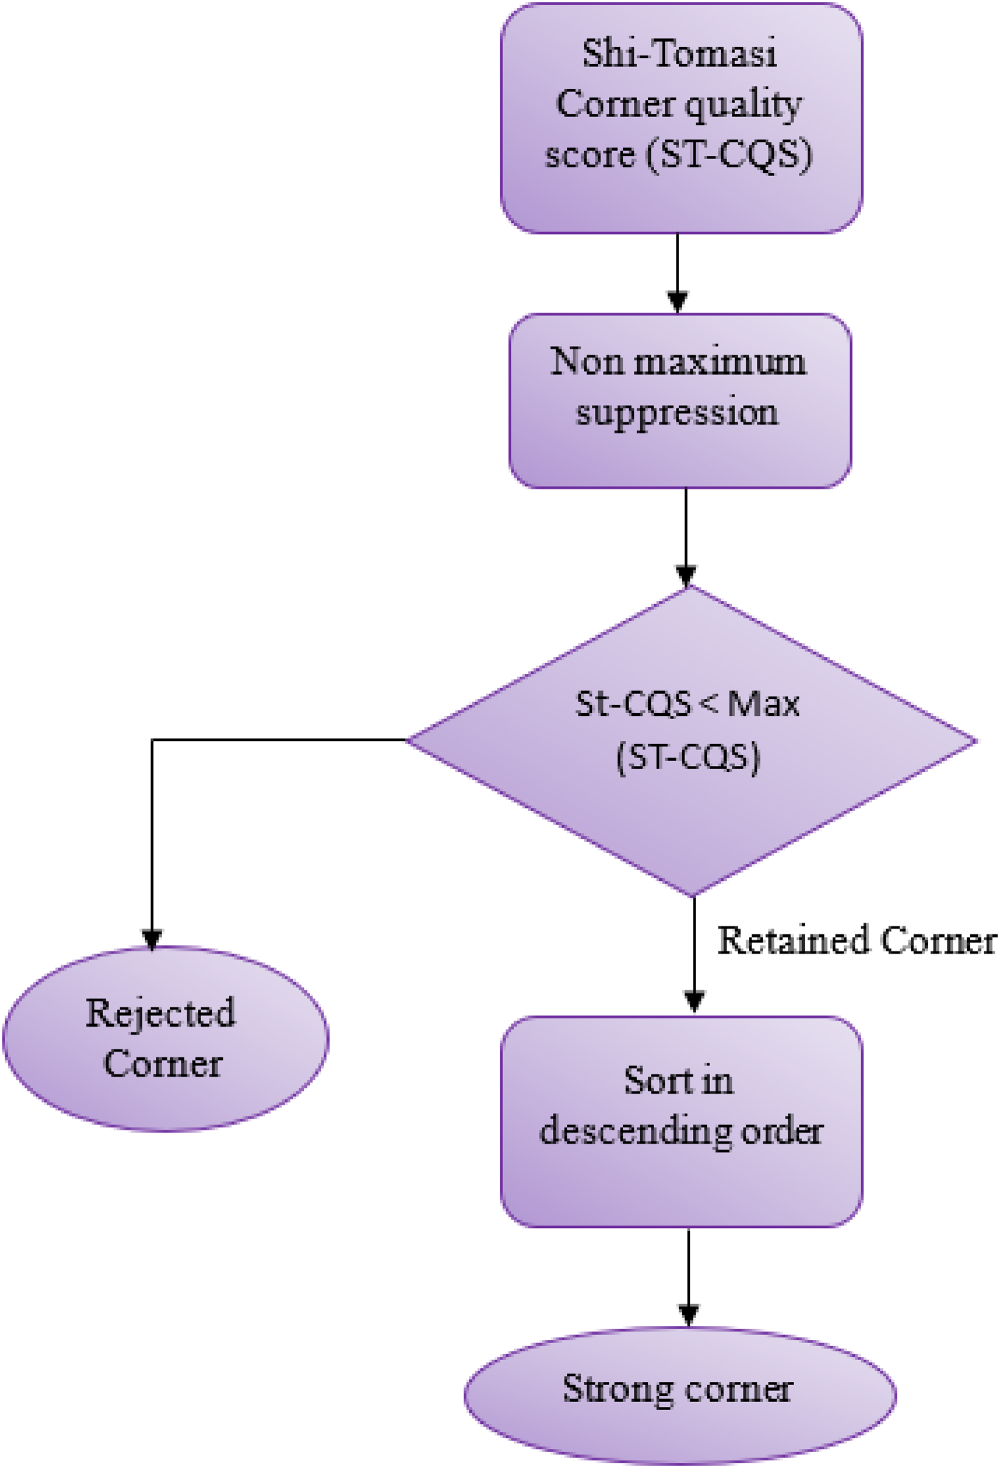
Function of Shi-Tomasi corner detection algorithm.
The corner detection can be identified by using a computer vision application, and it has a default function. To detect the corners using Shi-Tomasi by identifying the scoring function. To calculate the scoring function R is:

The eye image E (x) is converted after Shi-Tomasi corner detection is,

Eye tracking retinal scan path image after applying ADET model corner detection technique.
Positional embedding keeps the positional information of a collective embedded patch and also indicates the sequential position of all the patches. Finally, it can create a positional number before every patch in a one-dimensional order. The resultant sequence of positional embedding gives the input to the transformer encoder.
Transformer encoder
The positional embedding patches initially add the learnable class token Xc. The learning embedded is a sequence of embedded patches with class tokens. The starting encoder layer Z0 is described in the equation as follows:


Every transformer encoder always needs a class token at the 0th position while using a pre-trained model. When the patch image is sent as an input sequence to the encoder, one class token must be initiated as the first patch information. There are several identical layers in the encoder process. Each layer creates two primary blocks named theFFN block and Multi-head Self Attention block.
This is the transformer encoder's second block, made up of two fully connected layers that include GELU activation functionality. Every one of the two encoder layer blocks is preceded by the layer of normalization (LN). The output is calculated using the following formulas by applying residual connections:


The remora optimization algorithm (ROA) is primarily inspired by the remora whale, which is a clever marine navigator. The algorithm consists of two stages: exploitation and exploration. To construct the numerical expression, remora behaviors like mindful eating and free travel are utilized. Mode switching is accomplished with a single short step trial, and the remora factor, which produces convergence, can be employed to increase the optimization's precision. Decisions on mode switching must take into account phases like experience, thoughtful eating, and free travel. These tactics aid in the ROA algorithm's pursuit of ideal outcomes. The ROA algorithm's steps are listed below:
Initialization SFO Strategy Experience Attack Eat Thoughtfully (Exploitation)
WOA Strategy Host Feeding
Remora is the greatest option, and in its current standing, the variables in the search space are represented by the variable D. Remora moves in different positions according to the size of the pool. The formula for the present position is
When the remora is attached to the swordfish, its position can be updated and expressed as follows,

Remora's change of host can be estimated using this phase. It might be expressed as follows:


Remora's bond with the whale serves as the basis for this, and the location updates are stated as follows,


This subsection belongs to the stage of exploitation. The host's position space can be used to compress the solution space for this stage, which is expressed as follows:


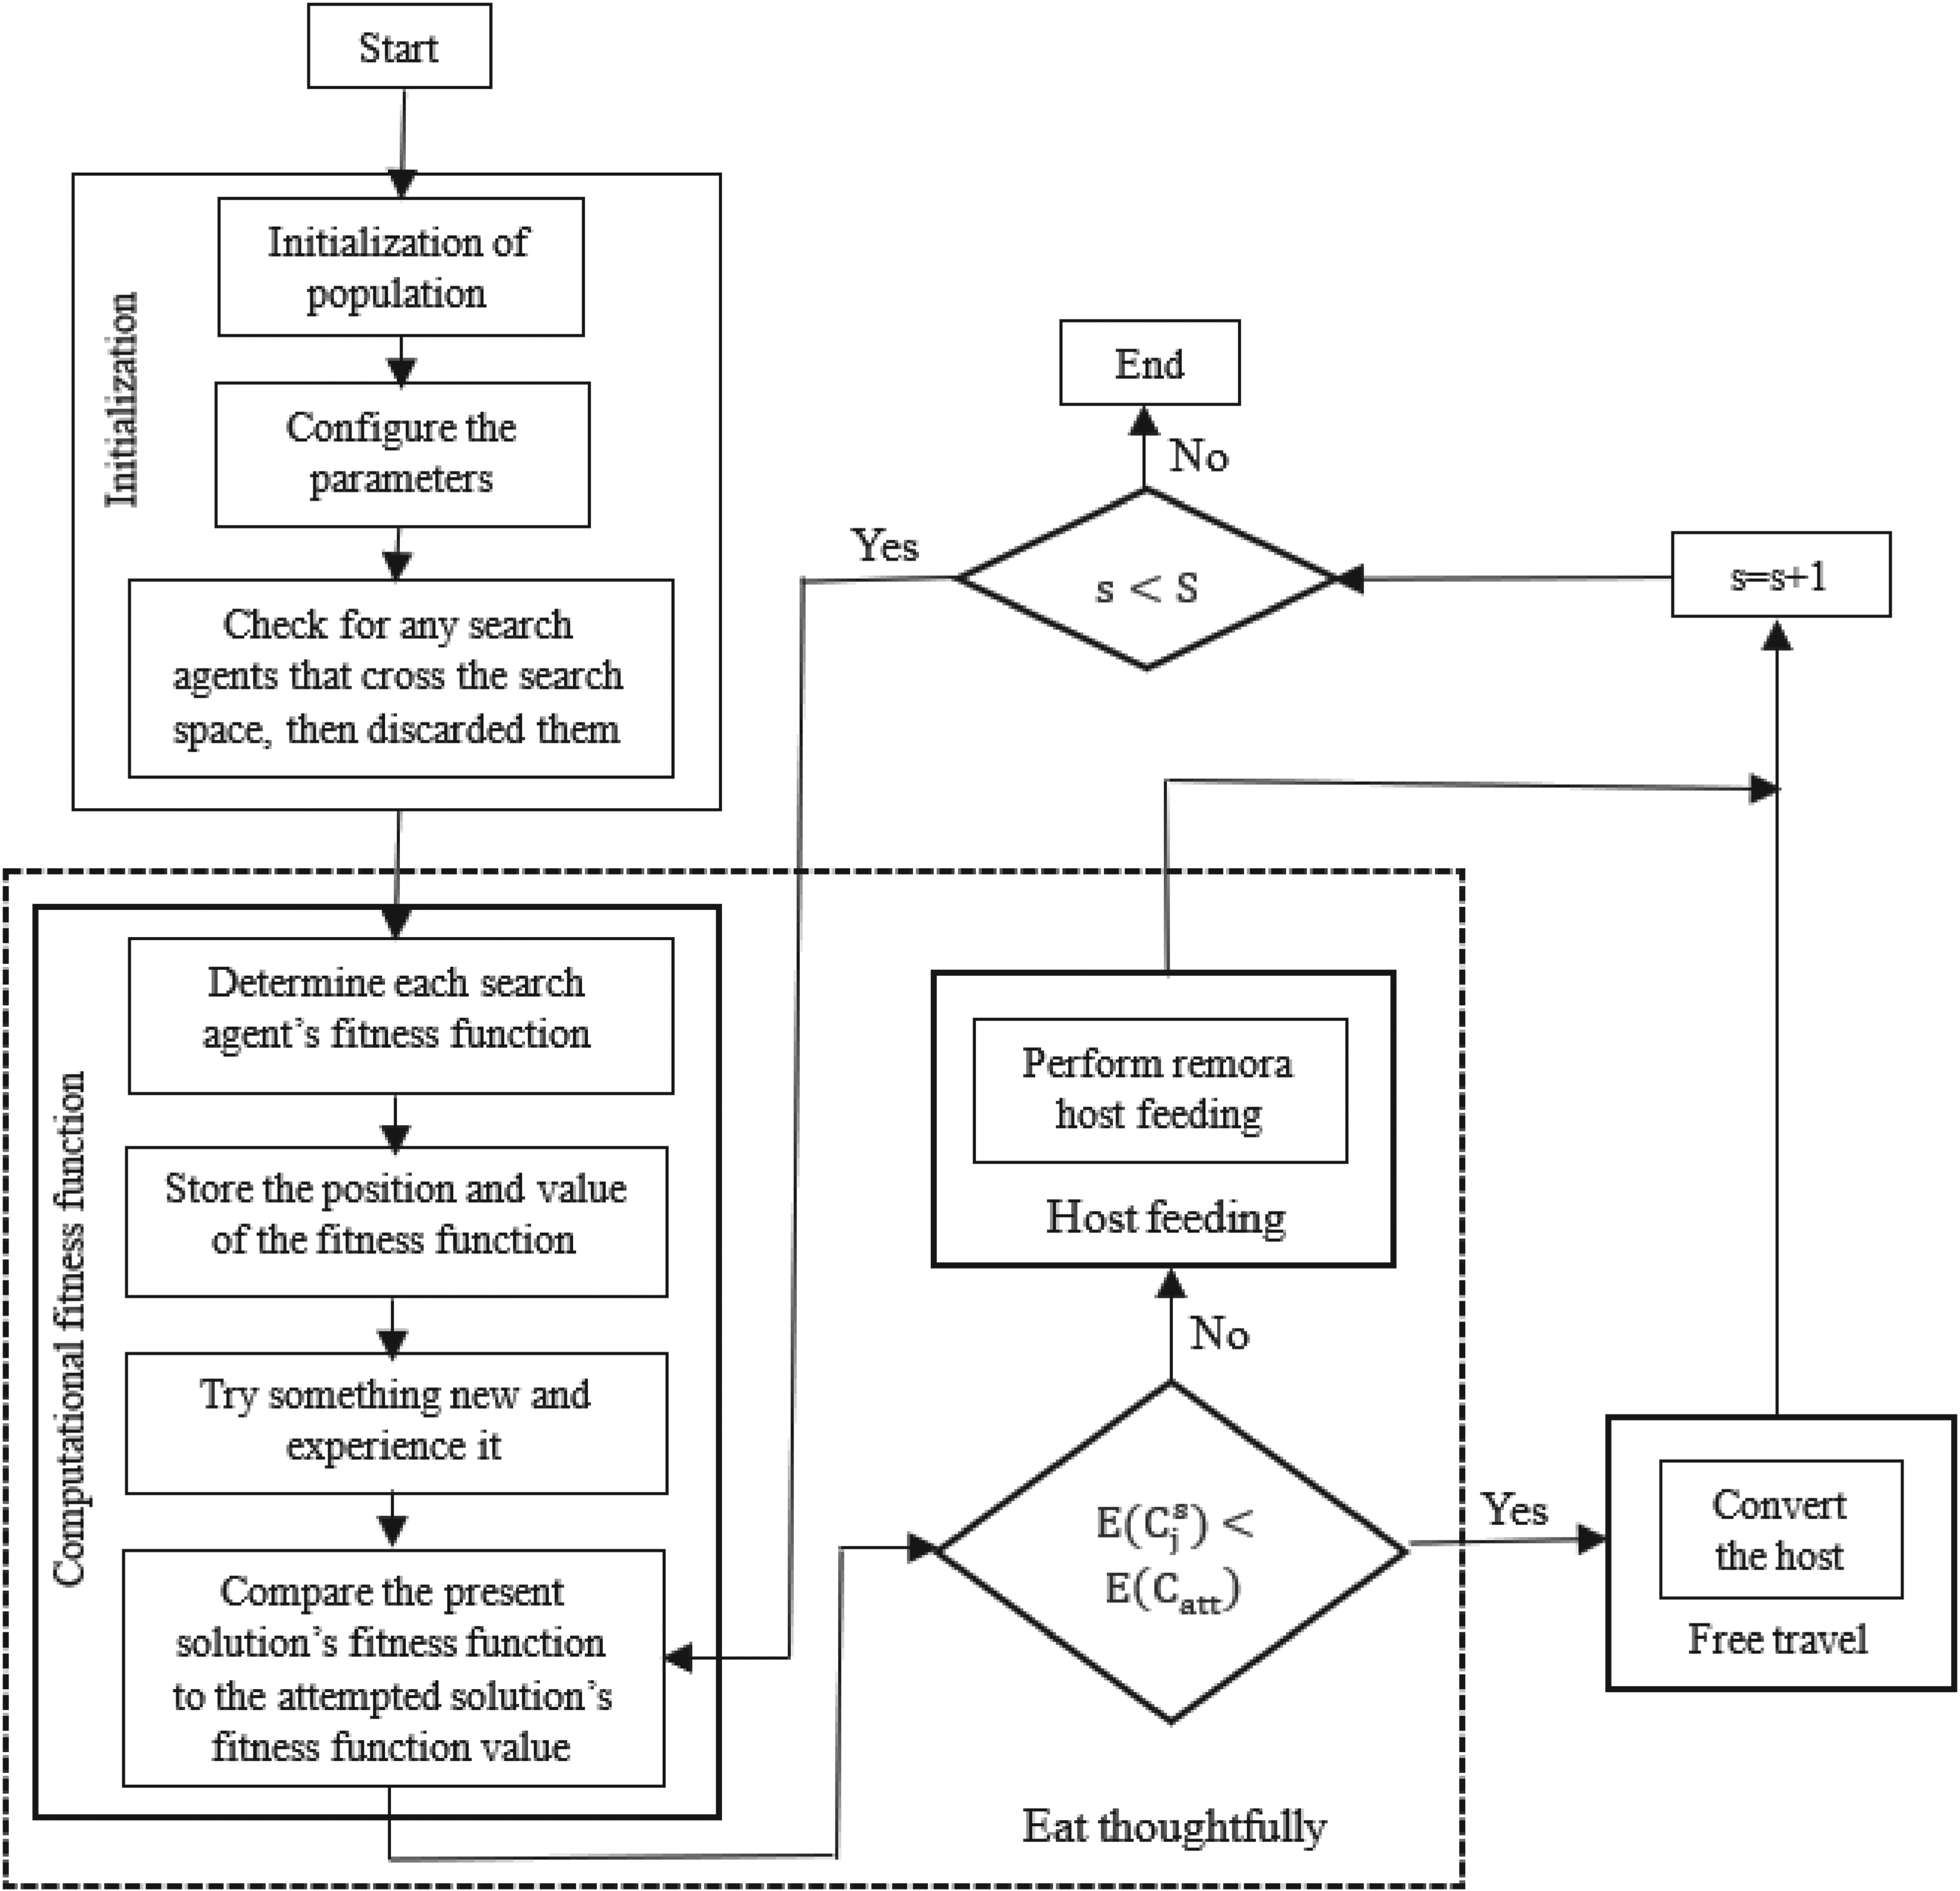
Flow diagram of ROA.
After the encoder's output is included in the classification task, the class labels are determined as tokens by the softmax activation function of the model.

Eye tracking retinal scan path images usually create a sequence of consecutive fixations and saccades generated from the path of eye movement over a specific time. Detecting the corner with the computer vision technique extracts all the corners from the image, and it determines the contents of the image. Detection of eye movement from various places helps to detect and differentiate the autism child from a normal child. Here, Shi-Tomasi corner detection identifies the eye movement image points by analyzing the variations. The corner points are often categorized by using the intensity values.
Here, two different participants are analyzed and trained on their retinal scan path eye movement images E, which are the combination of both autism and non-autism images. The autism-based eye retinal scan path images are represented as A, and the non-autism-based eye retinal scan path images are represented as N.

Figure 5 shows the eye-tracking retinal scan path images of ASD and non-ASD. The retinal scan path images are usually a sequence of consecutive fixation points and eyeball movements through a specific period of time, and they cannot be overlapped by themselves.

Eye-tracking retinal scan path images of ASD and non-ASD.
The purpose of preprocessing is to enhance the quality and appearance of an image. Moreover, it eliminates certain portionsthat are unnecessary and thus minimizes the size of an image. It contains four distinct operations, such as the conversion of an RGB to grayscale image, the application of the Color Stretching (CS) operation, cropping an image, and down sampling an image, which resizes the image to the appropriate size. Figure 6 shows a pipeline process of preprocessing stages.

Pipeline process.
The original retinal scan path eye image dataset contains 219 autism images and 328 non-autism images. The dataset is symbolized as 

Generally, the original retinal scan path eye images are not appropriate to train the neural network applications. Because the original images are color images, and have redundant features. The size of the color image is too big, and it takes up more storage while training. If, there is any background noise, it can also be removed in the pre-processing stage.
Transforming the eye retinal scan path color images to grayscale image, and it maintains the brightness of the image and thus the grayscale image is symbolized as 

Contrast stretching (CS) is a method for improving images, that can improve the image by using intensity values. This is also a kind of normalization process that can change the range of pixel intensity values, and thus the stretching image is symbolized as
To calculate the minimum gray scale values:


Cropping the images by eliminating the undesirable portion of an image, the cropped image is symbolized as 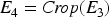


Down sampling reduces the size of each image, and each image is resized and thus the down sampled image is symbolized as E5.

Generally, down sampling saves storage space. Larger storage spaces always bring in overfitting problems, which decreaseperformance.

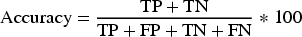
The efficacy of the ADETframework for detecting autism is evaluated through mathematical measurements. The parameters for evaluating autism detection are accuracy, specificity, sensitivity, and precision. The confusion matrix is the major parameter that calculates the exact performance of the true and false values of the tested eye-based images.
Figure 7 represents the experiment's result of strong corner detection. The first column represents the original image from the retinal scan path images dataset.

Experiment results of strong corner detection.
The second column represents the image with detected corners using the Shi-Tomasi corner detection algorithm. The third column represents the patches of the corner detection image. Finally, the fourth column represents the selected strong corners of the original image.
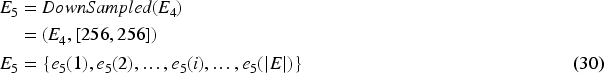
To train the proposed ADET model for detecting autism and non-autistic children by using eye tracking retinal scan path images. Here, the optimizer used is the Adam optimizer which works and achieves good recognition accuracy. The number of epochs used for training the model is 50. Batch normalization is also used to normalize the training image. Table 2 has a description of parameter setups.
Parameter configuration.
The dataset contains eye tracking retinal scan path images and it is implemented for detecting autism in children. Generally, there are 547 images which are divided into autism and non-autism images. The split image is described in the following Table 3.
Splitting the eye-tacking retinal scan path image dataset.

Precision, accuracy, AUC, sensitivity, and specificitywere evaluated by using the confusion matrix, which contains all true and false classified images and the values were generated by using the following equations:


The following equations evaluate the values of all the parameters of the suggested method and they are described in Table 4.
Performance measures of the proposed ADET model.

Performance measures of the proposed ADET model.
The transformer model is one of the most efficient models to evaluate, train and classify medical related images and it completely depends on the image's visibility and clarity. Generally, the transformer model classifies the images for training, testing and validating them. Training images train the set of images by splitting them into patches and gathering their features.
The features are easily gathered and trained by using the corner detecting process. This process extracts the features with an encoder mechanism and classifies the output layer with two possibilities. The output layer detects the particular image of the eye tracking retinal scan path, which denotes whether the child has autism or not. The result demonstrates the total number of images for training, testing and validating processes and detects the accuracy and loss curve of the suggested method shown in Figures 8 and 9.
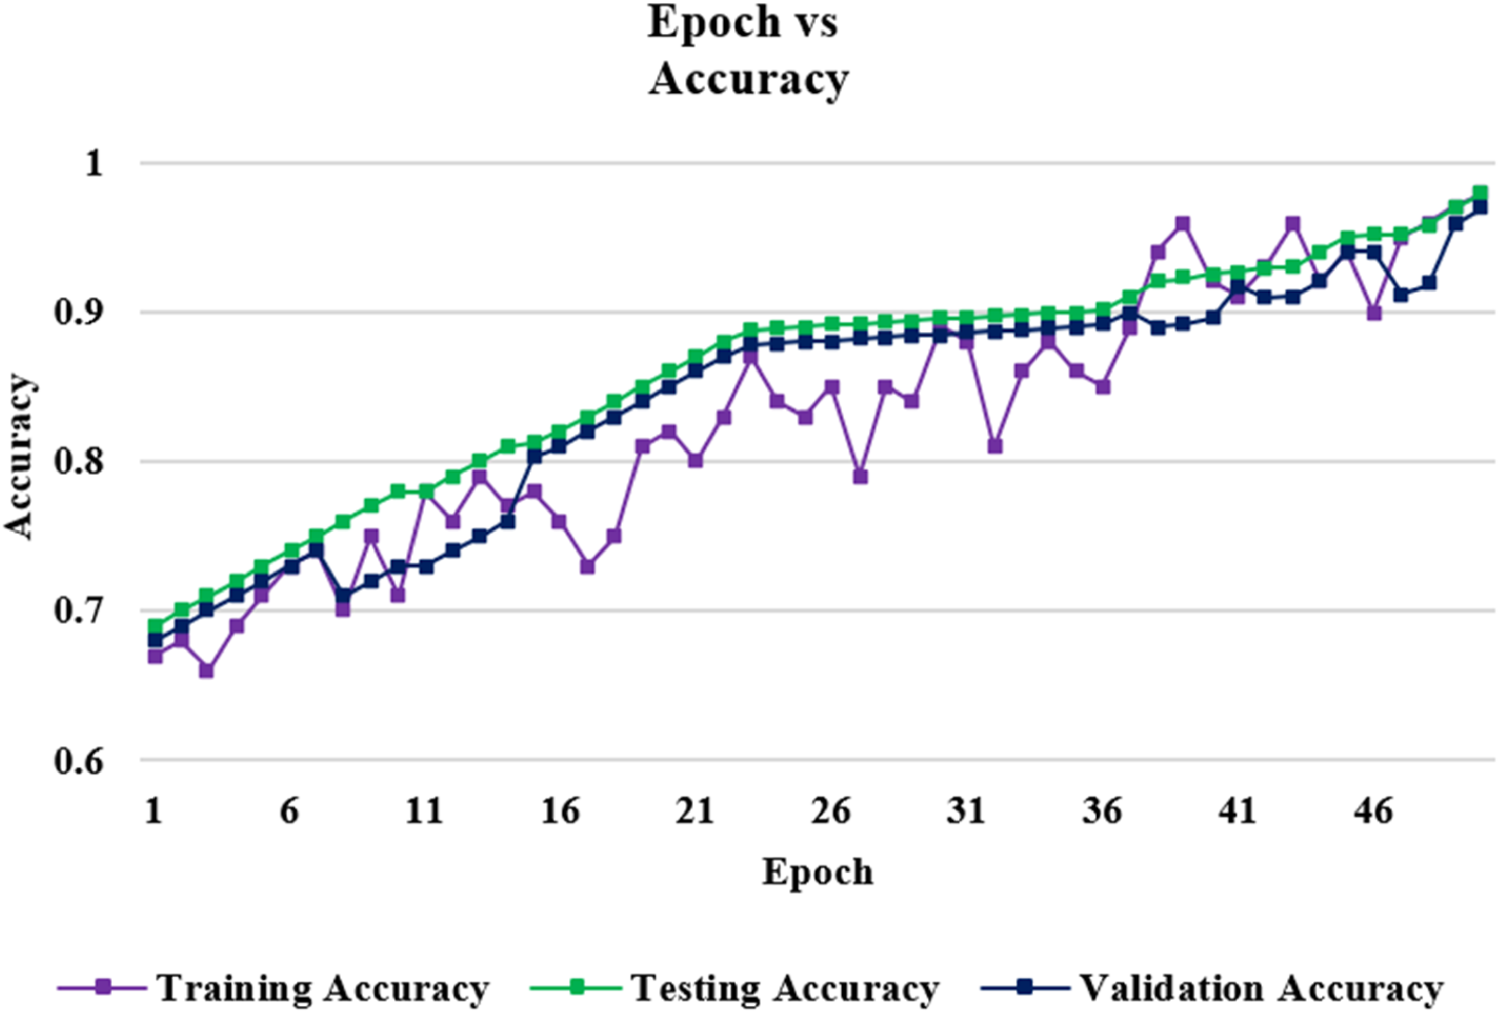
Compare the accuracy with epoch.

Compare the loss with epoch.
The Receiver Operating Characteristics (ROC) measure the algorithms’ performance during the evaluation phase.The algorithm operates quite efficiently when the curve gets closer to the left corner. The performance of the suggested method is depicted in Figure 10 with the x-axis representing specificity or FP rate and the y-axis representing sensitivity or TP rate.

ROC graph of the proposed ADET model.
Table 5 summarizes the performance results of the existing model with the proposed algorithm. It can be concluded that our proposed model achieves higher accuracy and better performance than the existing model. When the suggestedtechnique is trained and classified with higher accuracy than the existing methodology. Even though there are a smaller number of images,it achieves a better computation result by using the vision transformer model.
Comparison table of the performance result analysis.

Table 5 indicates that the suggested ADET model achieves a better classification accuracy of 38.31%, 23.71%, 13.01%, 1.56%,and 18.26% than the RM3ASD, 7 MLP, 24 SVM, 9 CNN, 10 and SVM 1 methods.
Our proposedADET model achieves a better classification precision of 39.28%, 25.66%, 13.64%,5.11%, and21.36% than the RM3ASD, 7 MLP, 24 SVM, 9 CNN, 10 and SVM 1 methods.
Our proposedADET model achieves a better sensitivity of 35.26%, 31.78%, 25.04%,35.68%, and26.83% than the RM3ASD, 7 MLP, 24 SVM, 9 CNN, 10 and SVM 1 methods.
Our suggested ADET model achieves a better specificity of 20.36%, 18.24%, 14.69%,3.95%, and16.51% than the RM3ASD, 7 MLP, 24 SVM, 9 CNN, 10 and SVM 1 methods.
Following the categorization procedure, we had to reevaluate their performance and use a variety of statistical techniques to support these results. In this work, the statistical significance of each individual classifier was tested using the Wilcoxon Signed-Rank (WSR) approach. We applied this technique to the results of various assessment indicators for each age group. Below is a succinct explanation of the WSR method:
A non-parametric statistical test called the WSR Test is utilized to compare two independent samples. When the population mean is not relevant, this approach is thought of as a t-test substitute. The following is the method's working formula:
Conclusion
Autism is a brain developmental disorder that affects children in their early stages and can spread all over the world. In the proposed work, an eye tracking retinal scan path image dataset is evaluated using a transformer application. The consistency and quality of the eye tracking data determine the accuracy of the suggestedADET model. The experimental result indicates that the suggested work is more effective. The ADET model corner detection technique is also used to give a higher level. Improve the accuracy level of feature selection with the Remora optimization algorithm. The vision transformer model is finely tuned and it shows statistically better performance. The classification accuracy reaches 97.27% and these results suggest that the model gives good generalization efficiency in binary class classification when compared to the previous approaches. With a small amount of training data, the suggested approach has proven to be resilient. The proposed approach has a significant flaw in that it relies heavily on eye-tracking data, which is not always available or simple to gather, particularly in environments with limited resources or diversity. The model's usability and scalability in real-world applications may be limited by its dependence on certain technology and regulated conditions, especially for large-scale or extensive screening operations. To address this issue, by implementing reliable data augmentation techniques and sophisticated preprocessing approaches to manage variability in eye-tracking data, further work could improve the accuracy and generality of eye-tracking models. Additionally, create a mobile application with this screening methodology that incorporates eye tracking data from the age of children from 6 to 24 months and it can independently diagnose the screening mechanism for toddlers by using mobile devices. Moreover, electrooculograms (EOG) are used to create the dataset for detecting autism in children at an early stage by evaluating the artificial intelligence framework.
Footnotes
Acknowledgements
The authors would like to thank the National Engineering College, K.R. Nagar, Kovilpatti for their support by providing fellowship and constructive suggestions that have helped to publish this research paper.
Ethical approval
My research guide reviewed and ethically approved this manuscript for publishing in this Journal.
Informed consent
I certify that I have explained the nature and purpose of this study to the above-named individual, and I have discussed the potential benefits of this study participation. The questions the individual had about this study have been answered, and we will always be available to address future questions.
Funding
The authors received no financial support for the research, authorship, and/or publication of this article.
Declaration of conflicting interests
The authors declared no potential conflicts of interest with respect to the research, authorship, and/or publication of this article.
Availability of data and material
Data sharing is not applicable to this article as no new data were created or analyzed in this Research.
Human and animal rights
This article does not contain any studies with human or animal subjects performed by any of the authors.