
Abstract
Background
Coronary artery disease (CAD) is a leading cause of ischemic heart disease, and accurate identification of coronary lesion-specific ischemia (CLSI) is crucial for treatment. Coronary computed tomography angiography (CCTA) provides detailed visualization of coronary lesions, but its multiparameter analysis for predicting ischemia remains underexplored.
Objective
To develop a nomogram prediction model for CLSI based on multiparameters derived from CCTA.
Methods
A total of 160 patients with CAD were divided into non-ischemic and ischemic groups according to the target-vessel CT-fractional flow reserve (CT-FFR). The baseline data of the two groups were collected, and the quantitative parameters of CCTA were compared. The predictive value of these parameters for CLSI was analyzed by the receiver operator characteristic (ROC) curve, and independent risk factors were analyzed by logistic regression.
Results
The ischemic group showed significant differences in maximum diameter stenosis (MDS), maximum area stenosis (MAS), minimum lumen area (MLA), plaque burden (PB), pericoronary fat attenuation index (FAI), and low-attenuation plaque compared to the non-ischemic group (P < 0.05). Logistic regression revealed that MAS, MLA, FAI, and PB were independent risk factors for CLSI. The area under the curve (AUC) for MAS, MLA, FAI, and PB were 0.783, 0.947, 0.804, and 0.935, respectively. The calibration curve of the nomogram showed a good fit to the actual values [0.995 (95%CI: 0.988–1.000)].
Conclusions
This study constructed a nomogram risk prediction model for CLSI based on MAS, MLA, FAI, and PB, which holds significant clinical value.
Introduction
In recent years, coronary lesion-specific ischemia (CLSI), which refers to the presence of localized ischemia within the coronary circulation caused by specific lesions such as stenosis or plaque rupture,1,2 has emerged as a significant non-communicable disease (NCD) threatening public health globally and has risen to prominence as a primary public health concern in China.3,4 According to the disease report, the prevalence and mortality rates of CLSI in China are still on the rise. Numerous studies have shown that during the progression of CLSI, the lipid composition of arterial plaques is prone to abnormal changes, which reduces the stability of atherosclerotic plaques, causing plaque rupture and thrombosis, which has a serious adverse impact on the prognosis.5,6 Although coronary plaque rupture is thought to be the dominant factor in the progress of acute coronary syndromes, the mechanisms by which coronary plaques rupture from a stable to an unstable state are poorly understood, and the methods used to assess it have many limitations.
Coronary Computed Tomography Angiography (CCTA), defined as a non-invasive imaging technique utilizing computed tomography (CT) to visualize the coronary arteries and their branches following the administration of a contrast agent, serves as one of the most important methods for assessing CLSI. It can reconstruct the contrast-filled luminal tissue, accurately differentiate the lumen from the vessel wall and surrounding tissues, and observe the plaque. Furthermore, CCTA assesses the lumen in three dimensions, as well as from a cross-sectional perspective, providing a comprehensive evaluation. 7 Based on this, CCTA can directly reflect the degree of coronary artery ischemia and stenosis, clarify the nature of plaque in the wall, and show the density of myocardial tissue in the area supplied by the coronary arteries. 8 In addition, CCTA can improve the accuracy of disease diagnosis, has good sensitivity to flow-restrictive disease, and is the preferred method to exclude flow-restrictive coronary artery disease. 9 However, conventional CCTA cannot accurately confirm whether coronary artery stenosis results in hemodynamic abnormalities and triggers specific ischemia in coronary artery disease. 10 At the same time, CCTA is easily interfered by external factors, which can overestimate or underestimate the degree of myocardial ischemia during the clinical examination and increase the probability of misdiagnosis and underdiagnosis. 11
With the continual advancement in medical standards and technological advancements in medical equipment, the clinical research surrounding Fractional Flow Reserve (FFR) has significantly deepened. FFR, a measure of the functional significance of coronary artery stenosis, assesses the ratio of maximal blood flow in a stenotic coronary artery to maximal blood flow in the same artery if it were normal. Correspondingly, a novel coronary artery examination technique, known as Coronary Computed Tomography-based Fractional Flow Reserve (CT-FFR), has been rapidly promoted and extensively applied in clinical settings. 12 CT-FFR leverages advanced computational fluid dynamics and coronary computed tomography angiography (CCTA) data to non-invasively estimate FFR values, offering insights into coronary hemodynamics and myocardial ischemia, thereby enhancing diagnostic accuracy and patient care.CT-FFR effectively integrates coronary anatomy and functional assessment, addressing the limitations of standalone FFR measurement and CCTA examination, thereby enhancing procedural safety, improving the accuracy of disease diagnosis, and demonstrating a heightened veracity in surgical outcomes and disease assessments. 13 Related studies have shown that there may be a relationship between coronary plaque characteristics and the vulnerability and specific ischemia of coronary lesions. Therefore, the aim of this study was to construct a nomogram prediction model for the occurrence of coronary lesion-specific ischemia (CLSI) based on CCTA-derived multiparameter.
Material and methods
General information about patients
The data of 160 patients with Coronary Artery Disease (CAD), a medical condition characterized by the narrowing or obstruction of the coronary arteries that supply blood to the heart muscle, treated in our hospital from January 2022 to January 2024 were retrospectively analyzed. This retrospective study was approved by the institu- tional review board (No. Y [2024] 151) of the General Hospital of Northern Theater Command. The patients provided written informed consent to participate in this study.
Inclusion and exclusion criteria
Inclusion criteria: (1) Undergoing Coronary Computed Tomography Angiography (CCTA) with Coronary Angiography (CAG), a diagnostic procedure to visualize the coronary arteries, and/or Percutaneous Coronary Intervention (PCI), a minimally invasive procedure to treat narrowed or blocked coronary arteries, within at least 1 month prior to the study;(2) Coronary stenosis > 50% under CCTA.
Exclusion criteria: (1) CCTA image quality could not meet the diagnostic criteria; (2) CCTA images could not accurately evaluate plaques; (3) Failure of non-invasive hemodynamic analysis: (4) Post-coronary artery bypass grafting, aortic coarctation and postoperative, valvular lesions, coronary artery origin variations, and congenital heart disease; (5) Comorbidity with psychiatric disorders.(In order to protect mentally ill people from potential harm or exploitation and to ensure their rights and interests, they were excluded from the study to reduce unnecessary risks.)
Methods
CCTA examination
Before the examination, the patient was instructed to abstain from food and drink for 4 h, and sublingual nitroglycerin was taken 5 min before the examination to dilate the coronary arteries. The 256-slice CT scanner (Bril-liance iCT, Philips Healthcare, Cleveland, OH, USA) was used to scan from the tracheal eminence to the diaphragmatic surface of the heart. The CCTA acquisition parameters were as follows: the collimation was 128 × 0.625 mm, rotation time was 270 ms, tube voltage was set at 100–120 kV, and the tube current ranged from 500–700 mAs. A conventional calcium integral scan was performed first, and after the scanning, 60–70 mL of iodinated contrast (Ioversol 320mgI/mL) was injected into the anterior vein of the elbow at an injection rate of 4–6 mL/s. The data were obtained using a retrospective electrocardiogram-gated protocol. The images were reconstructed with a window centered at 75% of the R-R interval, utilizing a section thickness of 0.9 mm and a reconstruction increment of 0.45 mm.
Quantitative analysis of plaque characteristics
CCTA data were transferred and multi-planar reorganization (MPR), curved-planar reorganization (CPR), volumetric reproduction (VR) and maximum intensity projection (MIP) images were generated. Quantitative and qualitative analyses were performed on plaques in diseased all CCTA coronary arteries. Data analyses were performed by 2 clinically experienced senior physicians. Quantitative image characteristics included maximum diameter stenosis (MDS), maximum area stenosis (MAS), minimum lumen area (MLA), plaque burden (PB), remodeling index (RI), eccentric index (EI). MDS = (reference vessel diameter - lumen diameter at the narrowest point of the lesion) / reference vessel diameter × 100%. MAS% = (cross sectional area of reference vessel - cross sectional area of lumen at the narrowest point of the lesion) / cross sectional area of reference vessel × 100%, Manual corrected MLA was automatically measured at the narrow stern point of the lesion on cross-sectional images using a digital caliper. PB = (cross sectional area of vessel - MLA) / cross sectional area of vessel, RI = cross sectional vessel area of the lesion / area of vessel proximal to the lesion. El = (maximum distance between the centerline of the lumen at the narrowest point and the outside of the vessel wall - minimum distance between the centerline of the lumen at the narrowest point and the outside of the vessel wall)/maximum distance between the centerline of the lumen at the narrowest point and the outside of the vessel wall. Qualitative parameters: (1) low attenuation plaque; (2) positive remodeling; (3) Napkin-ring sign (NRS, refers to the imaging manifestation of low attenuation plaques surrounded by a ring of high attenuation areas on CT images); (4) Punctate calcification. All parameters were measured 3 times consecutively.
Measurement of ct-FFR
Utilizing the CT-FFR analysis software, following the importation of the coronary CTA image, the software automatically identifies the centerline and lumen of the coronary artery. Any necessary corrections are made manually. Additionally, it produces a pseudo-colored representation of the coronary artery tree and calculates the CT-FFR values for each vessel, with measurement points selected 2–3 cm from the plaque's end. When the CT-FFR value was <0.80, it indicated that there was reversible myocardial ischemia, and vice versa, it indicated that there was no reversible myocardial ischemia. According to the results of the FFR test, the patients were divided into the CT-FFR > 0.80 group (n = 88) and the CT-FFR ≤ 0.80 group (n = 72).
Analysis of adipose tissue around diseased coronary arteries
CCTA data were transferred to Perivascular Fat Analysis Tool software to map the spatial variation of perivascular fat attenuation in coronary arteries to measure perivascular fat volume. Measurement range of adipose tissue around diseased coronary arteries: length of coronary plaque as longitudinal distance, and vessel diameter as radial distance. The fat attenuation index (FAI), which measures the degree of attenuation of perivascular fat surrounding diseased coronary arteries,was calculated based on a histogram of perivascular fat attenuation of the plaque in the range of CT values (−190 HU to −30 HU).
Statistical analysis
Statistic Package for Social Science (SPSS) 27.0 software (IBM, Armonk, NY, USA) was applied to analyze the data. Normal distribution data, expressed as (
Results
Comparison of basic clinical data
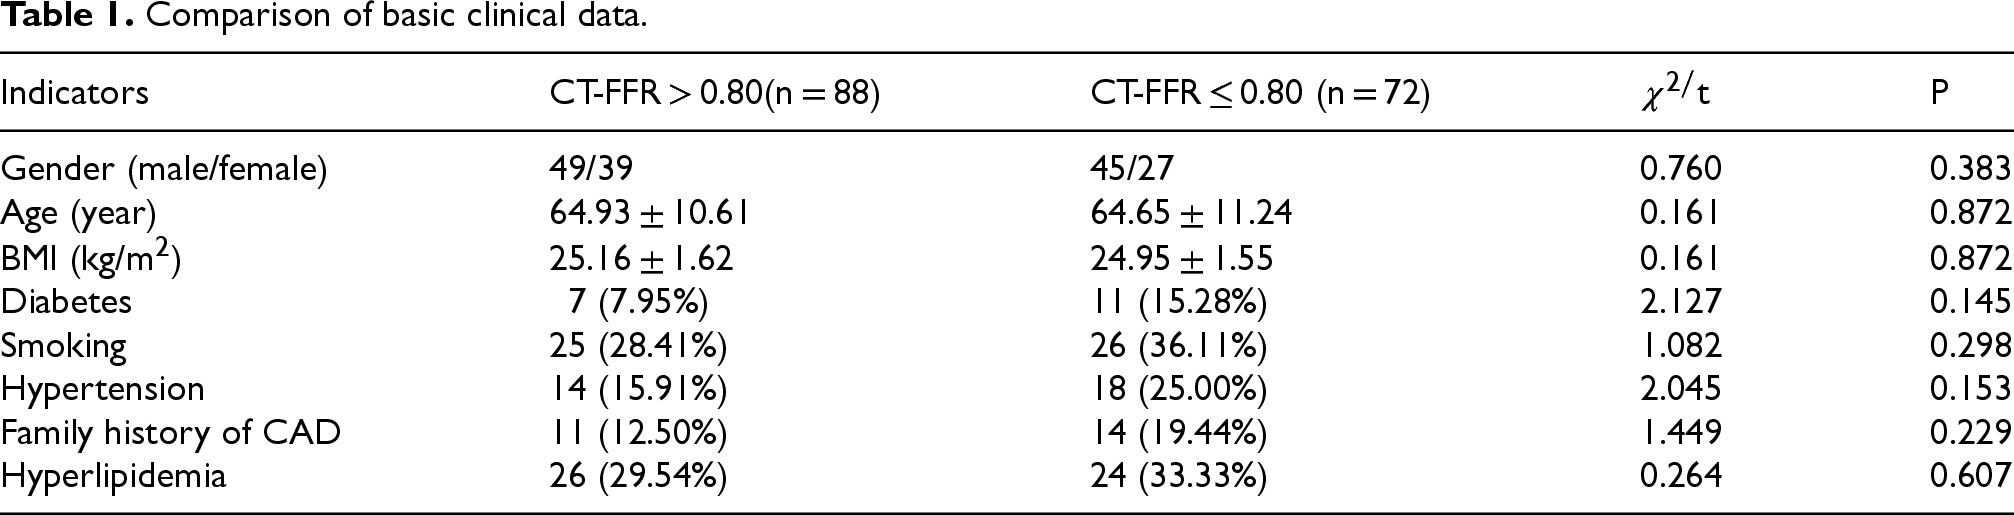
A total of 160 CAD patients were included in this study, of which 72 patients had coronary artery lesion specific myocardial ischemia, accounting for 45.00%. Based on the patient level, there were no significant differences in demographic characteristics such as age, gender and BMI, and medical history such as hyperlipidemia, diabetes hypertension, and smoking history at the time of CCTA examination (Table 1, P > 0.05).
Comparison of basic clinical data.
Comparison of basic clinical data.
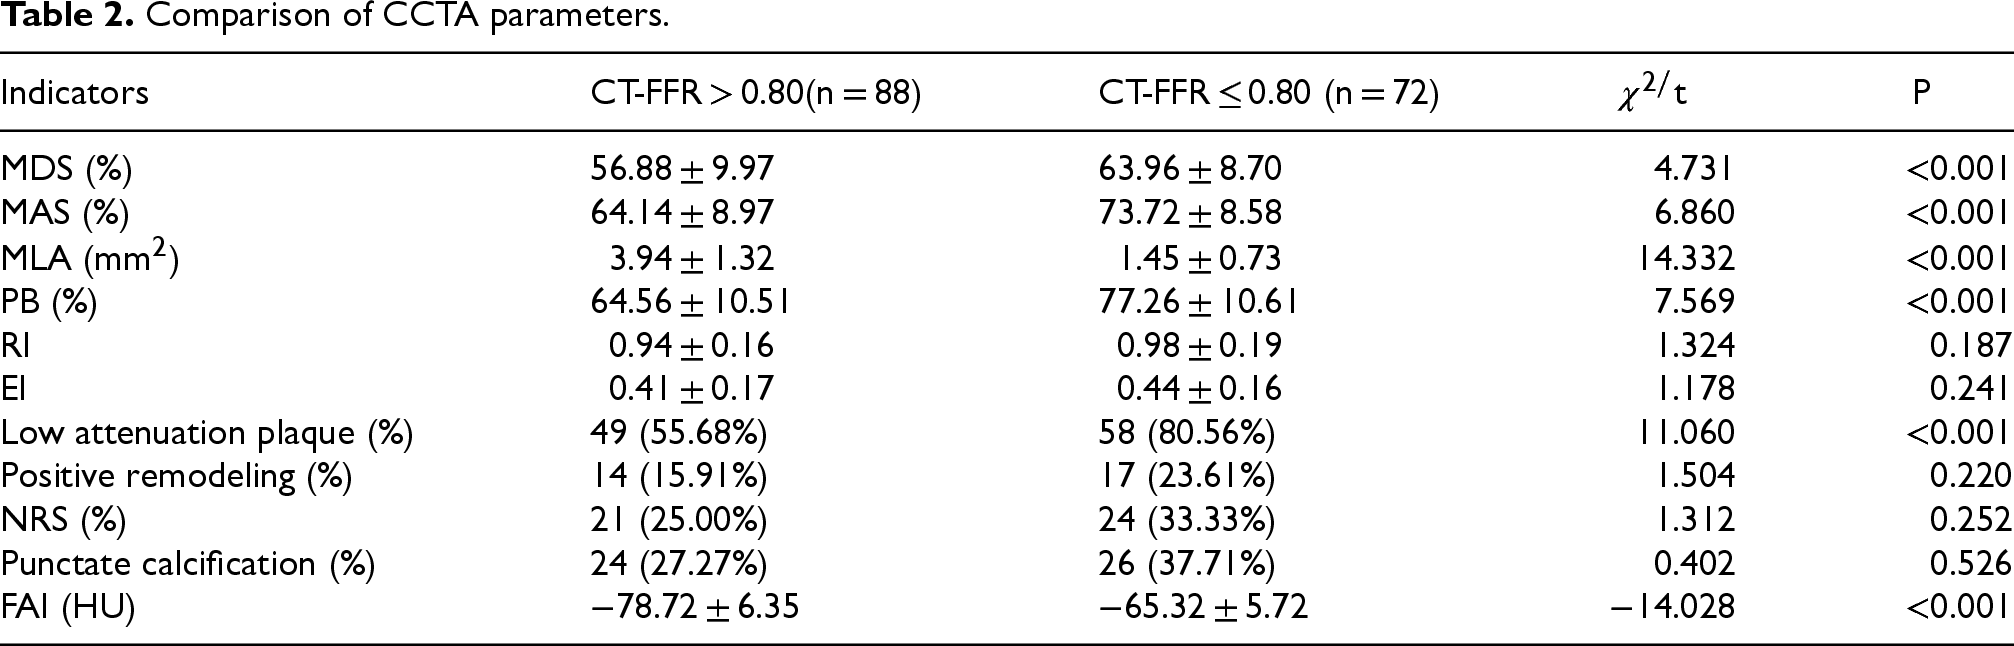
MDS, MAS, PB, low-attenuation plaque and FAI were significantly higher and MLA was significantly lower in the CT-FFR ≤ 0.80 group compared to the CT-FFR > 0.80 group (Table 2). These results suggest that MDS, MAS, MLA, PB, low-attenuation plaque and FAI are associated with the occurrence of coronary lesion specific ischemia.
Comparison of CCTA parameters.
Comparison of CCTA parameters.
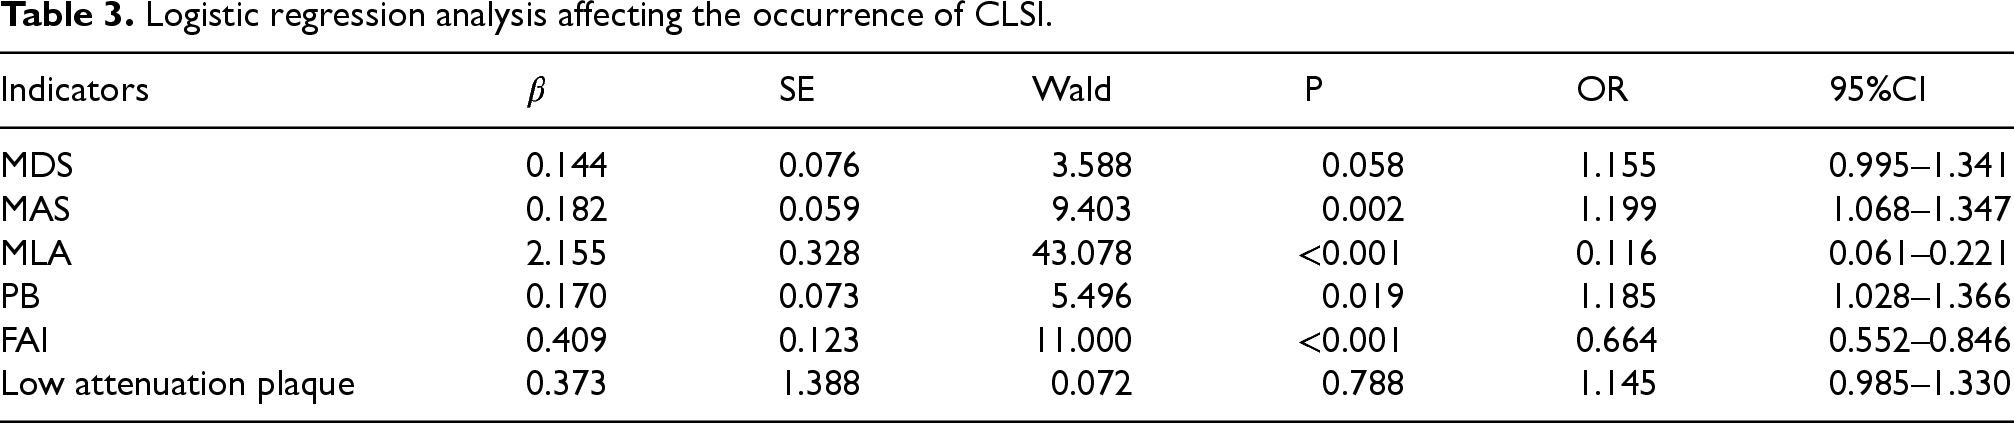
Logistic regression analysis showed that MAS, FAI, MLA and PB were risk factors for coronary lesion specific ischemia (OR = 1.199, P = 0.002; OR = 0.664, P < 0.001; OR = 0.116, P < 0.001; OR = 1.185, P = 0.019) (Table 3).
Logistic regression analysis affecting the occurrence of CLSI.
Logistic regression analysis affecting the occurrence of CLSI.
The ROC curves for MAS, FAI, MLA and PB were plotted (Figure 1). The area under the curve (AUC) of MAS, MLA, PB and FAI were 0.783, 0.947, 0.804 and 0.935, respectively (Table 4). The optimal cut-off values were 72.50, 2.67, 66.46 and 73.82, respectively.

ROC curves for each independent risk factor.
Results of ROC curve analysis of relevant variables.

A nomogram prediction model for predicting the occurrence of coronary lesion specific ischemia was established according to the screened 4 independent influencing factors (Figure 2). The nomogram provides a visual representation of the relative contribution of each factor to the overall risk prediction. And the nomogram includes points for MAS, MLA, FAI, and PB, with a total score indicating the predicted probability of CLSI.
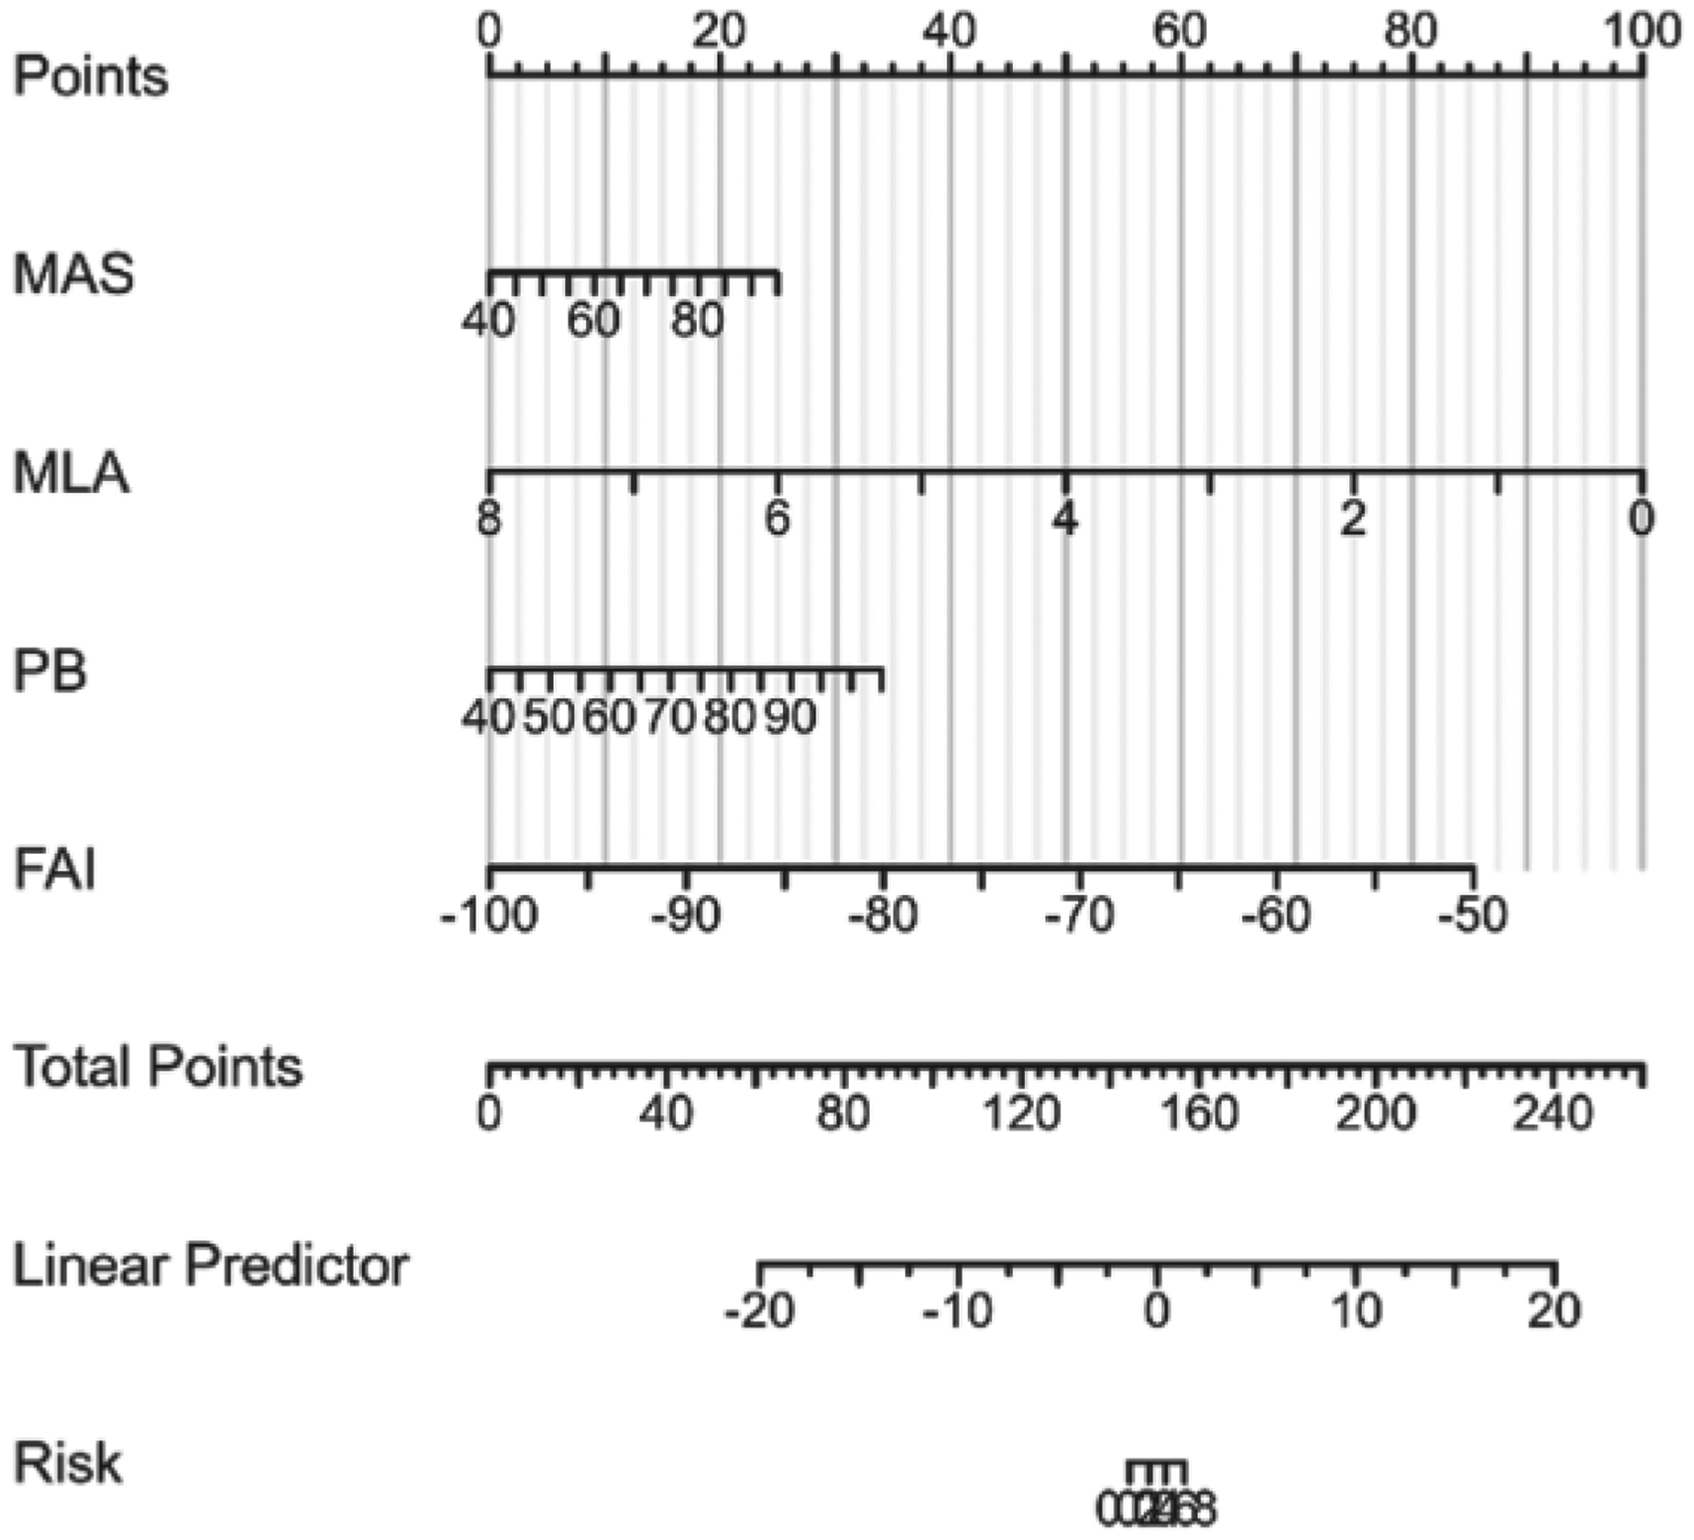
The nomogram model for predicting CLSI.
The calibration curve showed that the predicted values of the model were well fitted to the actual values, and the predicted results of the nomogram model were in good agreement with the actual results (Figure 3). The predictive ability of the nomogram model was evaluated by drawing the ROC curve. The ROC curve analysis of the nomogram model showed an AUC of 0.995 (95% CI: 0.995–1.002), indicating excellent predictive ability (Figure 4). The calibration curve shows the agreement between the predicted probabilities and the actual results.The ROC curve profile shows the overall predictive performance of the nomogram model for CLSI.
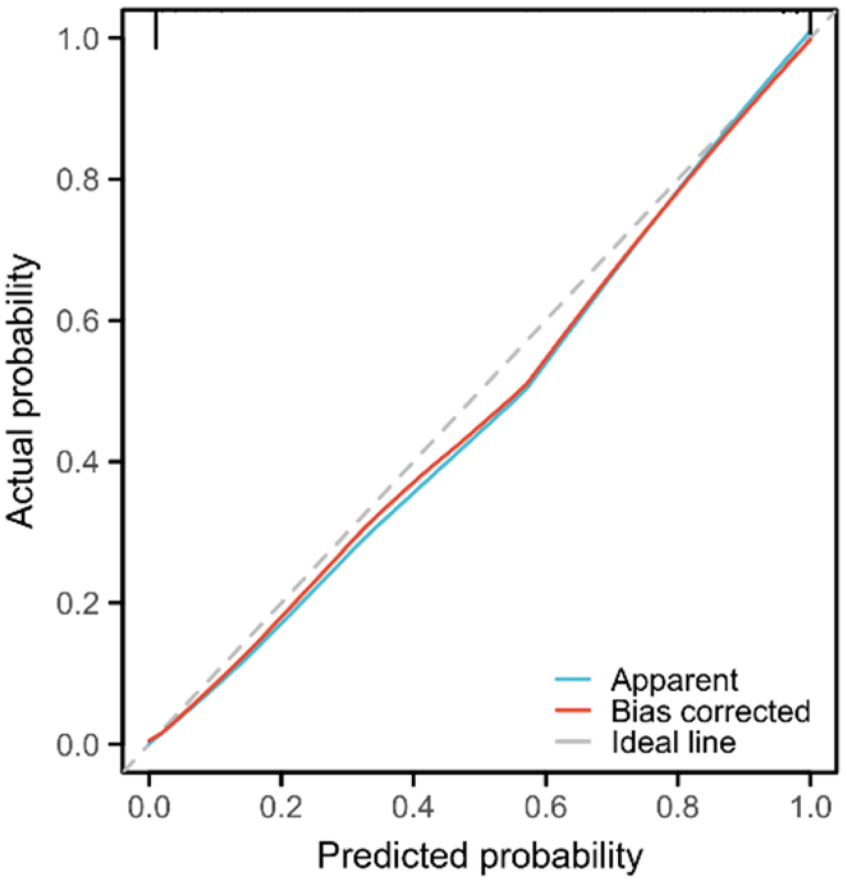
Calibration curves for predicting CLSI.

ROC curves for CLSI.
This study was to confirm the association between quantitative and qualitative parameters of diseased coronary plaques, CCTA derived parameters, and CLSI. The main findings of this study were to MAS, MLA, FAI, PB can be used as independent risk factors for coronary artery lesions specificity ischemia occurred, can improve the diagnosis ability of specific myocardial ischemia to coronary pathological changes. When compared to the myocardial diagnostic strategies (MDS) commonly employed in clinical settings, the myocardial assessment strategy (MAS) demonstrates a superior ability to precisely diagnose myocardial ischemia stemming from coronary plaque lesions. 14 The findings indicate that in patients with coronary artery disease (CAD) who exhibit coronary vessel diameter stenosis exceeding 50%, the detection rate of coronary lesion-specific ischemia (CLSI) is notably low. This circumstance leads to an inefficient utilization of medical resources. At the individual patient level, myocardial ischemia was confirmed in merely 72 patients, constituting approximately 45% of the total patient population. Conversely, roughly 55% of patients with coronary heart disease (CHD) did not exhibit CLSI. Research has highlighted that visually assessing coronary lumen diameter stenosis during invasive coronary angiography (ICA) has limitations in diagnosing CLSI, underscoring the need for more accurate diagnostic approaches. 15 Guaricci et al. found that 65% of moderate-diameter stenoses (50–70%) in FFR-guided coronary revascularization cases did not have coronary-specific myocardial ischemia, and 20% of severe-diameter stenoses (71–90% stenosis) did not have coronary-specific ischemia. 16 The results of Hou et al. on CCTA showed that MDS% had limited diagnostic power for CLSI, which is consistent with our results. 17 Moreover, our results of the present study revealed that MAS had a better ability to diagnose CLSI than MDS (P = 0.002 vs P = 0.058). The superiority of MAS over MDS in the diagnosis of CLSI may be mainly attributed to the fact that MAS provides more luminal information. Due to the prevalence of complex lesions, MAS can provide the stenotic area of the lumen cross-section at the narrowest point of the lumen, which is a more realistic reflection of the stenosis of the lumen. 18 In addition, in the presence of eccentric plaques, MDS tends to overestimate the true degree of stenosis due to the assessment of the diameter stenosis at the most severe point of the stenosis. 19 The CCTA study by Chung WY et al. demonstrated that the correlation between MAS and FFR was better than MDS when CCTA and FFR were used to quantitatively evaluate the degree of coronary artery stenosis (r = 0.609, 0.670, P < 0.001). 20
The CCTA-derived parameter MLA allowed accurate assessment of the most stenotic area of coronary arteries. Uzu et al. found that the CCTA-derived parameter MLA correlated well with the stenotic area of coronary arteries measured by optical coherence tomography under CAG (r = 0.839). 21 Cytokines and proinflammatory mediators secreted by the adipose tissue around the diseased coronary arteries may diffuse directly into the coronary artery wall through paracrine and vasculature secretory effects, resulting in the release of more proinflammatory mediators from flat adipocytes compared with flat ones. 22 This is a potential cause of coronary endothelial dysfunction and vasospasm. Vascular inflammation drives atherosclerotic plaque formation in coronary arteries and is an important cause of progression to vulnerable plaques, ultimately leading to CLSI. FAI of peri-coronary fat is a novel imaging biomarker. 23 Inflammatory factors released from diseased coronary arteries inhibit perivascular adipogenesis in neighboring vessels. 24 Adipose tissue regulates the progression of atherosclerosis by secreting cytokines. The extent of inflammation in diseased coronary arteries was quantified by mapping the extent of peri-coronary adiposity on CCTA and calculating the change in CT values to reflect coronary artery inflammation. The results of this study show that peri-coronary fat FAI can predict CLSI with an optimal cut-off value of −73.82 HU, which is similar to the results obtained in previous studies. Besides, PB had the same predictive value for CLSI. The reason for this may be related to the fact that the heavier plaque load and increased plaque volume suggest that the plaque has a complex composition and excessive accumulation of inflammatory cells, which may lead to a high risk of fibrous cap rupture and bleeding in the plaque and trigger downstream myocardial ischemia. 25 Low-density plaque is a sign of the presence of lipid core in the plaque, and the presence of necrotic core leads to vascular inflammation, which inhibits coronary vasodilatation and has been proved to be a factor causing myocardial infarction. 26
Based on the MAS, MLA, PB and FAI, a nomogram model was established to predict the occurrence of CLSI, and the validity of the model was verified by ROC curve and calibration curve. The good discrimination and consistency suggest that the model has certain clinical application value. This study has limitations: (1) this study is a single-center study, which may have some selective bias; (2) this study only collected baseline CCTA images, derived parameters and clinical data of patients, which could not completely exclude the effects caused by related medications and treatments of patients. In the future, it is necessary to further add the number of enrolled cases and conduct a multicenter prospective study to further confirm the results of this study.
In recent years, artificial intelligence (AI) has shown great potential in various medical fields. 27 AI algorithms, such as artificial neural networks and machine learning models, have been increasingly applied to analyze medical images and clinical data to improve diagnostic accuracy and treatment outcomes. For instance, in the field of antimicrobial agent design, AI has been used to predict the activity of new compounds. Veljović et al. 28 employed artificial neural networks and docking studies to investigate the antimicrobial activity of xanthene derivatives, showing that AI can effectively predict the efficacy of new compounds against specific pathogens. Additionally, in the classification of chronic obstructive pulmonary disease (COPD), AI algorithms have been developed to analyze pulmonary function test data and assist in the diagnosis and management of COPD patients. 29 These examples highlight the versatility and potential of AI in improving diagnostic accuracy and treatment strategies across different medical domains.
Future research could integrate AI to further improve the predictive power of nomogram models. For example, advanced AI algorithms could be used to extract more detailed and complex features from CCTA images, such as texture analysis of plaques or the assessment of vascular wall mechanics. These additional features could then be incorporated into the nomogram model to improve its accuracy and robustness. Moreover, AI-driven decision support systems could be developed to integrate the nomogram model with real-time clinical data, providing clinicians with immediate and personalized risk predictions for coronary lesion-specific ischemia. This integration could ultimately lead to more effective and efficient management of coronary artery disease.
Conclusion
In conclusion, MAS, MLA, FAI and PB can be used as independent risk factors for coronary artery lesion specific ischemia. The Nomogram risk prediction model of coronary artery lesion specific ischemia based on MAS, MLA, FAI and PB is reliable and has important clinical value. Future work should focus on incorporating advanced AI techniques to further enhance the predictive capabilities of the model and explore its potential applications in clinical practice.
Footnotes
Funding
The authors received no financial support for the research, authorship, and/or publication of this article.
Declaration of conflicting interests
The authors declared no potential conflicts of interest with respect to the research, authorship, and/or publication of this article.