
Abstract
The effect of continuous medical service intervention on health management for people who have suffered from Acute Ischemic Stroke (AIS) is an important issue in health care tracking. To pick out core aspects related to health, a relapse prediction model, evaluate the efficiency of continuous care and boost post-discharge results, a structured study is designed. After investigation and scientific verification, important signs and symptoms were chosen to set up a Significant Factors Neural Network Relapse Prediction Model (SFNNR) which aims to predict possible relapses based on previous patterns in medical data. The continuous care group was compared with the control group, and it turned out that participants in continuous care had significantly better results with fewer chances of having relapses and controlling chronic risks while displaying less psychological stress compared to the control group; furthermore, the continuous medical service showed great value on long-term management of AIS patients. The study points out that the integrated care approach should be taken more seriously as it can help healthcare staff predict the risk of relapse accurately so as to come up with personalized plans to control the relapse probability of the patients.
Keywords
Introduction
High disability and recurrence rates are the characteristics of the well-known and frequent occurrence of Acute Ischemic Stroke in the field of neurology. It is currently the leading cause of death among residents in China, with an annual mortality rate of 11.4% to 15.4% and a death/disability rate of 33.4% to 44.6%. 1 This places a significant burden on patients and their families, highlighting the importance of recovery of neurological function deficits and secondary prevention after cerebral infarction. Within the first month of onset, most patients with cerebral infarction receive regular treatment, rehabilitation, and care in the hospital, with effective health management methods. However, once discharged and returning to the community, patients lack effective secondary prevention supervision, especially as acute cerebral infarction patients are often elderly individuals with poor memory, lack of relevant knowledge, and financial constraints. In the ranking of the top health and wellness cities in China, Hainan Province overall ranked far behind other provinces. 2 In secondary prevention compared to urban patients, especially for those with acute cerebral infarction who have little access to transportation, financial resources, cultural education, and health consciousness, 3 the latter is associated with worse results for those who have had acute cerebral infarction. These factors lead to poor compliance post-discharge, delaying recovery and increasing the risk of recurrence, ultimately resulting in worse patient prognosis and quality of life. 4 Research has shown that both cerebral infarction and type 2 diabetes require long-term comprehensive treatment, including regular medication and lifestyle adjustments. Non-adherence to medical advice may result in poor disease control and complications. 5 Furthermore, numerous ischemic stroke patients fail to adequately prioritize their medication, which results in improper usage and dosing. This not only diminishes the preventive effects of the medication but also heightens the risk of stroke recurrence.6,7 Through analyzing patient medication adherence, recurrence rates, and the evaluation of whether patients follow medical advice and use medications correctly, the significance of preventing ischemic stroke is paramount.
Presently, people believe that community health stations cannot offer higher-quality health services than those of tertiary hospitals. And it discourages the activities at the grass roots level. Third parties can provide technical support for primary health care, for instance, offering support for house bound elderly people, especially. Although third-level hospitals provide much higher quality of health service compared with the first and second levels, the recent survey shows that elderly people's daily health management in villages lags behind standards from central institutions and their degree of satisfaction with basic community services is not high enough. 8 There is research from Jiangsu, Zhejiang, and Shanghai, which reveals insufficient staffing and service facilities will lead to inadequate quality of service. 9 Based on the Three Medical Linkage model, studies conclude that resource allocation inconsistency, deficiencies of frontline personnel's interests and enthusiasm, lack of insurance policies and access to medicines and drugs and lack of standards of digitalized systems are important challenges hindering progress. 10
The Healthy Initiative also emphasizes public health, which plays an important role in regional development; this study is mainly aimed at examining the effect of continuous medical service on health management in the acute cerebral infarction patients so as to improve the degree of people's awareness and the quality of care. 11 Effective health management can only be achieved by continuously controlling individual-level and population-level risk factors, 12 but previous studies point out that lack of continuous guidance can reduce the effect of health management later on. 13 Continuous medical services help the chronic risks to be controlled by taking personal measures and providing satisfactory communication to enhance adherence and treatment confidence.14,15 Studies have proved that CCM can greatly improve the medication adherence of PCI patients and lower their psychological anxiety after a procedure of PCI. 16 And here we focus on a part of the acute cerebral infarction patients in Hainan and desire to promote local peoples’ attentiveness about themselves.
In the first year after a cerebral infarction, it is the most critical period for the recovery of neurological symptoms; however, recurrence rates are high, affecting patient prognosis and quality of life.17,18 Stroke patients often suffer from various psychological symptoms, such as anxiety and depression, which affect patients’ adhesion to treatment and rehabilitation. 19 It has been reported that 1/3 of stroke survivors suffer from anxiety and/or depression, affecting the outcome of their rehabilitation and reducing their quality of life.20,21 Psychological intervention for patients suffering from psychological trauma is significant as post-stroke psychological trauma may affect the long-term prognosis while psychological intervention improves not only emotional status but also recovery.22,23 Traditional continuous medical care model was mostly doctor-nurse model. Under this model, doctors rarely get involved in the service offering, which may limit the service quality of the traditional continuous medical care model.24,25 While nurse-led models have shown positive effects in dealing with chronic diseases such as diabetes and hypertension,26,27 the patient's requirements today demand an extensive scope of services. Multidisciplinary teams (MDTs) centred around the family physician supplemented by pharmacists, rehab therapists, and counselors have emerged as the preferred way of providing comprehensive patient-care. 28 In response to the patient follow-up need for acutely cerebral infarcted patients, our hospital has established a stroke follow-up office. Although the existing follow-up mode for discharged patients has enough reference, this traditional way still has deficiencies in terms of validation. 29 The role of Artificial intelligence provides greater opportunities for follow-up in clinical settings, especially through AI-based voice systems for streamlined improvements in clinical follow-up processes.30,31
The main contributions of this study consist in focusing upon the following three aspects: AIS specific validation and selection of significant features: A scientific approach was used to validate specific significant health features which had an effect on the prediction of the relapse risk in acute ischemic stroke patients. The authors systematically evaluated the health features to make sure that the models used in this paper have valid and accurate inputs to establish a reliable predicting model. The development of the Relapse Prediction Model: This paper proposes the Significant Factor Neural Network Relapse (SFNNR) Prediction Model, which makes full use of the important factors listed above and learns the temporal relations in patients’ health data to obtain the relapse risk probability of the patient after discharge. The ability to capture the long-term dependency provides the model with the possibility of predicting the accurate and personalized health management plan for each patient and improving the prediction accuracy. The evaluation of the impact of Continuous Medical Service on health management of AIS patients: After comparison of the control group and the observation group of the post-discharge of the AIS patient, it was found that the continuous medical service had an obvious positive effect in improving the degree of medicine adherence, controlling the chronic health risks, and reducing the relapse rate.
The latest innovations provide fresh views and solutions on how to handle the health issues of these individuals suffering from acute ischemic stroke in order to predict their disease more precisely and help them have better recovery and health maintenance in the future.
The remaining content is structured as follows Chapter II outlines the SFNNR model framework and its computational techniques; Chapter III elaborates on the research data and sample selection process; Chapter IV analyzes the results obtained from the model; Chapter V offers a comprehensive discussion of these results, while Chapter VI concludes with a summary of the findings and recommendations for future research directions.
SFNNR model framework
As displayed in Figure 1, our framework divides the predictive model used to determine relapse from sensitive factors into two stages. Stage 1: Significant Factor Validation

Overall framework of significant factor neural network relapse (SFNNR) prediction.
In this phase, various patient-specific inputs, including blood pressure, blood glucose level, and the degree of compliance with medication taking, will be validated. These variables are all potential factors contributing to a higher risk of relapse for the patients, so after the validation process, these inputs should reflect real data from the patients. Only after validation is passed can they be passed into the model. Stage 2: Scientific Relapse Prediction
The validated information is passed into the model for relapse prediction, which uses time-series data and works out the relationship between the health state from previous years and future relapse occurrence. A processing layer consists of gates like the forget gate, the input gate and the output gate to control how the information will be stored in and moved through the network, producing the relapse period or prediction. It will show if relapse might happen considering the history of the patient's health situation.
Paired sample T-test for BP and FBG
The paired sample t-test compares the means of two related groups, typically involving repeated measures on the same subjects at different time points (e.g., admission and one year after discharge). The following characteristics are chosen from the following order: it is presumed that the differences between paired observations are normally distributed and that they are based on ideas such as the sampling distribution of the mean difference, standard error, and t-distribution under the null hypothesis.
Mean of differences is the basic statistic for various individuals, given as follows:

By using this formula, the average difference between the paired observations is calculated.
Hence, the difference variance is calculated by:

Using the difference between the paired values, which is used to determine the standard deviation of the differences, this formula calculates the variance of the difference. In addition, the mean difference's standard error was first described:

The mean difference variability is measured by the standard error. This term is used in the paired sample t-test formula to calculate the t-statistic.
For comparing two independent groups (e.g., control group vs. observation group) in terms of MMAS-8 scores, the independent sample t-test formula is expanded with additional related concepts. Standard error of the difference of means is defined by:
The typical error of the difference between the means shows how much variability there is between the two group's means.
Thus, the Degrees of freedom can be obtained:

The t-distribution is used to calculate the important value according to the degree of freedom, which is dependent on the sample size. The T-statistic for the independent T-test, from the variables listed above, can be obtained by:

For assessing the differences in nicotine dependence before and after the intervention using the Wilcoxon signed-rank test, we further expand the understanding of the test. Firstly, the rank of absolute differences is given by:


The amount of difference that is taken into account when accounting for the direction of change is measured by this figure. Hereby, the P-value for the wilcoxon signed-Rank test is given as follows:

To analyze the recurrence rate of cerebral infarction, we apply the Chi-square test to categorical data. Expected frequencies are result for table
Under the null hypothesis there is assumed to be no association between variables and the chi-square statistic can be derived as such:
Degree of freedom determine the distribution used to analyze the significance of the test statistic.
The Sensitive Factor Controlled Relapse Prediction Model to predict whether acute ischemic stroke (AIS) patients will relapse within 12 months after discharge. The core idea of this method is to use historical health data, such as blood sugar levels, blood pressure, smoking status, and medication adherence, to learn potential patterns of relapse, and subsequently predict the probability of future relapse. The main advantage of time serial networks in this task is their ability to effectively process time-series data and capture long-term dependencies.
When training typical RNNs on long sequences, the SFNNR Prediction Model is intended to solve the vanishing gradient problem, which is a typical problem. The model does this by adding a set of gating methods, which control what information is kept and what is forgotten, guaranteeing that the model can capture long-term dependencies effectively.
Calculations and Design of proposed model
The three gates—forget gate, input gate and output gate—are responsible for the main computations in the SFNNR Prediction Model. The model can modify itself using these three gates so that it can learn about long-term dependencies in its input sequence by constantly updating its own internal memory.
Forget Gate (

Input Gate (

Cell Candidate (

Cell State Update (

Output Gate (

Final Output (

In our approach, as a result of the use of a Sigmoid function in the output layer of the designed network to produce outputs in the range from zero to one, it denotes the chance of the relapse that can be witnessed. Mathematically, the output layer equation reads as:

To make sure the network performs better when being trained, binary cross-entropy loss function is adopted in this process, which is the traditional loss function in binary classification work:

During optimization, we use Adam optimizer, which is one of the most commonly adopted methods; as a result, it merges together the good properties from both momentum and adaptation rate and also shows strong effectiveness and stability in training the deep-learning model.
Study subjects
Among the acute cerebral infarction patients admitted to our Neurology Department from January 1, 2022, to December 31, 2023, a total of 443 cases were selected as the study subjects. These selected patients all underwent intravascular treatment. After admission dates were ordered, 220 of the cases that were admitted between January 1, 2022, and December 31, 2022; of these, 223 cases that were hospitalized between January 1, 2023, and December 31, 2023; of these, the observation group was assigned to the observation groups. Using a historical control method, the control group received relevant health education on cerebral infarction disease prior to discharge, while the observation group received continuous medical services at 3 months, 6 months, and 9 months post-discharge on top of the control group's standard care. A comparison was made between the two groups in terms of blood pressure, blood sugar levels, medication adherence, recurrence of symptoms, and nicotine dependence before and after the one-year intervention following discharge.
Inclusion criteria and exclusion criteria
Patients eligible for inclusion in this study must meet the diagnostic criteria outlined in the “Guidelines for the Diagnosis and Treatment of Acute Ischemic Stroke in China 2023” and have been confirmed through head CT or MRI. The participants should be local residents of Hainan, having been born and lived there for an extended period. Furthermore, the patient must be fully conscious, at least 18 years old, and have a designated family member available for caregiving. The caregiver should be mentally and behaviorally stable, without any communication or comprehension barriers, and must be willing to participate in follow-up via telephone or face-to-face interviews. Both the patient and/or their family members should voluntarily consent to participate in the study, and the clinical data must be complete.
Patients were excluded if they had severe liver or kidney dysfunction, significant arrhythmia, heart failure, myocardial infarction, malignant tumors, or other severe health conditions. Additionally, those with severe cognitive impairment or a history of dementia or mental illness were excluded. Participants who were excluded included those lost to follow-up, those with incomplete data, and those who requested to withdraw. The main endpoint events were repeated ischemic stroke or death unrelated to recurrent stroke, which were mainly related to continuous medical services.
Sample size and data
After excluding one participant who died from causes unrelated to recurrent ischemic stroke and three cases that were lost to follow-up, the final sample comprised 218 participants in the control group and 221 in the observation group. There were no notable differences in baseline characteristics observed between the two groups (P < 0.05). Since the timelines of the two groups did not overlap, there were no issues with contamination. The hospital's ethics committee granted approval for this study.
The research team comprised of seven people, including 3 neurologists (2 associate professors and 1 professor), 1 health manager, 1 psychological counselor, and 2 head nurses. The neurologists diagnosed patients, offered medical treatment advice as well as suggestions for them to maintain their good mood and regular diet and exercise, while the health manager collected and analyzed information and the psychological counselor offered comfort to the patients. Certified as “Rehabilitation Nursing Specialty,” the nurses managed the admission and discharge procedures of patients as well as their post-discharge rehabilitation and teaching work. They made personalized nursing plans according to each patient's situation and changed interventions after feedback from families.
Conventional medical services were given to the control group, whereas the observation group was given continuity of medical care in addition to conventional care.
In the conventional medical service model, upon admission, nurses recorded patient details such as name, gender, education level, contact information, date of birth, residence, medical and surgical history. Blood pressure, blood glucose (random blood glucose on admission and fasting blood glucose for diabetic patients), and scale scores were also recorded. Nurses provided health education on cerebral infarction, addressed patient and family questions, and emphasized self-management after endovascular treatment. Patients were told to attend frequent follow-up appointments after discharge.
As part of the continuity of medical service model, each patient received a personalized health management plan before discharge, covering medication, nursing, diet, exercise, and psychological support. Follow-up services were conducted at 3, 6, and 9 months post-discharge via telephone or outpatient visits. When direct contact with the patient was not feasible, information was obtained from family members. The follow-up included consistent content and procedures tailored to the patient's ongoing health needs. Understand whether the patient is taking medications such as antihypertensive drugs, antidiabetic drugs, secondary prevention drugs for stroke, etc., adhering to the prescribed regimen since the last follow-up; if not, find out the reason why they do not take them, give them solutions, judge their compliance degree based on the scale, and ask whether they still monitor their blood pressure and blood sugar regularly. Record the current measured blood pressure value and fasting blood glucose value. Ask about the improvement of the patient's symptoms after last follow-up; check if there is recovery of the neurological deficit symptoms (limb paralysis, language function, swallowing, dizziness), whether the BP, blood sugar are normal, if the patient has any recurrence of stroke. Evaluate the dependence on nicotine of the cigarette smoker by means of the administration of a nicotine dependence test scale and registering the score. The focus of health coaching is on following instructions concerning prescription drugs and correcting unhealthy habits like quitting smoking and drinking less alcohol. Dietary guidance is given to families too; it helps them prepare healthy meals, full of fresh fruits and vegetables, and avoiding foods with salt and fat. For those living with diabetes it means strictly following diabetes meal planning. If someone has suffered from an ischemic stroke that left him or her paralyzed and/or with aphasia (inability to speak), rehabilitation exercises will be introduced, which include range of motion exercise, balance training, breathing exercise, and walking. In this part we recommend 1∼2 h per day. Regarding mental health concerns, direct communication is the first choice to assess people's state of mind when talking with them or their families. When someone is emotionally vulnerable, we offer early support as soon as possible to assist in coping and recovery. People can still socialize and have an active attitude. Caregivers should be vigilant about the changes of the individual's mental wellbeing and prompt help from experts to prevent adverse events from taking place.
Compare blood pressure, blood glucose control, and recurrence rates between the two groups at baseline and one year after discharge. Smoking status was also evaluated individuals who had stopped smoking were classified accordingly, while current smokers were assessed for nicotine dependence using the Fagerström Test for Nicotine Dependence(FTND), which scores range from 0 to 10—where 0 to 3 indicates low dependence, 4 to 6 signifies moderate dependence, and 7 to 10 represents high dependence. Additionally, medication adherence was assessed using the 8-item Morisky Medication Adherence Scale (MMAS-8), with scores below 6 indicating poor adherence, scores ranging from 6 to 7 indicating moderate adherence, and a score of 8 signifying good adherence.
Data were analyzed using SPSS 25. Continuous variables were described using means standard deviations, and categorical variables were presented. Comparison of blood pressure and fasting blood glucose control 1 year after discharge between the two groups was performed using paired sample t-tests. Medication adherence at 1 year was compared using independent sample t-tests, while nicotine dependence was evaluated using the Wilcoxon signed-rank test. The chi-square test was used to compare the recurrence rates within 12 months of discharge, and the P < 0.05 was used as the significant level.
Results
Scientific variable selection for significant factors
One-year comparison of blood pressure control between two groups
A paired-sample t-test was performed to assess the differences in blood pressure levels before and after the intervention in both groups. The results showed no significant changes in either systolic or diastolic blood pressure in the control group between admission and one year after discharge (P > 0.05). In contrast, the observation group showed statistically significant reductions in both systolic and diastolic blood pressure (P < 0.05), indicating the usefulness of continuous medical services.
The mean of the systolic blood pressure in the control group in Table 1 was 153.38 mmHg (s1 = 22.61). at admission and 150.28 mmHg (s2 = 17.25). The difference Δ = 153.38–150.28 = 3.10 mmHg. The pooled standard deviation was calculated as
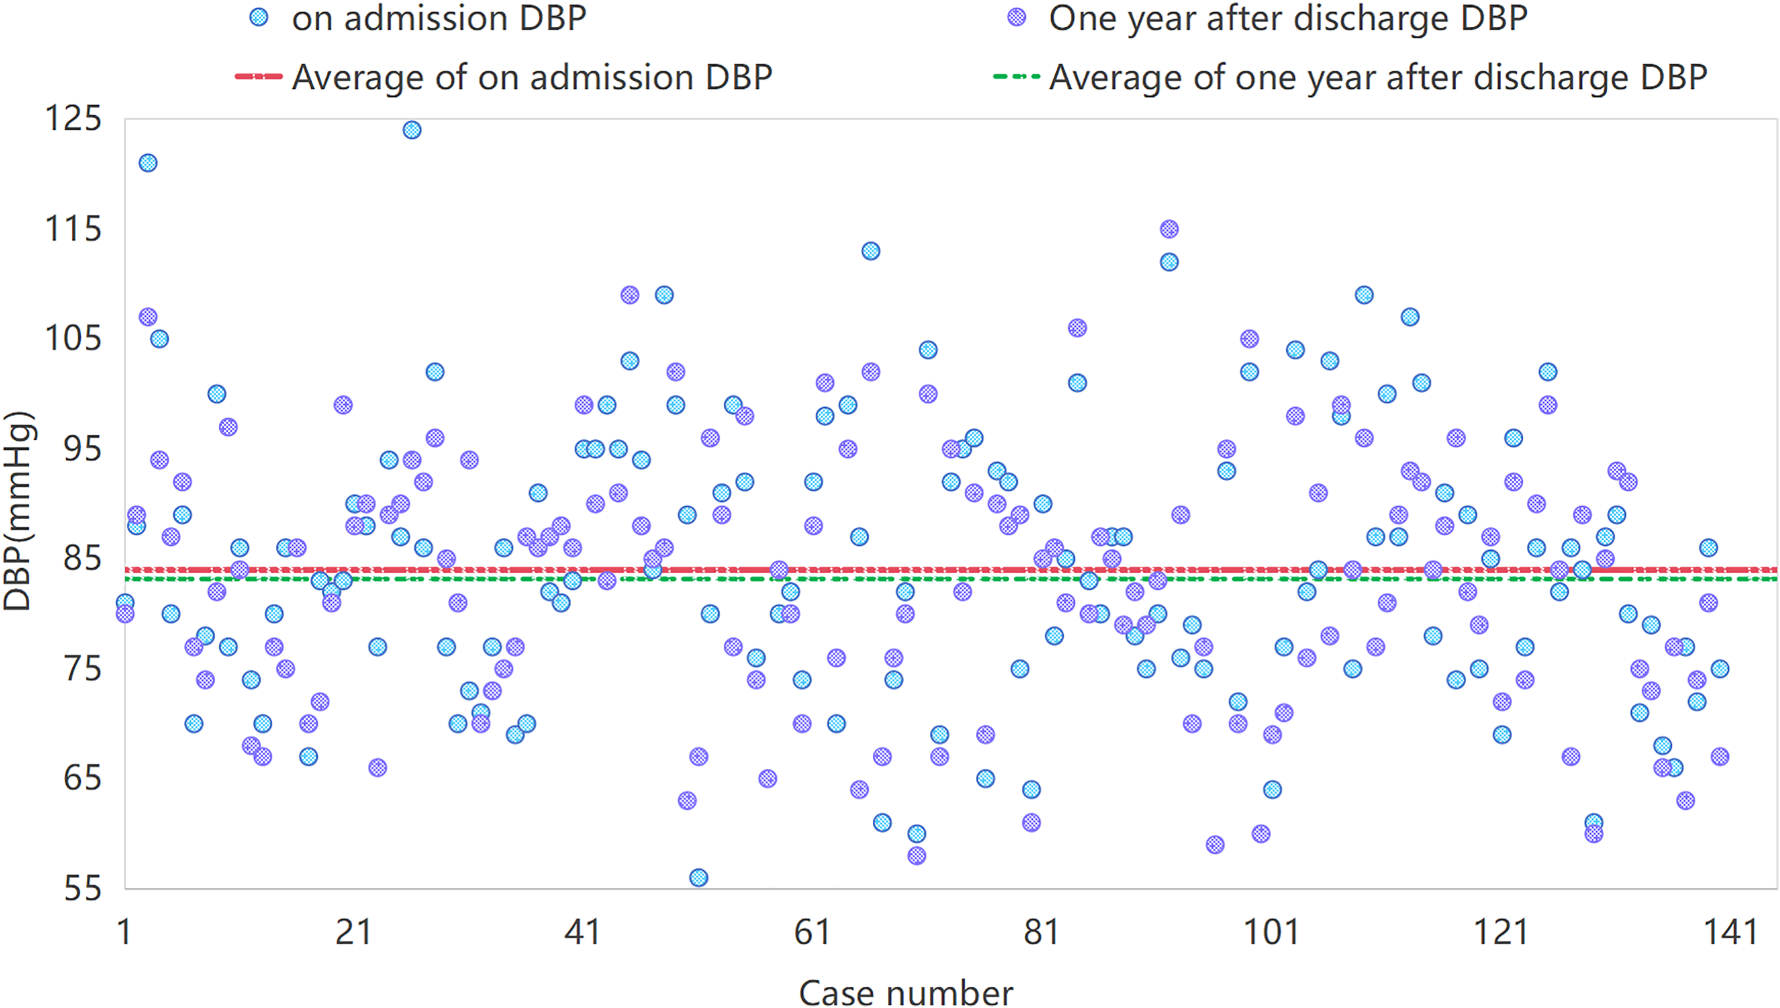
Diastolic blood pressure (DBP) for control group at admission and one year after discharge.
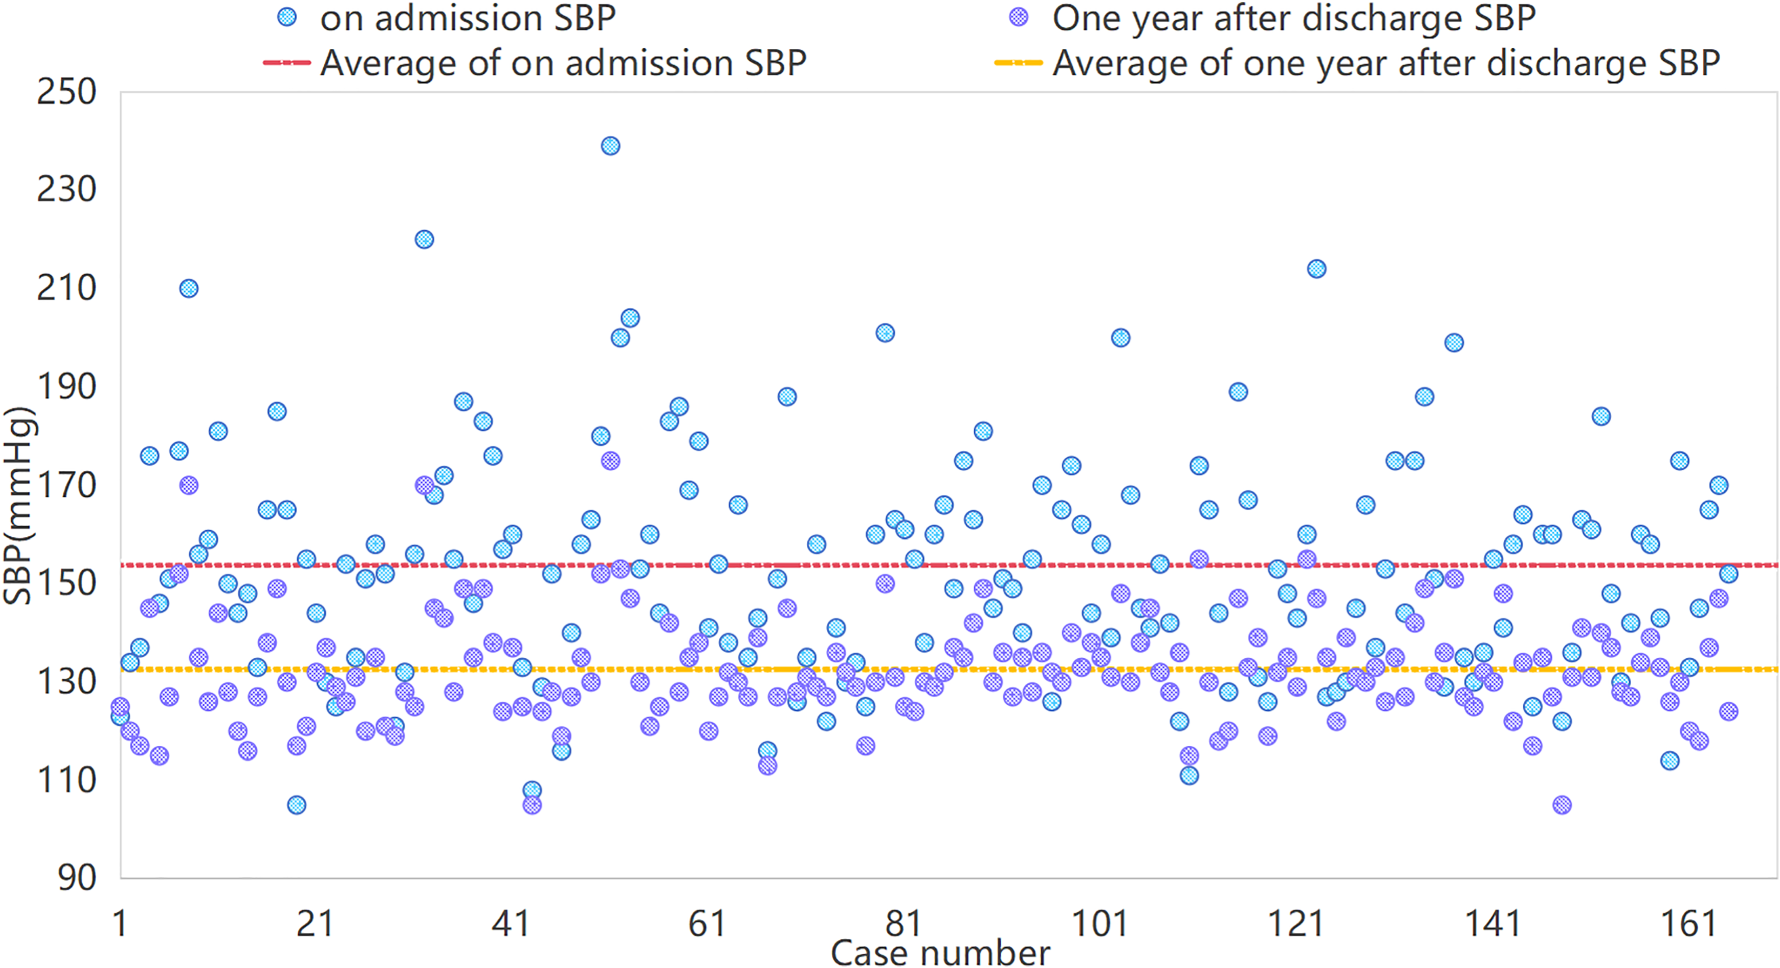
Systolic blood pressure (SBP) for observation group upon admission and one year after discharge.
Comparison of blood pressure levels and effect size before and after intervention in both groups. (mmHg)
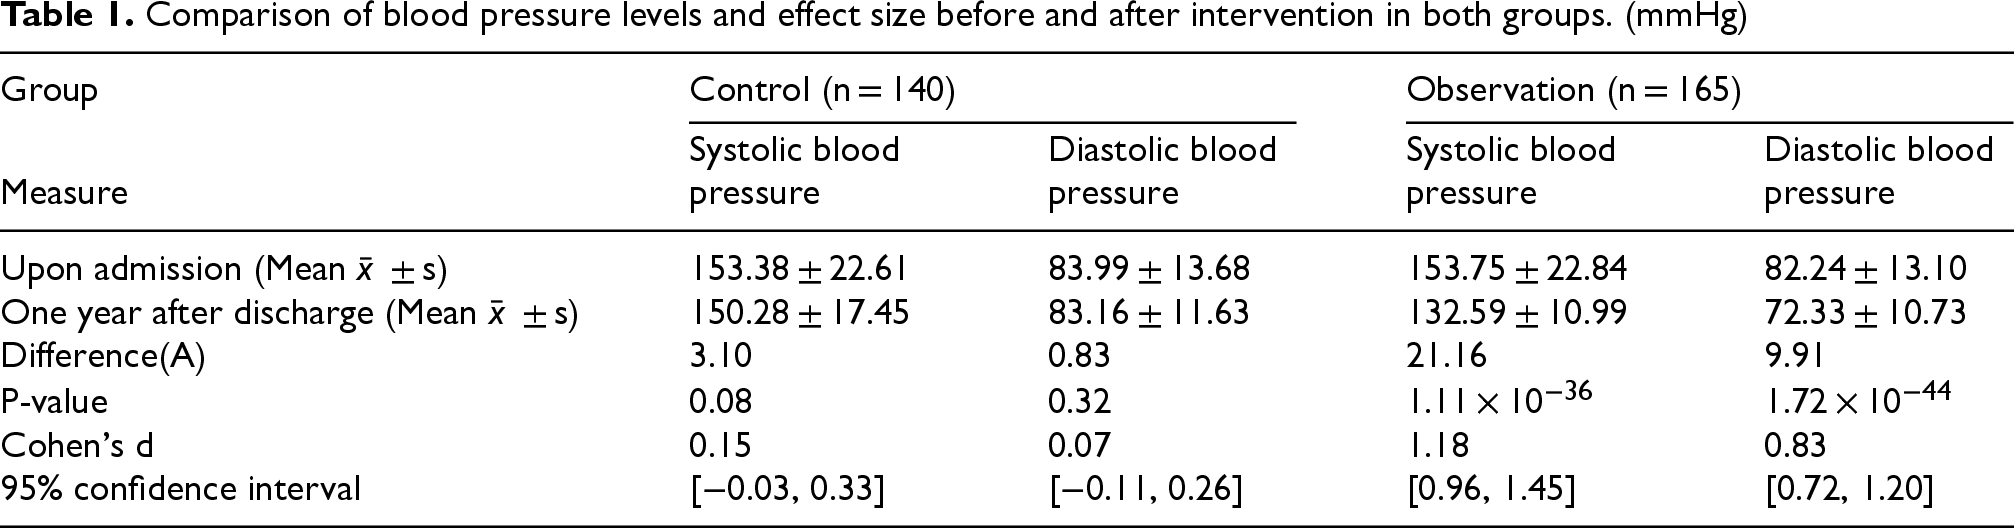
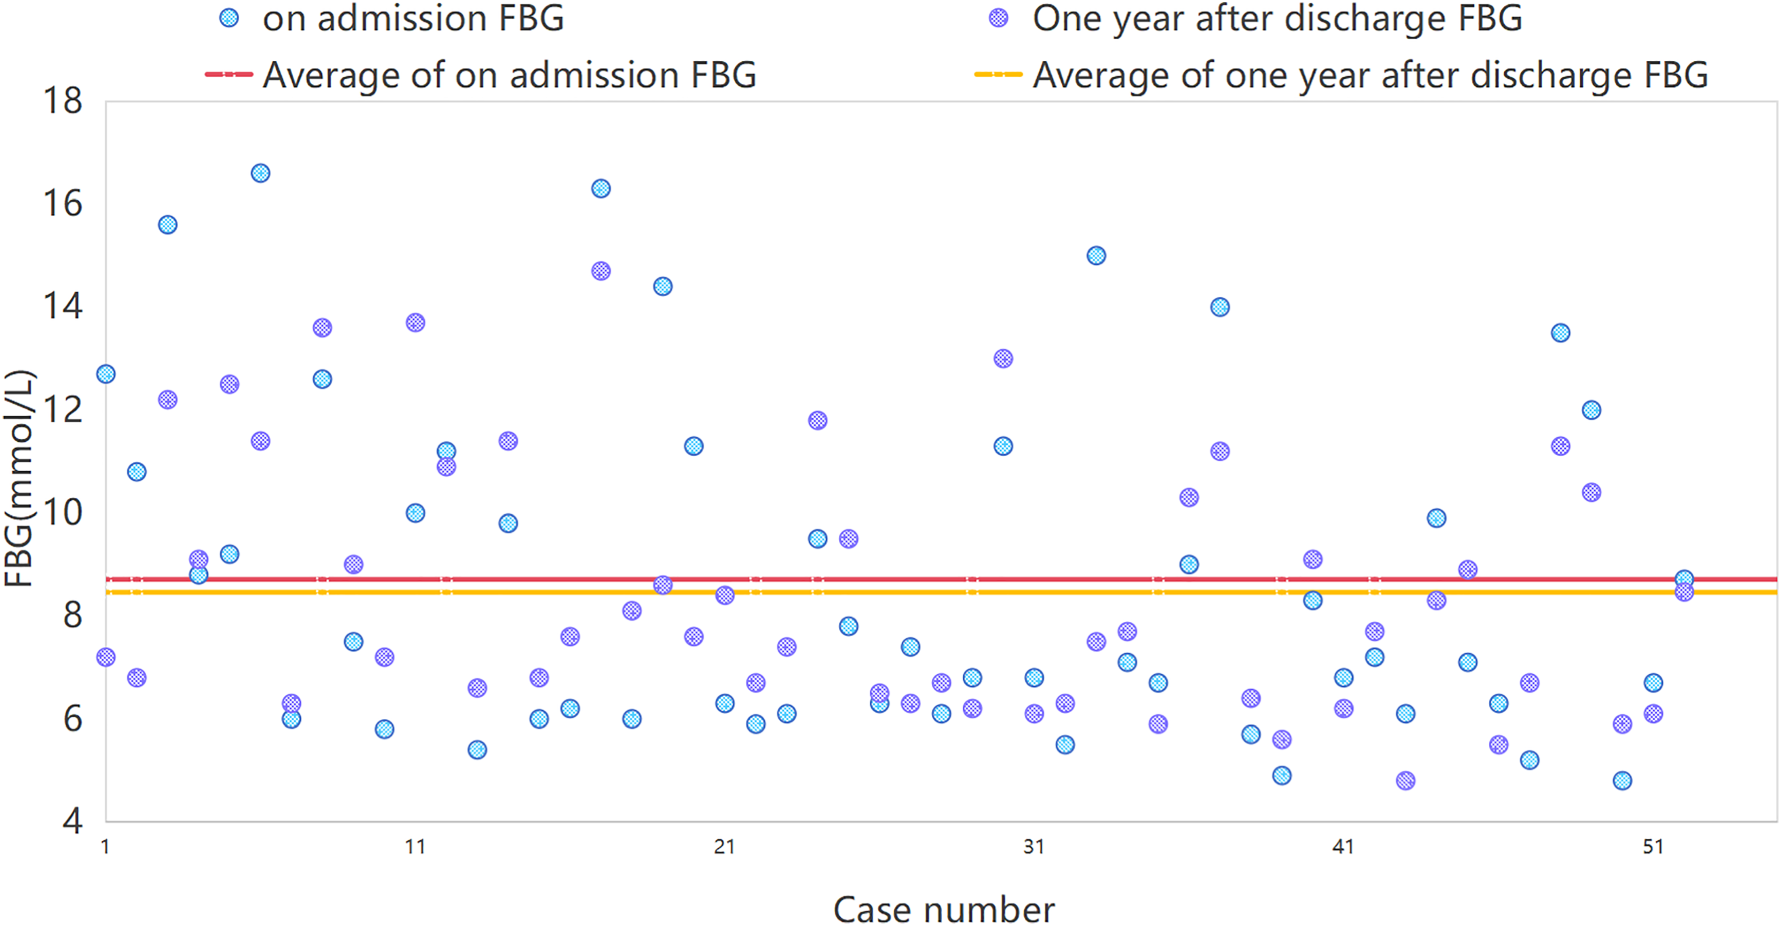
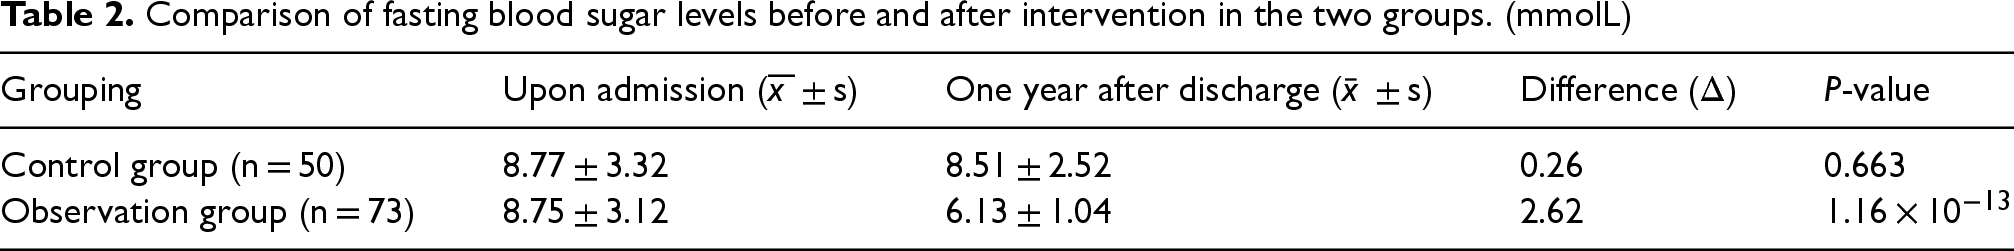
Table 2 presents a comparison of fasting blood glucose levels in the control and observation groups before and after intervention (i.e., upon admission and one year after discharge). The control group showed a P-value of 0.663, which shows that there was no statistically significant difference in the amount of glucose in fasting blood between the admission and a year following discharge (P > 0.05). From this, we can see that after the intervention, there was no obvious change of fasting blood glucose level in the control group. In the observation group, the P-value was 1.16 × 10⁻¹³, which indicates a statistically significant difference in fasting blood glucose levels from admission to one year post-discharge (P < 0.05). This suggests that there was a notable reduction in fasting blood glucose levels in the observation group as a result of the intervention. Figures 4 and 5 indicate that the fasting blood glucose levels upon admission were comparable between the control and observation groups; however, the blood glucose control results one year after discharge showed a significant difference. The observation group demonstrated a notable reduction in blood glucose levels, whereas the control group displayed no significant change. The data indicates that there was a positive effect of the intervention in the observation group on the regulation of fasting BP.
Fasting blood glucose (FBG) for the control group upon admission and one year after discharge.

Fasting blood glucose (FBG) for the observation group upon admission and one year after discharge.
Comparison of fasting blood sugar levels before and after intervention in the two groups. (mmolL)
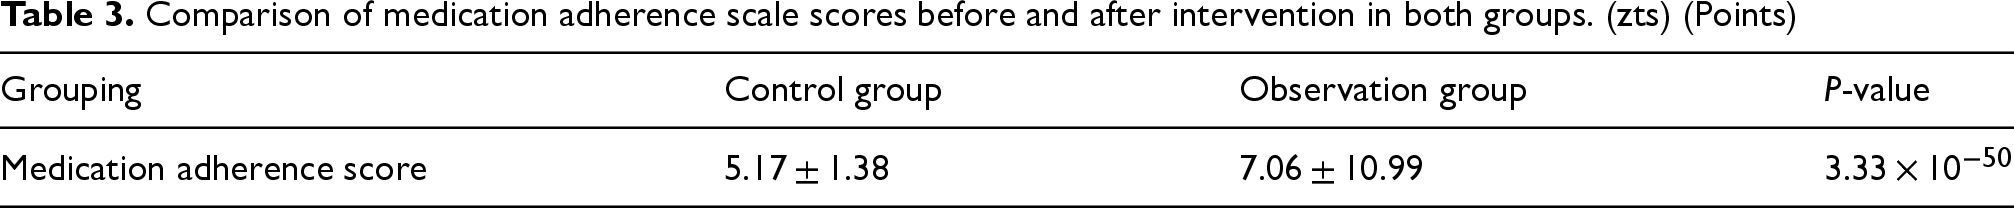
Patients who use medication on a timely basis and in the appropriate amount as directed by their doctors are referred to as medication adherence. The control group comprised 218 patients, whereas the observation group included 221 patients. The mean drug adherence score in the control group was 5.17, with a degree of variability indicated by a standard deviation of 1.38, as Table 3 illustrates. In contrast, the observation group had a higher average score of 7.06, but with a relatively large standard deviation, suggesting greater variability and possible individual differences within the group. The P-value was 3.33 × 10−50, indicating a significant difference between the two groups. Figure 6 shows that the observation group had a higher adhesion than the observation, which shows that care continuity increases the adherence to drugs.
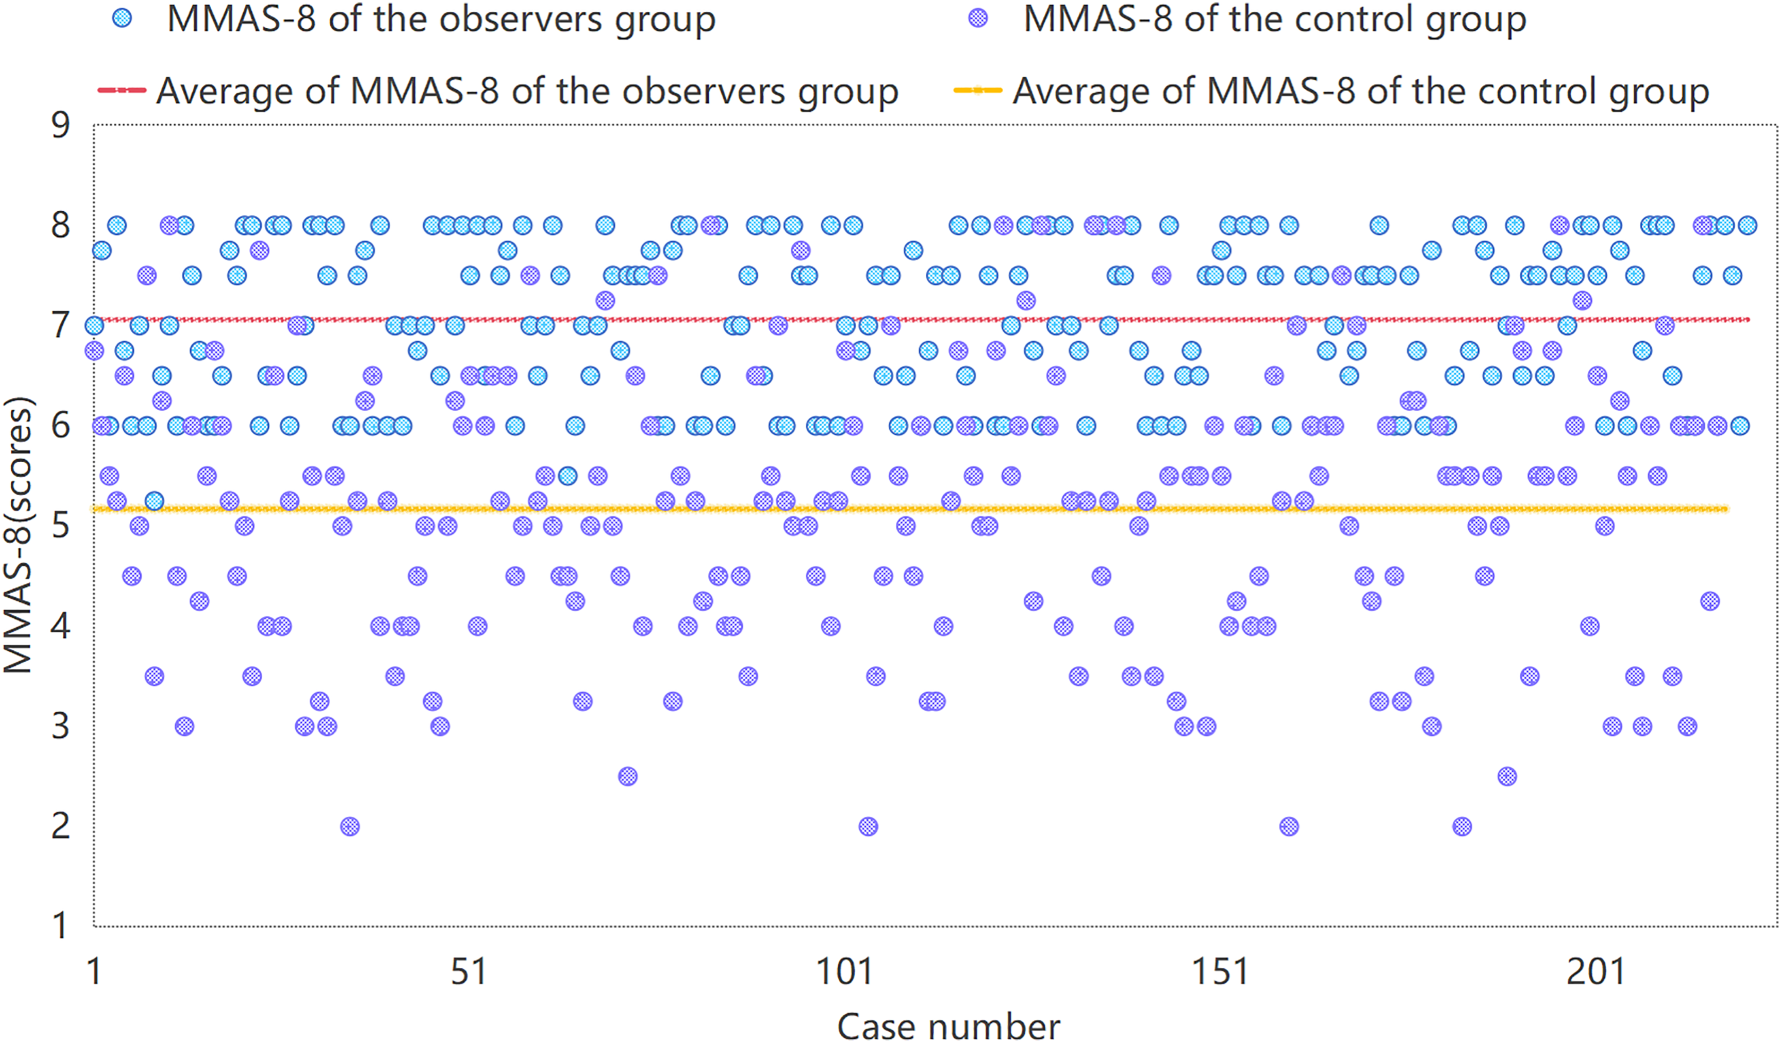
shows the MMAS-8 for the observation group and the control group one year following discharge.
Comparison of medication adherence scale scores before and after intervention in both groups. (zts) (Points)
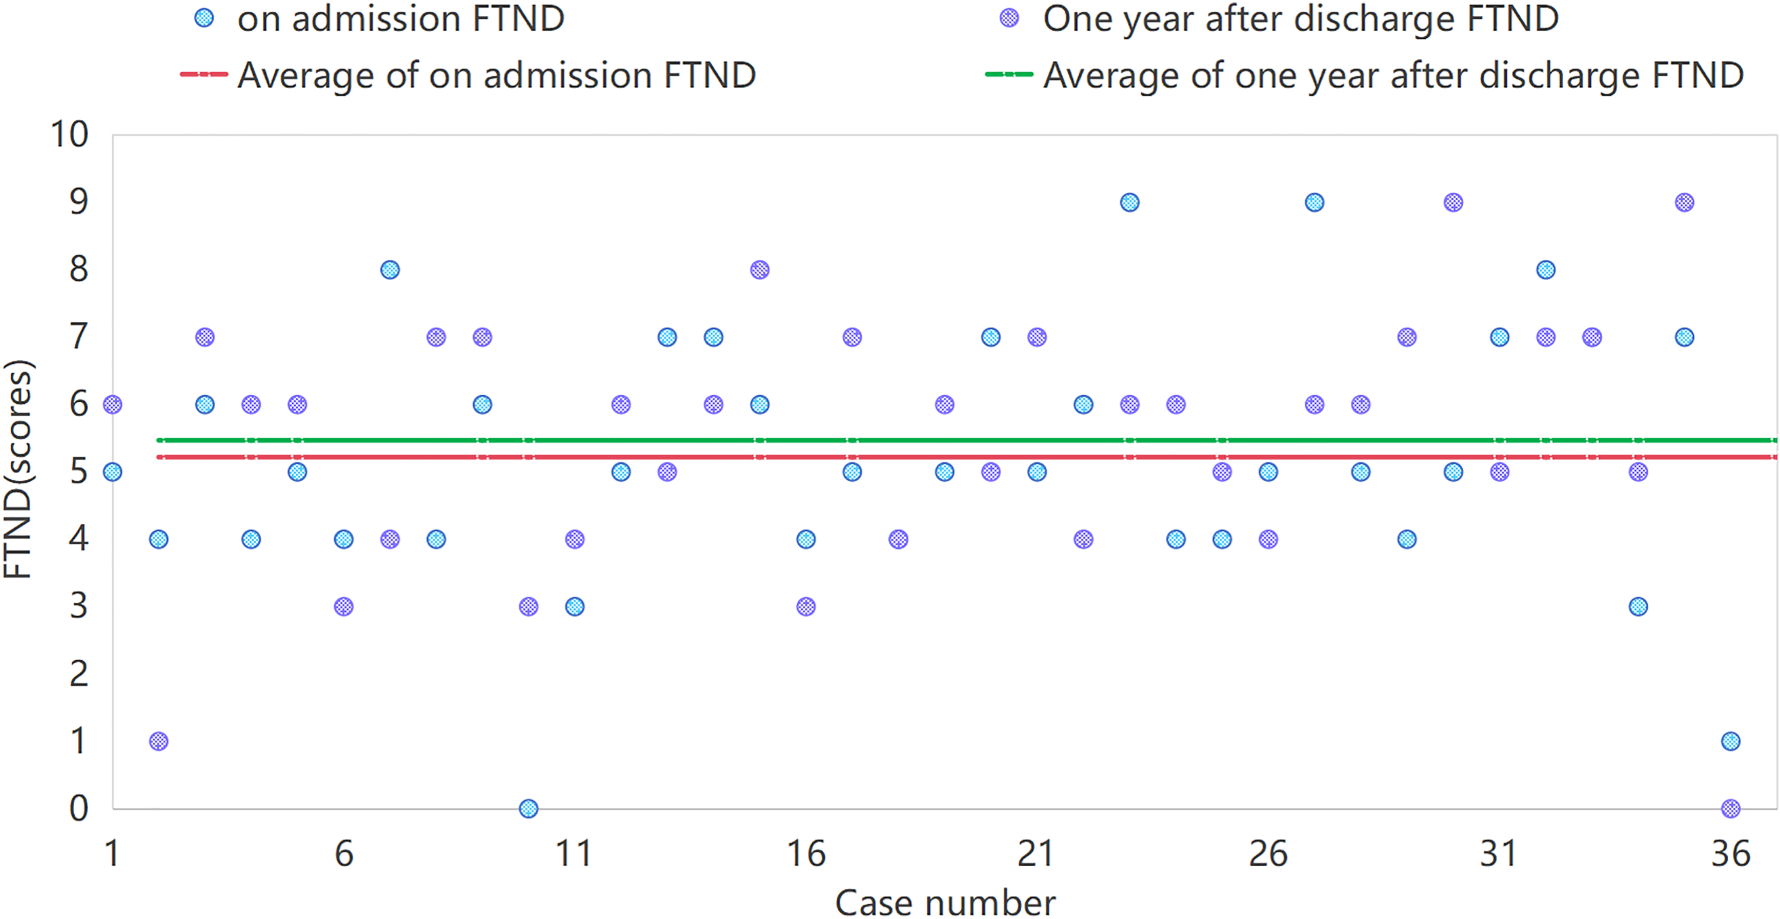
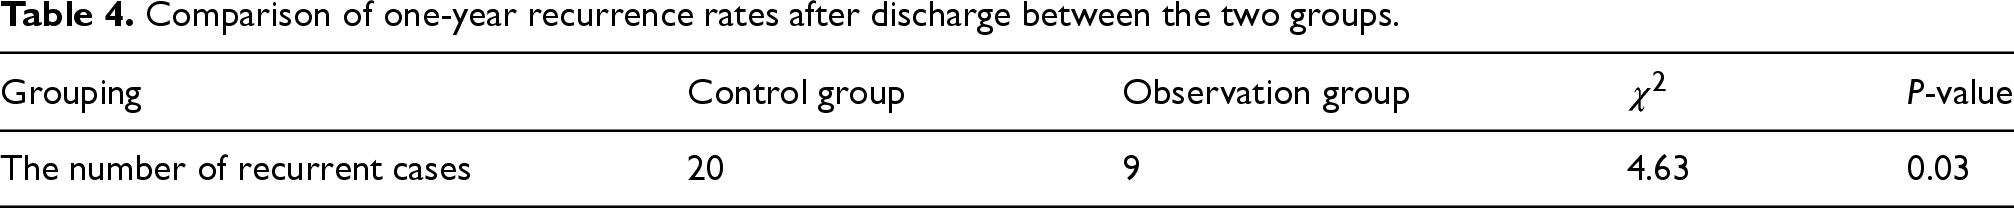
One year after discharge, the smoking cessation rate in the control group was 12.20%, with 5 out of 36 samples successfully quitting smoking. In comparison, the smoking cessation rate in the observation group was 31.58%, as 18 out of 39 participants successfully quit. This indicates that the observation group had a significantly higher smoking cessation rate than the control group, validating the advantage of the observation group's smoking cessation intervention. In Table 4, the nicotine dependence of smokers who did not quit was analyzed using the Wilcoxon signed-rank test. In comparison to the admission of the control group, the test statistic was-0.76, with a P-value of 0.45, which indicates that there was no discernible change in the nicotine dependence scores one year after discharge. This may be because the control group did not receive any particular help from the smoking cessation or intervention. In the observation group, the test statistic was −4.64, with a P-value of 0.000003, indicating a significant reduction in nicotine dependence scores after receiving continuity of care. The smoking cessation effect one year after discharge was much better in the observation group. This indicates that the intervention significantly influenced the reduction of nicotine dependence within the observation group. Figure 7 reflects changes in nicotine dependence among smokers who did not quit in the observation group, showing a reduction in dependence. Figure 8 shows that there was no notable improvement in nicotine dependence within the control group. Consequently, maintaining continuity of care positively influences smoking cessation, with the intervention in the observation group demonstrating significantly greater effectiveness compared to the control group.

FTND in non-quitting smokers of the observation group one year after discharge.
FTND for non-quitting smokers in the control group one year after discharge.
Comparison of one-year recurrence rates after discharge between the two groups.
Input-output definition and hyperparameter setting
To predict the possibility of a stroke patient suffering from recurrence of an acute ischemic stroke (AIS) after leaving the hospital, which reflects in the patients follow-up records. Construction includes pre-processing of information, designing data input and output, constructing LSTM model, selecting appropriate hyperparameters.
The beginning step of the architecture involves transforming the raw materials. Numeric attributes such as blood glucose, blood pressure, or how well people comply with their prescription need to be preprocessed and standardized, since the algorithm learns most efficiently when all input features average to 0 and have a standard deviation of 1.
The chosen variables for this model play a key role in the task of predicting the likelihood of patients to relapse later, including whether they smoke (0 or 1), blood sugar level (standardized), blood pressure level (standardized), and medication adherence score (standardized). Thus, only one time point per subject is needed when inputting the information to the model.
The target was dichotomized into two classes with values of 1 representing that the patient did not relapse during the next 12 months and 0 representing that he/she relapsed.
Hyperparameter and optimizer setting
The model includes a layer featuring 50 LSTM units with ReLU activation. The goal of the layer is to determine how long the factors have to be dependent on one another. The output layer uses the Sigmoid activation function to produce a value between 0 and 1, which represents the likelihood of relapse. Since this is a binary classification job, the Sigmoid function is suitable.
The learning rate was set at 0.001, which is why the small learning rate guarantees training stability.
The batch size is configured at 32, achieving a balance between training efficiency and memory utilization.
To determine the difference between the true and predicted labels, we use the binary cross-entropy loss function. The Adam optimizer is selected due to its efficiency and adaptive learning rates, which enable the model to converge more quickly.
The model is trained through backpropagation, which is used to adjust the weights in the network. By reducing the binary cross-entropy loss, the model learns to forecast the likelihood of relapse. Validation data is utilized during training to track the model's performance and mitigate overfitting.
The train and validation report of SFNNR prediction
The likelihood of relapse in patients using health-related data of blood pressure, blood sugar, and medication adherence is shown in Figures 9 and 10. The model was trained over 300 epochs with training and validation datasets, which were processed and standardized before being fed into the model.
The train and validation report of SFNNR prediction (case 1:80% train and 20% validation).
The train and validation report of SFNNR prediction (case 2: 70% train and 30% validation).
The training and validation processes were carried out using PyTorch, with the model being trained using the binary cross-entropy loss function and the Adam optimizer. (FC) To output the probability of a recurrence, the LSTM model architecture was made up of an LSTM layer, which was followed by a fully connected (FC) layer and a sigmoid activation function.
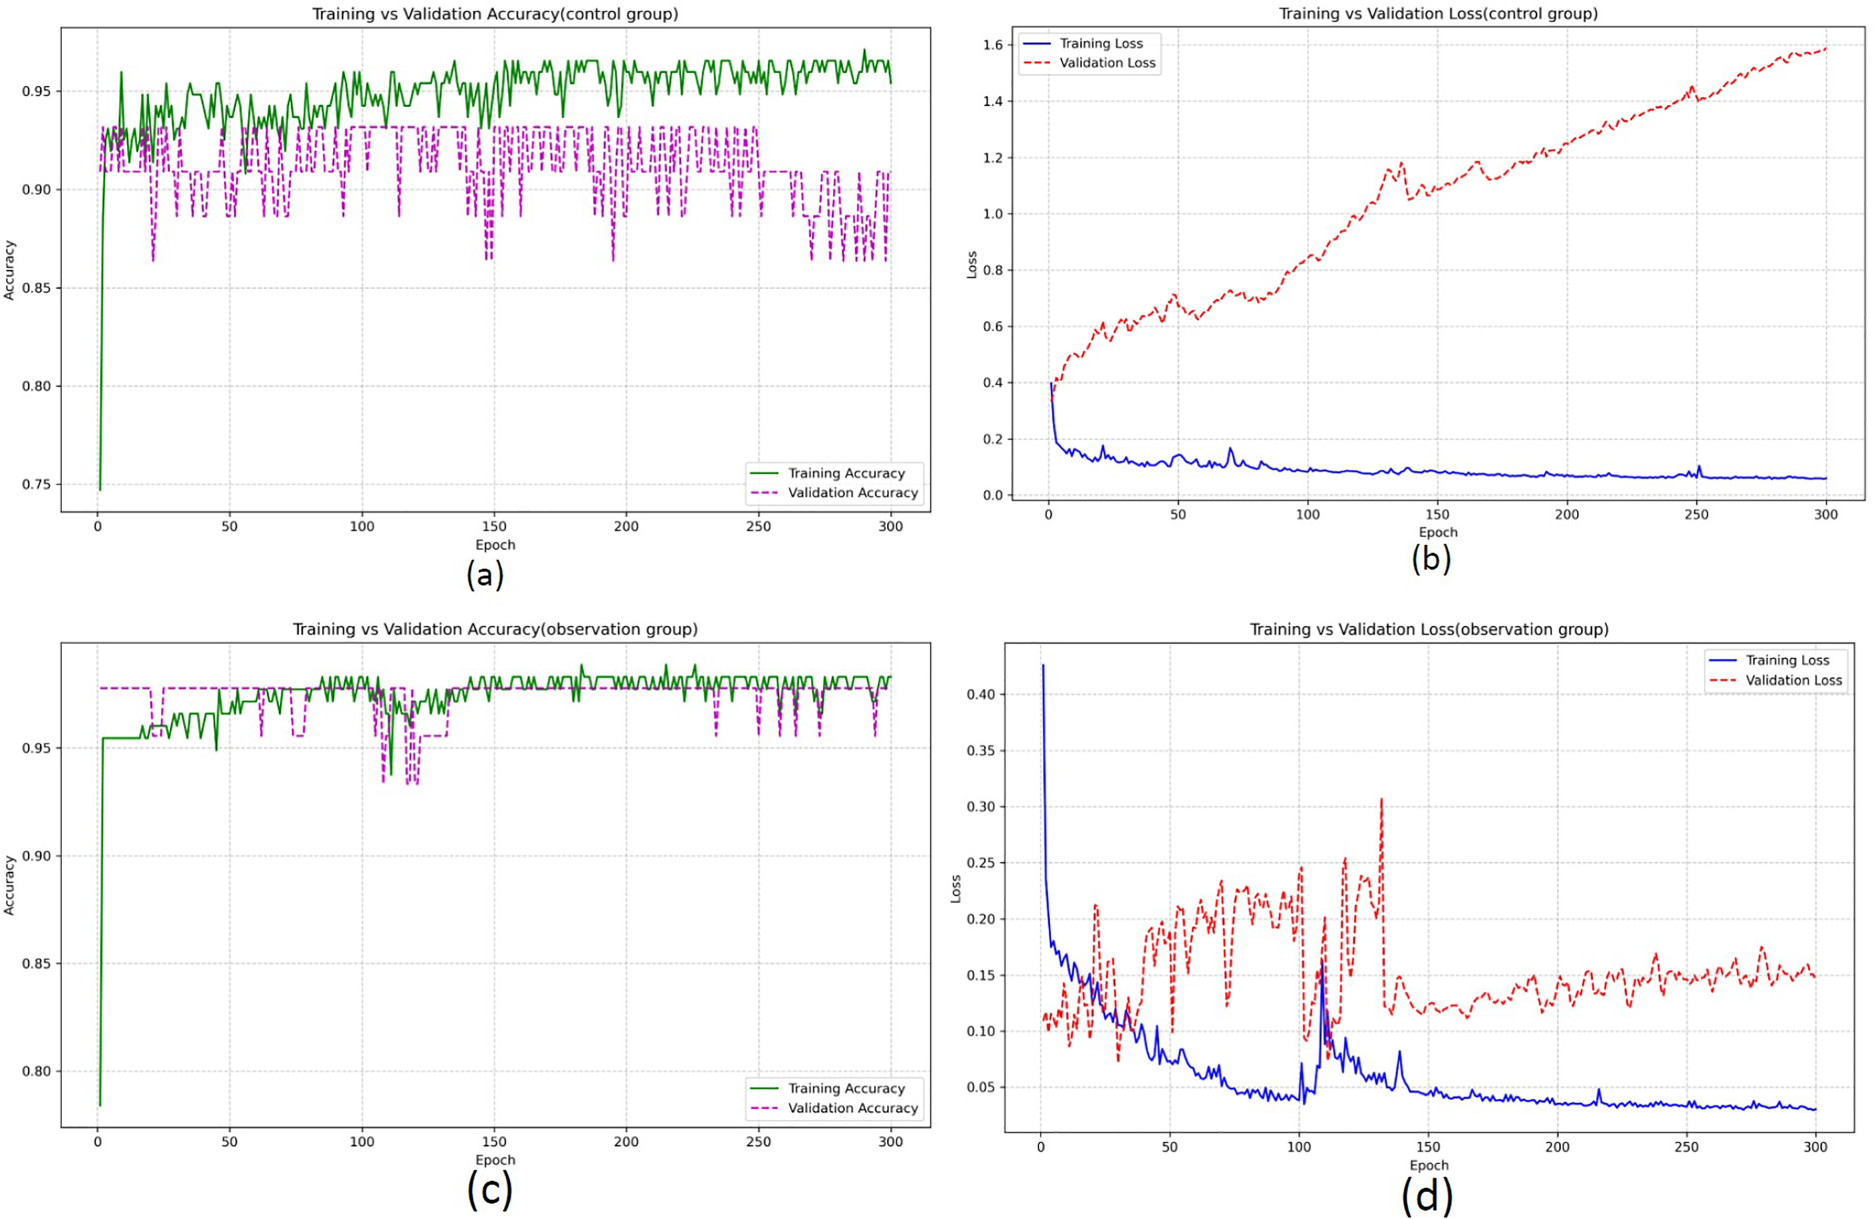
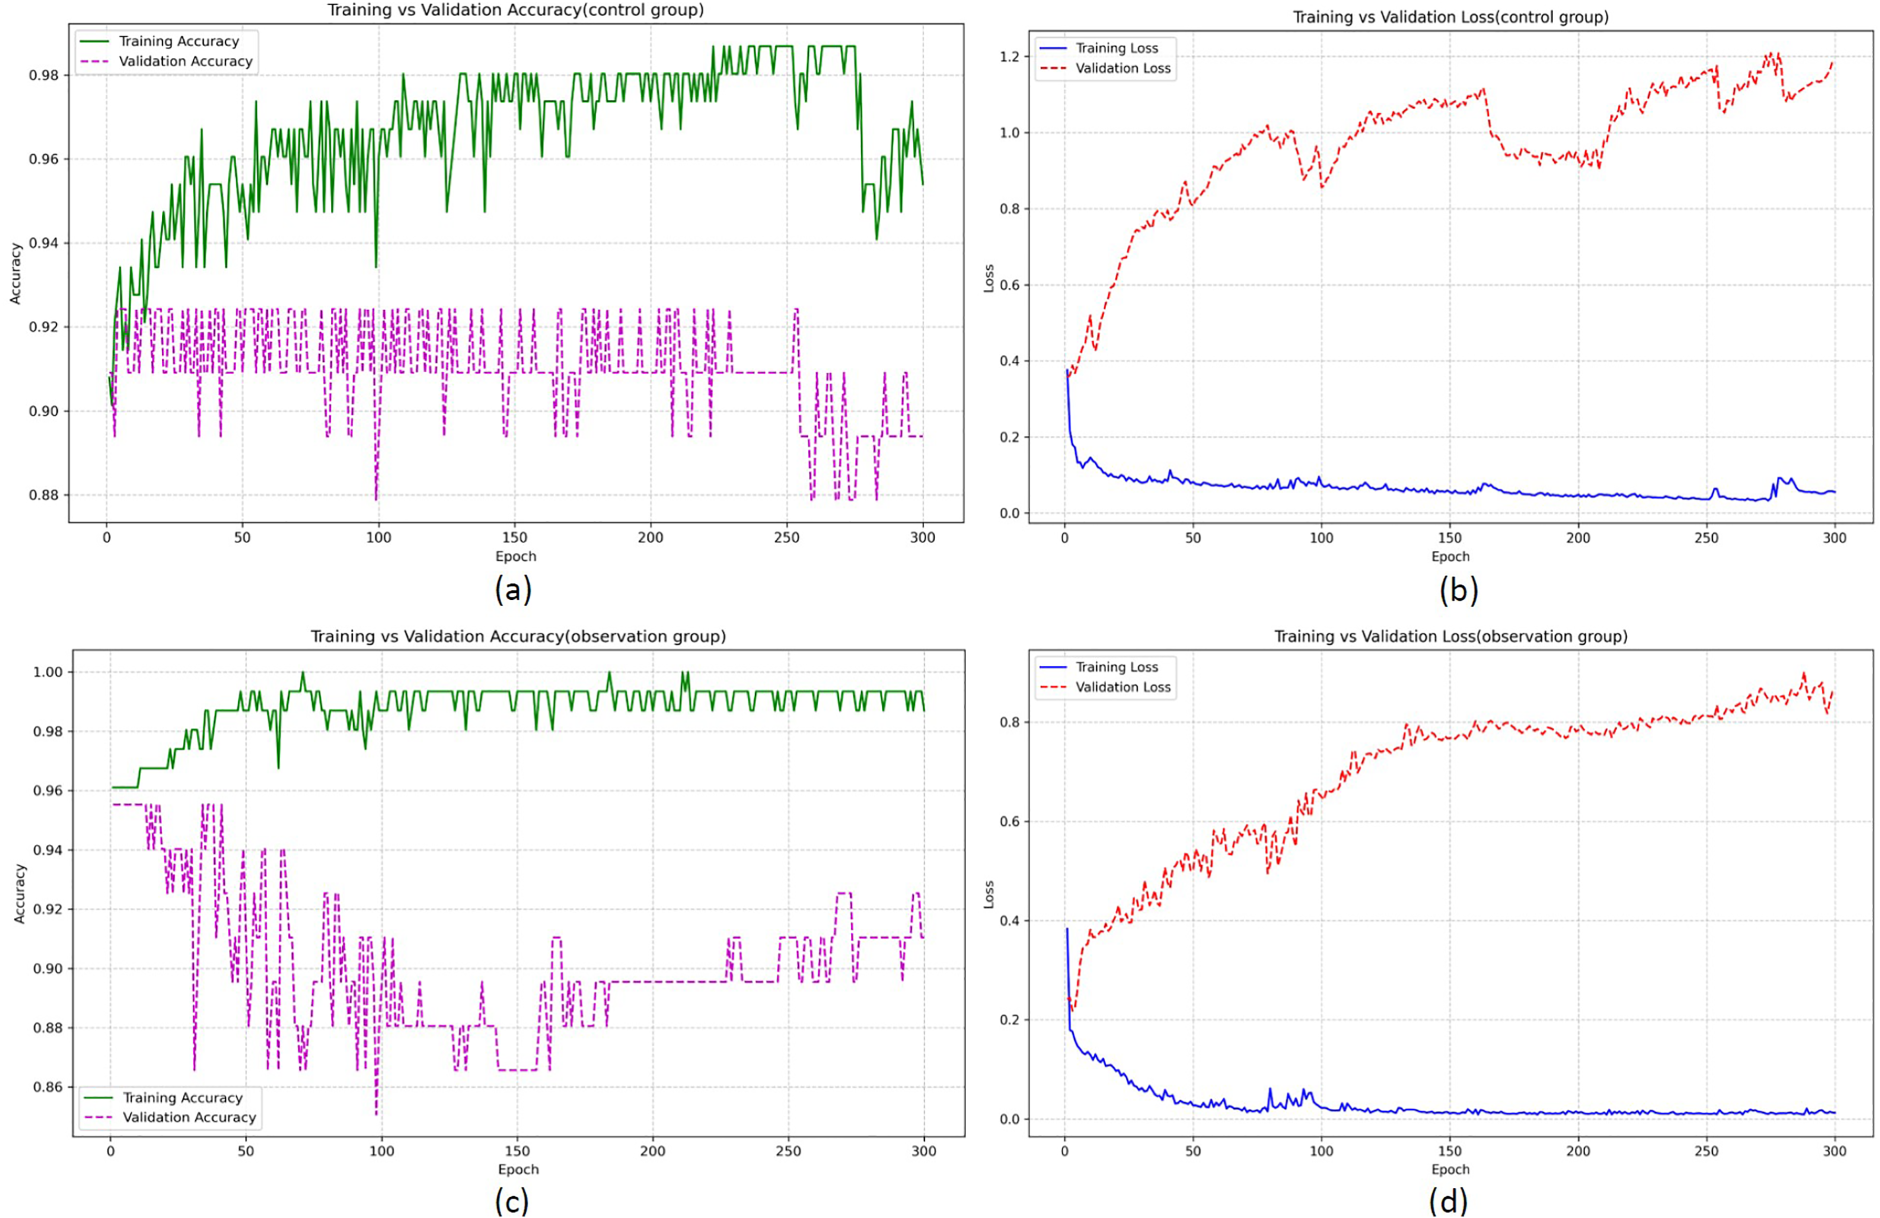
The training accuracy, validation accuracy, training loss, and validation loss for the 300 epochs for two different groups—the control group and the observation group—and were represented by the two sets of graphs.
Reports from control group
The training accuracy (green line) starts around 0.75 and gradually increases, stabilizing at around 0.92 after about 250 epochs. The validation accuracy (purple dashed line) starts lower, fluctuating a bit before stabilizing near 0.90. On the other hand, the training accuracy is always lower than the validation accuracy. The training loss (blue line) decreases steadily, dropping from around 1.6 to near 0.2 as training progresses. This indicates that the model is learning and improving its predictions. TA growing trend is shown by the validation loss (red dashed line), particularly after 200 epochs. This shows that although the model predicts on the training set, the validation set is unable to be properly applied in the process because the model is not being used to the same extent as the training.
Reports from observation group
When the first hundred epochs are applied to the training set, which indicates that the model is performing well, the training accuracy (green line) is somewhat higher than that of the control group, which is stabilizing at about 0.96 after the first 100 epochs. The validation accuracy (purple dashed line) behaves similarly to the control group, but it maintains a higher level of stability and starts to converge at around 0.92. While the model still performs slightly better on training data, the validation accuracy is more consistent and closer to the training accuracy, indicating better generalization. Training loss (blue line) decreases rapidly, dropping from a high value around 1.0 to about 0.2 by the end of training. The model is being taught well during training. Validation loss (red dashed line) also shows a steady decrease, but it fluctuates much less compared to the control group. It reaches around 0.1 and stabilizes, suggesting better generalization compared to the control group.
Explanation on train and validation metrics
The accuracy and loss of the model were very good. With more than 300 iterations, the training accuracy slowly increased from about 93.42% when training began, to 98.68% by the end of training. However, there were some variations in the validation accuracy, which went from a starting point of 92.42% and then fluctuated over time. The highest validation precision score is 92.42%. We can see that although our model performs better on the training set than the validation set as indicated by the gap in training accuracy and validation accuracy, it is still able to do reasonably well at the validation set.
The training loss kept falling with each epoch as we can observe it dropped from 0.1331 for epoch 5 all the way down to 0.0555 for epoch 300, so the model's performance improved over time; the validation loss also decreased steadily from an initial value of 0.3890 (for epoch 5) to 1.1830 (for epoch 300), although there were considerable fluctuations overall; nevertheless, the model did maintain reasonable performance in terms of the validation dataset throughout.
During the epochs, the loss function was reduced by means of modifying the network weights while the training status was judged with the help of the accuracy and loss measurement of both the training set and validation set.
To show how well the model works, two graphs were produced during its training process.
The train vs-validation loss plot highlighted the model's capability to reduce the training loss. Although the training loss decreased constantly, the validation loss displayed some fluctuation through the training process. Furthermore, the train vs-validation accuracy graph confirmed an increase in both the training accuracy and the validation accuracy, and moreover, showed minimal oscillation. Finally, the distinction of accuracy from the training and validation was minimal.
The observational group's outcome has shown it is more effective as the metrics for both validation accuracy and validation loss are more consistent. On the contrary, from observing the differences between the training and validation metrics, the controls perform worse for the metrics other than the training dataset, compared with those of the observation group's training and validation.
The modelling results suggest that it can be used to predict whether or not a patient may relapse based on features from health records like blood sugar levels, blood pressure, and medication adherence—and the model is highly accurate with very little loss and would be a solid starting point for fine-tuning and use in a real-world setting.
Conclusion
This study proposed an SFNNR prediction network for predicting relapse risk of patients with acute ischemic stroke (AIS) within a year following discharge. The logic behind it is that relapse risk depends on patients’ medical history such as blood glucose level, blood pressure, smoking status, medication adherence. In addition, sequential data are often input to such networks due to its rich features. Experimental results show the prediction capability of the model and show strong application potentials.
The proposed model was able to accurately predict relapses for the control group with a stable training accuracy above 92%. It did perform well on the training data, yet it struggled to generalize to the validation set. In comparison, the observation group had the highest overall generalization, exhibiting relatively similar training and validation accuracy. The capability of this model was mainly based on sensitive variables like blood sugar, blood pressure, and medication adherence, which were regarded as high-risk indicators when analyzing if someone had experienced relapse. The model successfully learned these variables and could effectively predict the relapse risk according to the patient's health data.
For future research, we can add to the model additional attributes like genetics, life style etc. Secondly, as with any machine learning project, using an ensemble approach or combining different algorithms (hybrid models) can greatly increase robustness. Further, connecting the model with IoT real-time health monitoring systems can update in real time the model using new and more relevant data about people.
Footnotes
Funding
The authors received no financial support for the research, authorship, and/or publication of this article.
Declaration of conflicting interests
The authors declared no potential conflicts of interest with respect to the research, authorship, and/or publication of this article.