
Abstract
Background
The cross-organ regulatory relationship between the lung and brain has been suggested. However, the causal associations between lung function and brain neuronal activity remain unclear.
Objective
In this study, we aimed to investigate this association using univariable Mendelian randomization (UVMR) and multivariable Mendelian randomization (MVMR) analyses.
Methods
We utilized summary data from genome-wide association studies of European ancestry for three lung function indicators (n = 400,102), including peak expiratory flow (PEF), forced expiratory volume in 1 s (FEV1), and forced vital capacity, and 68 brain regional neuronal activity amplitude traits (NAATs) (n = 34,691). The inverse-variance weighted method was employed to obtain main causal estimates. Sensitivity analyses were performed.
Results
In the UVMR analysis, we showed 23 causal associations, including 21 associations with PEF and 2 with FEV1. The MVMR analysis revealed eight causal associations between PEF and NAATs. These associations were observed across multiple regions, mainly in the precuneus, middle and inferior frontal gyrus, superior and middle occipital gyrus, superior parietal gyrus, inferior parietal lobule, postcentral gyrus, and crus I and II of the cerebellar hemispheres. Among these, causal associations between PEF and the NAAT of the middle occipital gyrus and precuneus (β = -0.146, P = 0.024) and the NAAT of the middle frontal gyrus and crus I and II of the cerebellar hemispheres (β = -0.139, P = 0.024) were observed.
Conclusions
We demonstrated the genetically predicted causal effects of PEF on brain neuronal activity. Closely monitoring PEF reductions in patients with lung disease may be critical for promptly detecting abnormal brain function.
Introduction
Respiratory and neurological diseases are among the primary causes of high morbidity and mortality worldwide, particularly amidst the accelerating aging population, which means that these diseases have been imposing escalating burdens on individuals, families, and societies.1,2 Recently, the relationship between the respiratory and central nervous systems has garnered significant research attention. Previous studies have shown elevated risks of neurodegenerative disorders characterized by abnormal brain neuronal activity, such as Alzheimer's or Parkinson's diseases, among patients with lung diseases,3–5 suggesting potential links between lung function and brain neuronal activity. Furthermore, studies have indicated that impaired lung function may contribute to structural alterations in the brain.6,7 However, these structural changes typically reflect pathological features of advanced disease stages, whereas abnormalities in intrinsic neuronal activity patterns may serve as earlier and more sensitive biomarkers for neuronal dysfunction and demonstrate stronger genetic connections to brain disorders such as Alzheimer's disease. 8 Therefore, exploring this causal relationship between lung function and brain neuronal activity is instrumental for the diagnosis and prevention of neurodegenerative disorders. Despite these findings, most previous studies have been observational in nature and often limited by small sample sizes, making it challenging to discern whether the observed associations stem from confounding factors, such as smoking status or comorbidities. 9 Moreover, these conclusions of observational studies may be influenced by reverse causality, leaving the causal relationship between lung function and brain neuronal activity unclear. 10 Thus, a more rigorous methodology is required to unravel the causal effects, which may guide the development of novel strategies and directions for disease prevention and treatment.
Randomized controlled trials are the gold standard in medicine for exploring causal relationships. 11 Nonetheless, high costs, lengthy follow-up periods, and possible ethical constraints limit their practical implementation. 11 Mendelian Randomization (MR), which leverages the principle of random allele allocation at conception to mimic a randomized controlled trial, has emerged as an effective tool for inferring causality.10,12 By utilizing genetic variants strongly associated with exposures as instrumental variables (IVs), MR genetically infers the causal impact of exposures on outcomes, providing robust evidence of causality. 13 In contrast to observational studies, MR effectively mitigates confounding factors and reverse causality because alleles are randomly allocated at the time of conception, generally independent of environmental or lifestyle influences and unaffected by the development of the outcome. 9 It leverages large-scale genome-wide association study (GWAS) data, thereby providing more reliable results.14,15 It has been extensively applied in causal studies on topics including the gut microbiota and cardiovascular diseases.13,16 However, the causal relationship between lung function and brain neuronal activity has not been reported.
We hypothesized that reduced lung function may causally affect brain neuronal activity. To investigate this, we used univariate and multivariate MR (UVMR and MVMR, respectively) analyses to explore the potential causal effect of lung function on brain neuronal activity. In this study, we aimed to enhance comprehension of the intricate causal connection between lung and brain health, thereby providing a theoretical foundation for developing clinical interventions and preventive strategies targeting brain neuronal dysfunction.
Methods
Study design
Figure 1 illustrates the study design. We employed single-nucleotide polymorphisms (SNPs) as IVs to perform MR analyses. 9 Three core assumptions must be fulfilled to ensure the validity of MR studies: (1) IVs should be strongly relevant to the corresponding exposures (relevance assumption); (2) IVs should be independent of confounders affecting exposure and outcome (independence assumption); and (3) the association of IVs with outcomes should occur only via their effects on exposure (exclusion restriction assumption).11,17 We performed UVMR analysis using three lung function indicators—peak expiratory flow (PEF), forced expiratory volume in 1 s (FEV1), and forced vital capacity (FVC)—as exposures, with 68 brain neuronal activity amplitude traits (NAATs) representing spontaneous neuronal activity in brain regions measured using resting-state functional magnetic resonance imaging (rs-fMRI) as outcomes (Table S1). We incorporated three exposures within the MVMR analysis to evaluate the direct causal effect and analyzed 22 brain NAATs. 18 These NAATs were identified in UVMR analysis, with P < 0.05 derived from the inverse-variance weighted (IVW) method. This study utilized publicly accessible anonymized GWASs data originally collected from participant studies previously approved by the corresponding ethics committees for human experimentation.
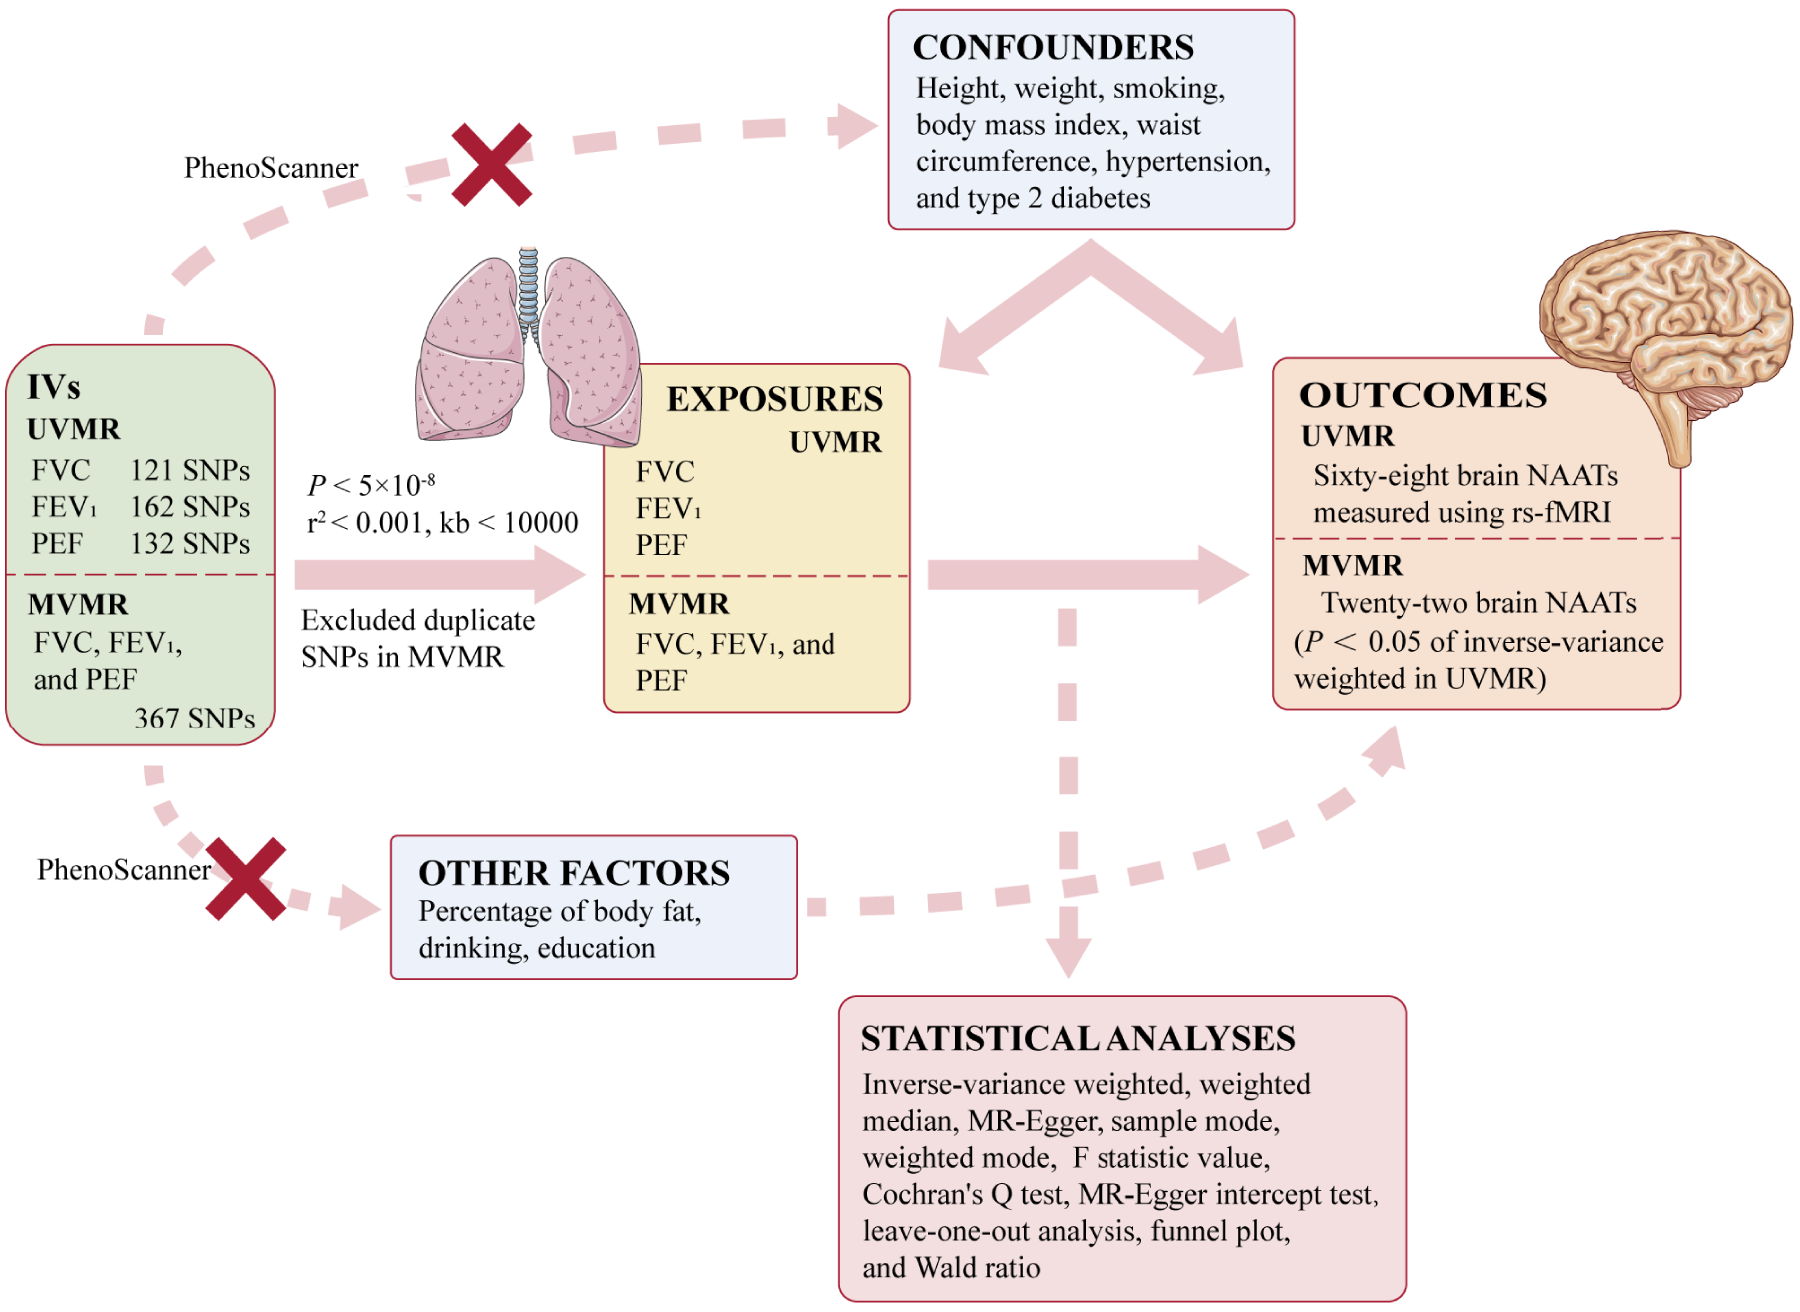
Study design. IVs: instrumental variables; UVMR: univariable Mendelian randomization; FVC: forced vital capacity; FEV1: forced expiratory volume in 1 s; PEF: peak expiratory flow; MVMR: multivariable Mendelian randomization; NAATs: neuronal activity amplitude traits; rs-fMRI: resting-state functional magnetic resonance imaging.
2.2. Exposure data source
PEF represents the maximum airflow achieved during forced exhalation and serves as a key indicator of airway obstruction, playing a crucial role in monitoring asthma. 19 FEV1 measures the amount of air exhaled in the first second after full inhalation and is essential for assessing airway patency. 20 FVC denotes the maximum volume of air that can be rapidly exhaled after full inhalation, reflecting lung capacity. 20 These three indicators are critical for evaluating lung function and diagnosing respiratory diseases. In this study, the SNP association estimates were derived from a published GWAS, which encompassed data from the SpiroMeta and UK Biobank Consortiums (Table 1). Shrine et al. 21 performed a GWAS on a cohort of 400,102 individuals of European ancestry (https://www.ebi.ac.uk/gwas/), identifying a total of 279 genome-wide significant SNPs, including 139 novel SNPs. Lung function was measured using standardized spirometry. The GWAS was adjusted for smoking status, sex, height, age, and age-squared, and 19,819,130 common variants were identified. 21
Characteristics of data sources.
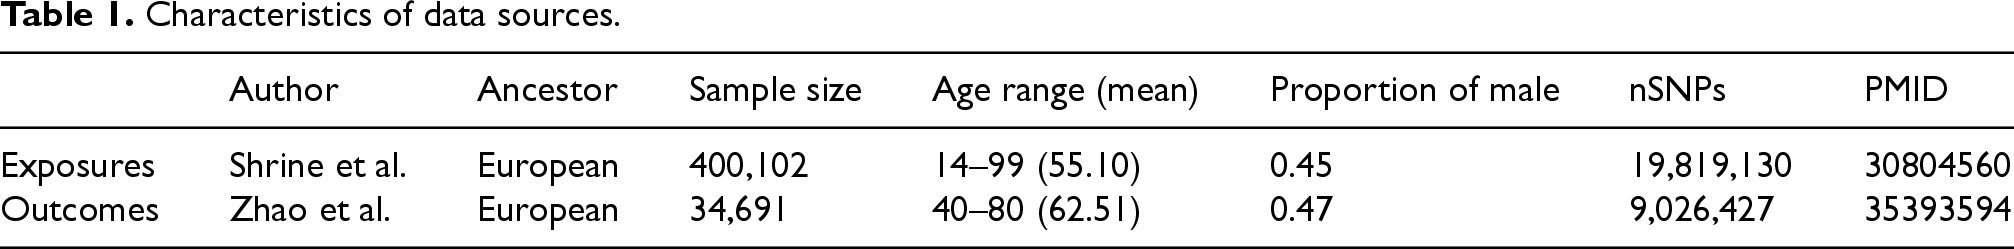
Rs-fMRI is used to detect neuronal spontaneous intrinsic brain activities through alterations in the blood oxygen level-dependent signal, allowing non-invasive observations of the intrinsic functional architecture of the brain to reveal complex brain functions.8,22 In our study, we utilized GWAS data from Zhao et al., 8 which included rs-fMRI data from 34,691 individuals of European ancestry and identified 45 new genetic regions correlated with functional signatures of the brain (P < 2.8 × 10⁻¹¹) (https://www.med.unc.edu/bigs2/). The GWAS was conducted for 9,026,427 common variants and adjusted for the influences of long-term drifts, head motion, head size, head location, imaging site, age (at imaging), sex, age–sex interaction, age-squared, age-squared–sex interaction, and the top 40 genetic principal components. 8 Following the generation of amplitude traits, these traits were manually labeled utilizing the automated anatomical labeling atlas. 23 A summary of the 68 NAATs representing spontaneous neuronal activity in brain regions is provided in Table S1.
Selection of ivs
The selection of genetic instruments adhered to a conventional GWAS significance threshold (P < 5 × 10⁻⁸) and linkage disequilibrium r2 of < 0.001, located within < 10,000 kb from the index variant, contributes to satisfying the relevance assumption and the exclusion restriction assumption.
15
We verified each SNP using the PhenoScanner V2 platform and inspected whether these SNPs exhibited associations with confounders,24,25 including height,
9
weight,
9
waist circumference,
9
body mass index,
9
smoking,
26
hypertension,
27
and type 2 diabetes,
9
which may violate the independence assumption or the exclusion restriction assumption by mediating causal effects through other factors,
11
including the percentage of body fat,
28
drinking,
29
and education.
30
We excluded SNPs displaying genome-wide significance in association with any potential factors (Tables S2–S4). To detect and correct the effects of outlier SNPs, the MR-PRESSO test was conducted.
15
Moreover, we computed the F-statistical value to predict the intensity of the IVs as follows:


The MR estimation methods employed included the IVW,11,32 weighted median, 33 MR-Egger, 34 weighted mode, 16 and simple mode. 16 The β coefficient represented the causal effect estimate of the exposure on the outcome. As the most efficient analytical method, IVW is commonly used as the primary analysis in MR studies involving multiple genetic variants. 11 It disregards the existence of an intercept and assumes that all SNPs serve as valid IVs, providing the greatest statistical power. 11 The reciprocal variance of each IV is used as the weight by the IVW method in executing a weighted linear regression analysis. 35 The weighted median method assumes that the proportion of valid IVs is not less than half, 33 ensuring robustness against outliers while sensitive to eliminating or adding genetic variation. 11 The MR-Egger method, a complementary approach within MR analysis, differs from the IVW method in its consideration of an intercept term. 35 When most IVs are valid, with the same causal effect, the weighted mode method is appropriate. 33 The simple mode method is robust against pleiotropy. 16
We conducted multiple sensitivity analyses further supports the reliability of our results. The MR-Egger intercept test was performed to assess potential pleiotropy, thereby evaluating the exclusion restriction assumption. 15 In cases where the P value derived from the MR-Egger intercept test exceeded 0.05, indicating no evidence of horizontal pleiotropy and thus satisfying the assumptions of IVW, IVW was considered the most reliable approach and served as the primary analysis in our study. 11 Heterogeneity can affect the consistency and interpretability of the results. Therefore, we employed Cochran's Q test to assess heterogeneity, which reveals heterogeneity when the P value is < 0.05.9,36 By removing each SNP and testing with the remaining SNPs, leave-one-out analyses were implemented to assess the stability of our results. 16 We did not apply multiple testing correction in this exploratory study. The asymmetry was visually inferred using a funnel plot to estimate the horizontal pleiotropy. 14 Furthermore, the Wald ratio of each SNP was computed to evaluate the effect of exposure on outcome; these findings were presented in forest plots. We performed all the analyses in R Studio (version 4.2.2) with the TwoSampleMR and MR-PRESSO R packages.10,15
Results
Using the PhenoScanner V2 platform, 24 the sum of 301 SNPs were excluded owing to their association with confounders or other factors, which may violate the core assumptions of MR studies (Tables S2–S4). 11 In UVMR analysis, after excluding SNPs associated with confounders, 132, 162, and 121 SNPs were identified in association with PEF, FEV1, and FVC, respectively (Tables S5–S7). The number of IVs was further reduced due to palindromic SNPs, outliers, or missing outcome data. The SNPs selection process and the exact number of SNPs retained after each filtering step are summarized in Supplementary Figure S1 and Tables S8–S10. In MVMR analysis, we integrated 367 SNPs as IVs; each SNP was linked to at least one lung function measure (Table S11). Among these, 10 SNPs with missing outcome data and 10 SNPs with palindromic structures were removed (Table S15). The F-statistic values for the IVs suggested a lower risk of weak IVs bias in our results (range: 28.890–440.998; mean: 55.042, Tables S5–S7).
PEF
In the UVMR analysis, 21 significant causal associations were detected using IVW method when PEF was the exposure (Figure 2).
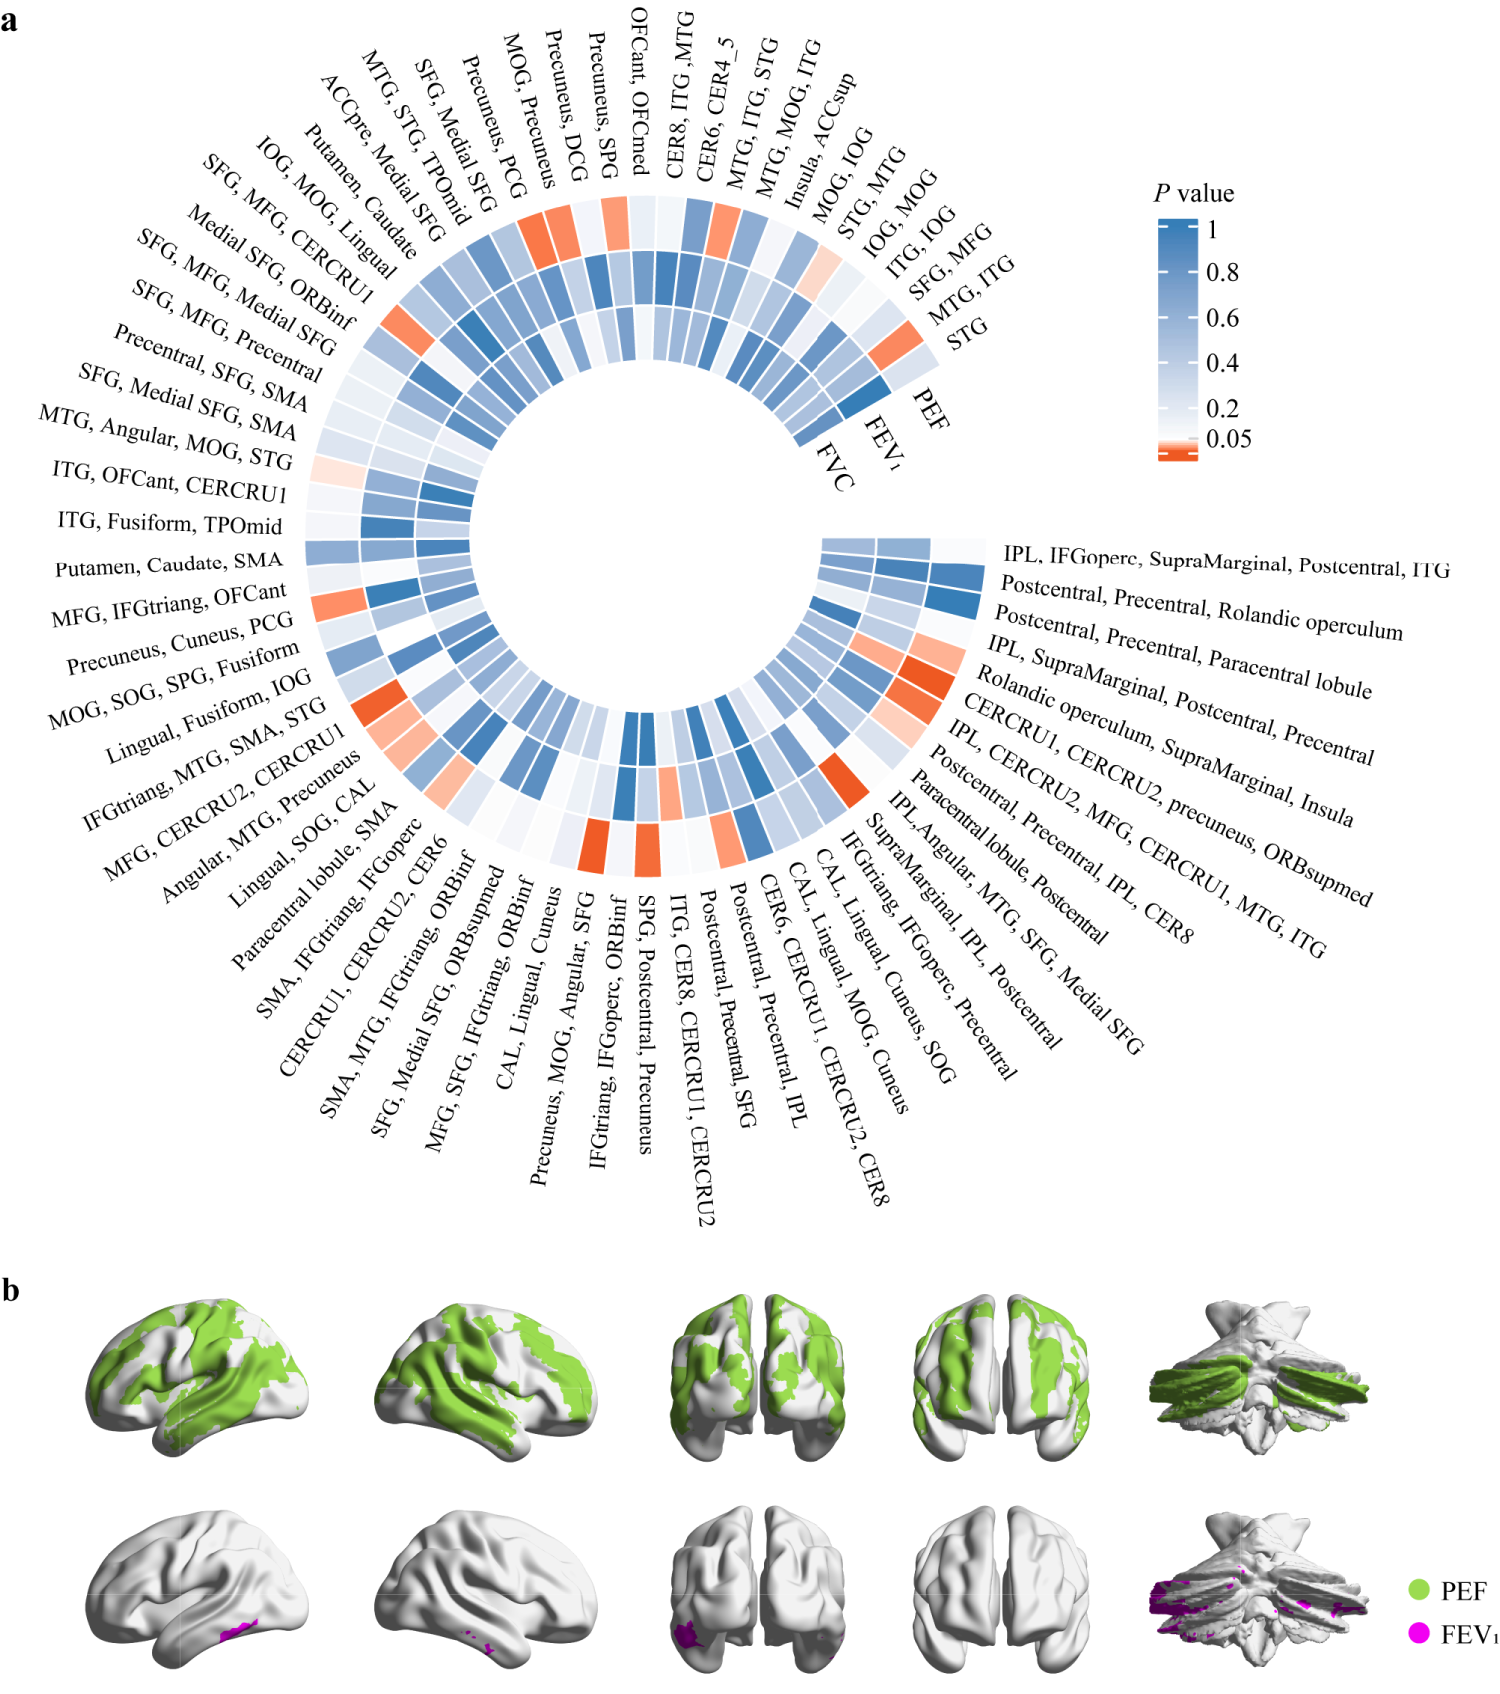
UVMR analysis. (A) IVW-derived P value in the UVMR analysis. Each element in the heatmap represents a UVMR result with lung function as the exposure and NAAT as the outcome, with color indicating the IVW-derived P value. (B) Brain regions showing causal associations between PEF and FEV1 with neuronal activity amplitude traits. STG: superior temporal gyrus; SMA: supplementary motor area; MTG: middle temporal gyrus; ITG: inferior temporal gyrus; SPG: superior parietal gyrus; IPL: inferior parietal lobule; SFG: superior frontal gyrus; ORBsupmed: superior frontal gyrus, medial orbital; MFG: middle frontal gyrus; ORBinf: inferior frontal gyrus, orbital part; IFGtriang: inferior frontal gyrus, triangular part; IFGoperc: inferior frontal gyrus, opercular part; CAL: calcarine fissure and surrounding cortex; SOG: superior occipital gyrus; MOG: middle occipital gyrus; PCG: posterior cingulate gyrus; IOG: inferior occipital gyrus; DCG: median cingulate and paracingulate gyri; ACCsup: anterior cingulate cortex, supracallosal; ACCpre: anterior cingulate cortex, pregenual; OFCmed: medial orbital gyrus; OFCant: anterior orbital gyrus; TPOmid: temporal pole, middle temporal gyrus; CERCRU1: crus I of cerebellar hemisphere; CERCRU2: crus II of cerebellar hemisphere; CER4_5: lobule IV, V of cerebellar hemisphere; CER6: lobule VI of cerebellar hemisphere; CER8: lobule VIII of cerebellar hemisphere.
Among these, 15 causal associations showed IVW-derived P values < 0.05, with consistent directional trends observed in both MR-Egger and weighted median methods (Figure 3 and Table S12). Our findings indicated that genetically predicted increase in PEF was associated with decreased NAATs of the crus I and II of the cerebellar hemispheres (CERCRU1 and CERCRU2, respectively), precuneus, and medial orbital superior frontal gyrus (ORBsupmed) (β = -0.151, P = 4.31 × 10⁻⁵).Genetically determined PEF was associated with NAATs of the supramarginal gyrus, inferior parietal lobule (IPL), and postcentral gyrus (β = -0.150, P = 1.25 × 10⁻⁴) and of the precuneus, middle occipital gyrus (MOG), angular gyrus, and superior frontal gyrus (β = -0.136, P = 2.50 × 10⁻⁴). Similar associations were observed in IPL, CERCRU2, middle frontal gyrus (MFG), CERCRU1, middle temporal gyrus (MTG), and inferior temporal gyrus (ITG) (β = -0.098, P = 0.007) and in the postcentral gyrus, precentral gyrus, and IPL (β = -0.082, P = 0.019). Causal relationships between PEF and the NAATs of the precuneus and posterior cingulate gyrus (PCG) (β = -0.095, P = 0.008) and of the Rolandic operculum, supramarginal gyrus, and insula (β = -0.081, P = 0.026) were observed. The causal effects of PEF on the NAAT of the angular gyrus, MTG, and precuneus (β = -0.079, P = 0.027), of MFG, CERCRU2, and CERCRU1 (β = -0.112, P = 0.002), and of the postcentral gyrus, precentral gyrus, IPL, and lobule VIII of cerebellar hemisphere (CER8) (β = -0.077, P = 0.036) were revealed. PEF was related to the NAATs of the supplementary motor area (SMA), inferior frontal gyrus of triangle (IFGtriang), and inferior frontal gyrus of operculum (IFGoperc) (β = -0.083, P = 0.029) and of the superior parietal gyrus (SPG), postcentral gyrus, and precuneus (β = -0.102, P = 0.005). Moreover, PEF was associated with the NAATs of MTG and ITG (β = -0.086, P = 0.014), of MTG, ITG, and superior temporal gyrus (STG) (β = -0.083, P = 0.017), and of MTG, angular gyrus, MOG, and STG (β = -0.067, P = 0.043).
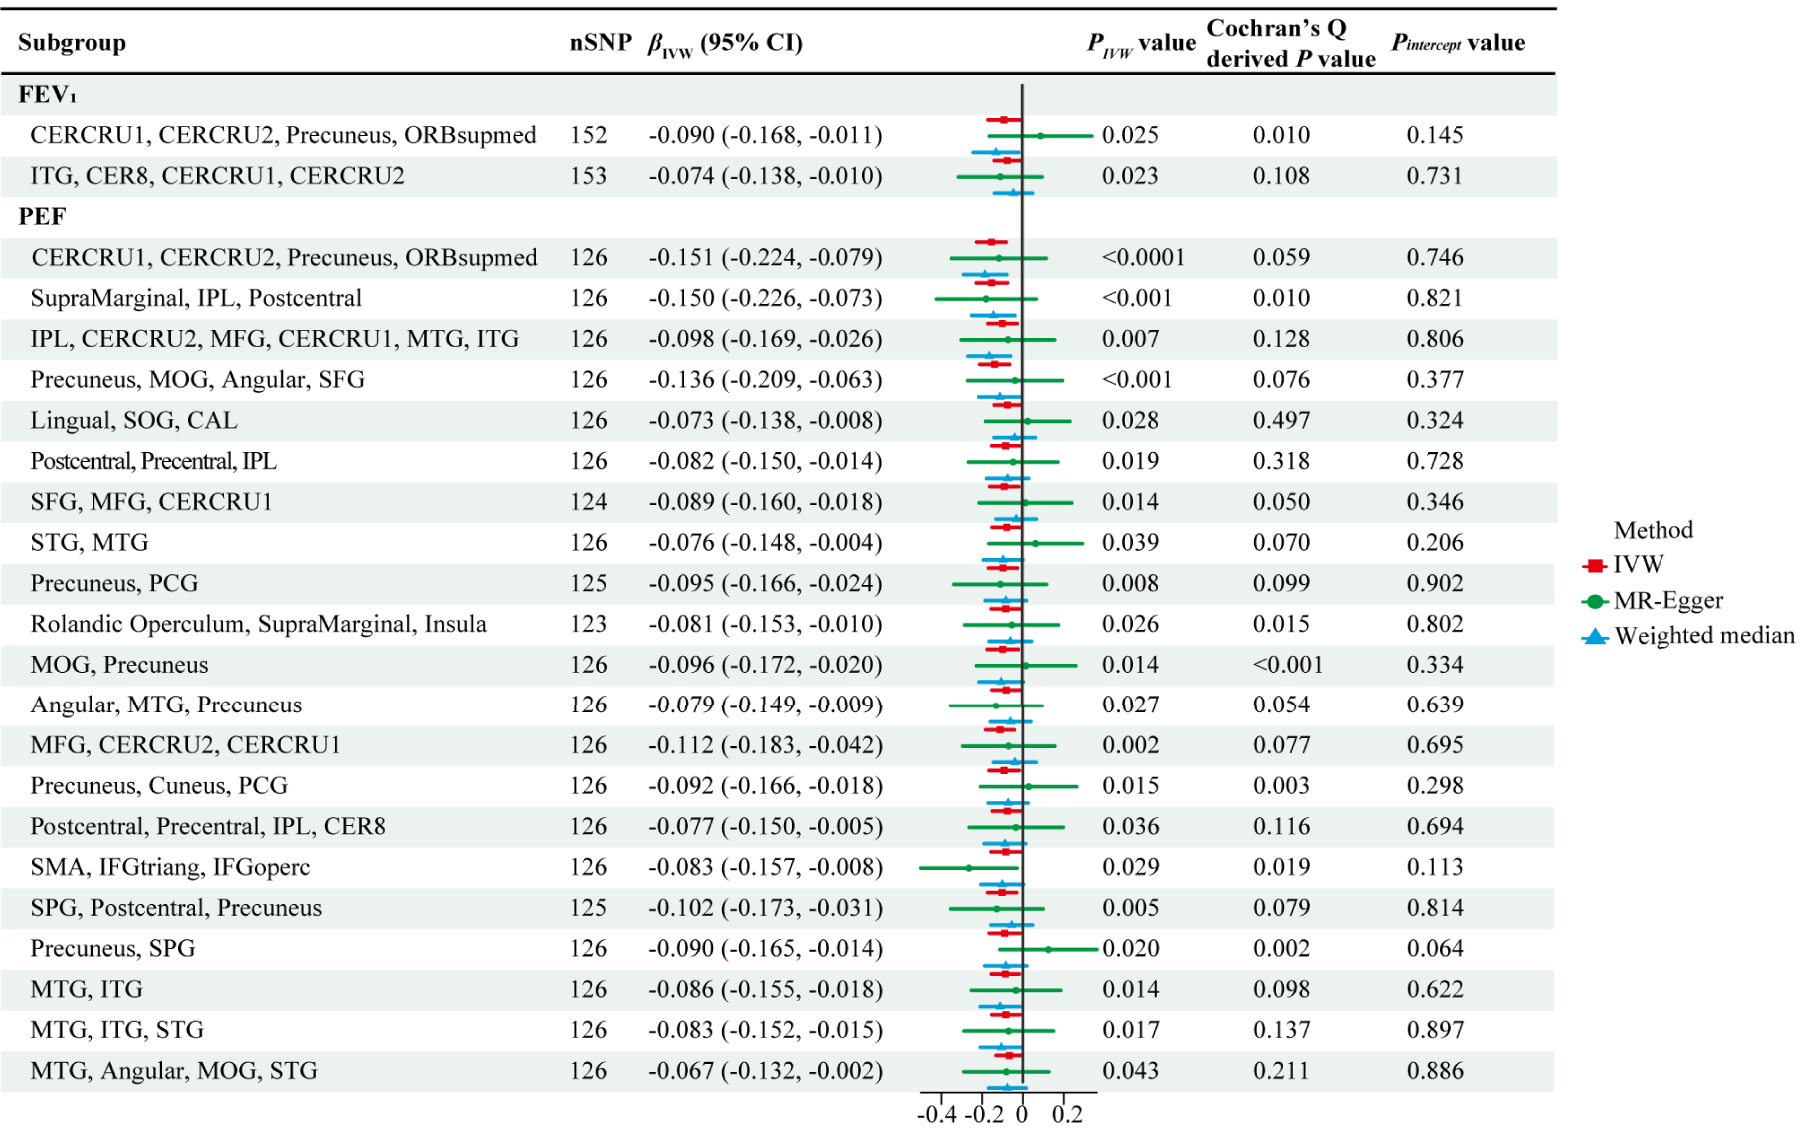
Twenty-three causal associations identified in UVMR analysis. βIVW and PIVW represent the IVW-derived β and P values, respectively. The forest plot represents β values and 95% CIs derived from three methods. Pintercept: MR-Egger intercept derived P value; IVW: inverse-variance weighted; CERCRU1: crus I of cerebellar hemisphere; CERCRU2: crus II of cerebellar hemisphere; ORBsupmed: superior frontal gyrus, medial orbital; ITG: inferior temporal gyrus; CER8: lobule VIII of cerebellar hemisphere; IPL: inferior parietal lobule; MFG: middle frontal gyrus; MTG: middle temporal gyrus; SOG: superior occipital gyrus; SFG: superior frontal gyrus; MOG: middle occipital gyrus; SMA: supplementary motor area; PCG: posterior cingulate gyrus; CAL: calcarine fissure and surrounding cortex; STG: superior temporal gyrus; IFGtriang: inferior frontal gyrus, triangular part; IFGoperc: inferior frontal gyrus, opercular part; SPG: superior parietal gyrus.
In six causal associations, IVW-derived P < 0.05 with directional trends consistent with the weighted median method; however, the MR-Egger method showed opposite trends. The causal effects of PEF on the NAAT of the lingual gyrus, superior occipital gyrus (SOG), and calcarine fissure and surrounding cortex (CAL) (β = -0.073, P = 0.028), in the superior frontal gyrus, MFG, and CERCRU1 (β = -0.089, P = 0.014), and in STG and MTG (β = -0.076, P = 0.039) were revealed in IVW. Similar associations were observed in MOG and precuneus (β = -0.096, P = 0.014), in the precuneus, cuneus, and PCG (β = -0.092, P = 0.015), and in precuneus and SPG (β = -0.090, P = 0.020). The MR-Egger method requires the additional instrument strength independent of direct effect assumption, which limits its statistical power. 37 Under the absence of pleiotropy, IVW demonstrates significantly greater power than MR-Egger. 38 Therefore, IVW was primarily used to obtain the main causal estimates.
All P values derived from the MR-Egger intercept test were > 0.05, indicating that horizontal pleiotropy was not present, whereas Cochran's Q tests results identified heterogeneity in 24 groups with P < 0.05 (Table S16). However, the presence of heterogeneity was considered acceptable when the random-effects IVW results were employed as the main results. 15 Overall, 32 outliers instances were identified across 20 groups using the MR-PRESSO test (Table S8); subsequently, the process was repeated after their exclusion. Funnel plots, forest plots, and leave-one-out analysis for observed 21 causal associations are presented in Figures S2-S22. The reliability of the results was confirmed using leave-one-out analysis, which suggested the absence of bias due to any SNP in the results. Additionally, the funnel plots indicated relatively symmetrical findings.
On adjusting for FVC and FEV1 in the MVMR analysis, eight significant direct causal associations between PEF and brain NAATs were found (Figure 4). The genetic prediction level indicated that PEF was negatively correlated with the NAATs of SMA, IFGtiang, and IFGoperc (β = -0.171, P = 0.007), of MFG, CERCRU2, and CERCRU1 (β = -0.139, P = 0.024) and of MOG and precuneus (β = -0.146, P = 0.024) (Figure 5 and Table S15). Our results indicated that PEF has causal relationships with the NAATs of the supramarginal gyrus, IPL, and postcentral gyrus (β = -0.136, P = 0.045), of the lingual gyrus, SOG, and CAL (β = -0.128, P = 0.040), and of the precuneus and SPG (β = -0.147, P = 0.020). PEF was associated with the NAATs of the angular gyrus, MTG, and precuneus (β = -0.128, P = 0.043) and of SPG, postcentral gyrus, and precuneus (β = -0.163, P = 0.008). These associations predominantly involved the brain regions of the precuneus, MFG, IFGoperc, IFGtriang, SPG, IPL, SOG, MOG, CERCRU1, CERCRU2, and postcentral gyrus.
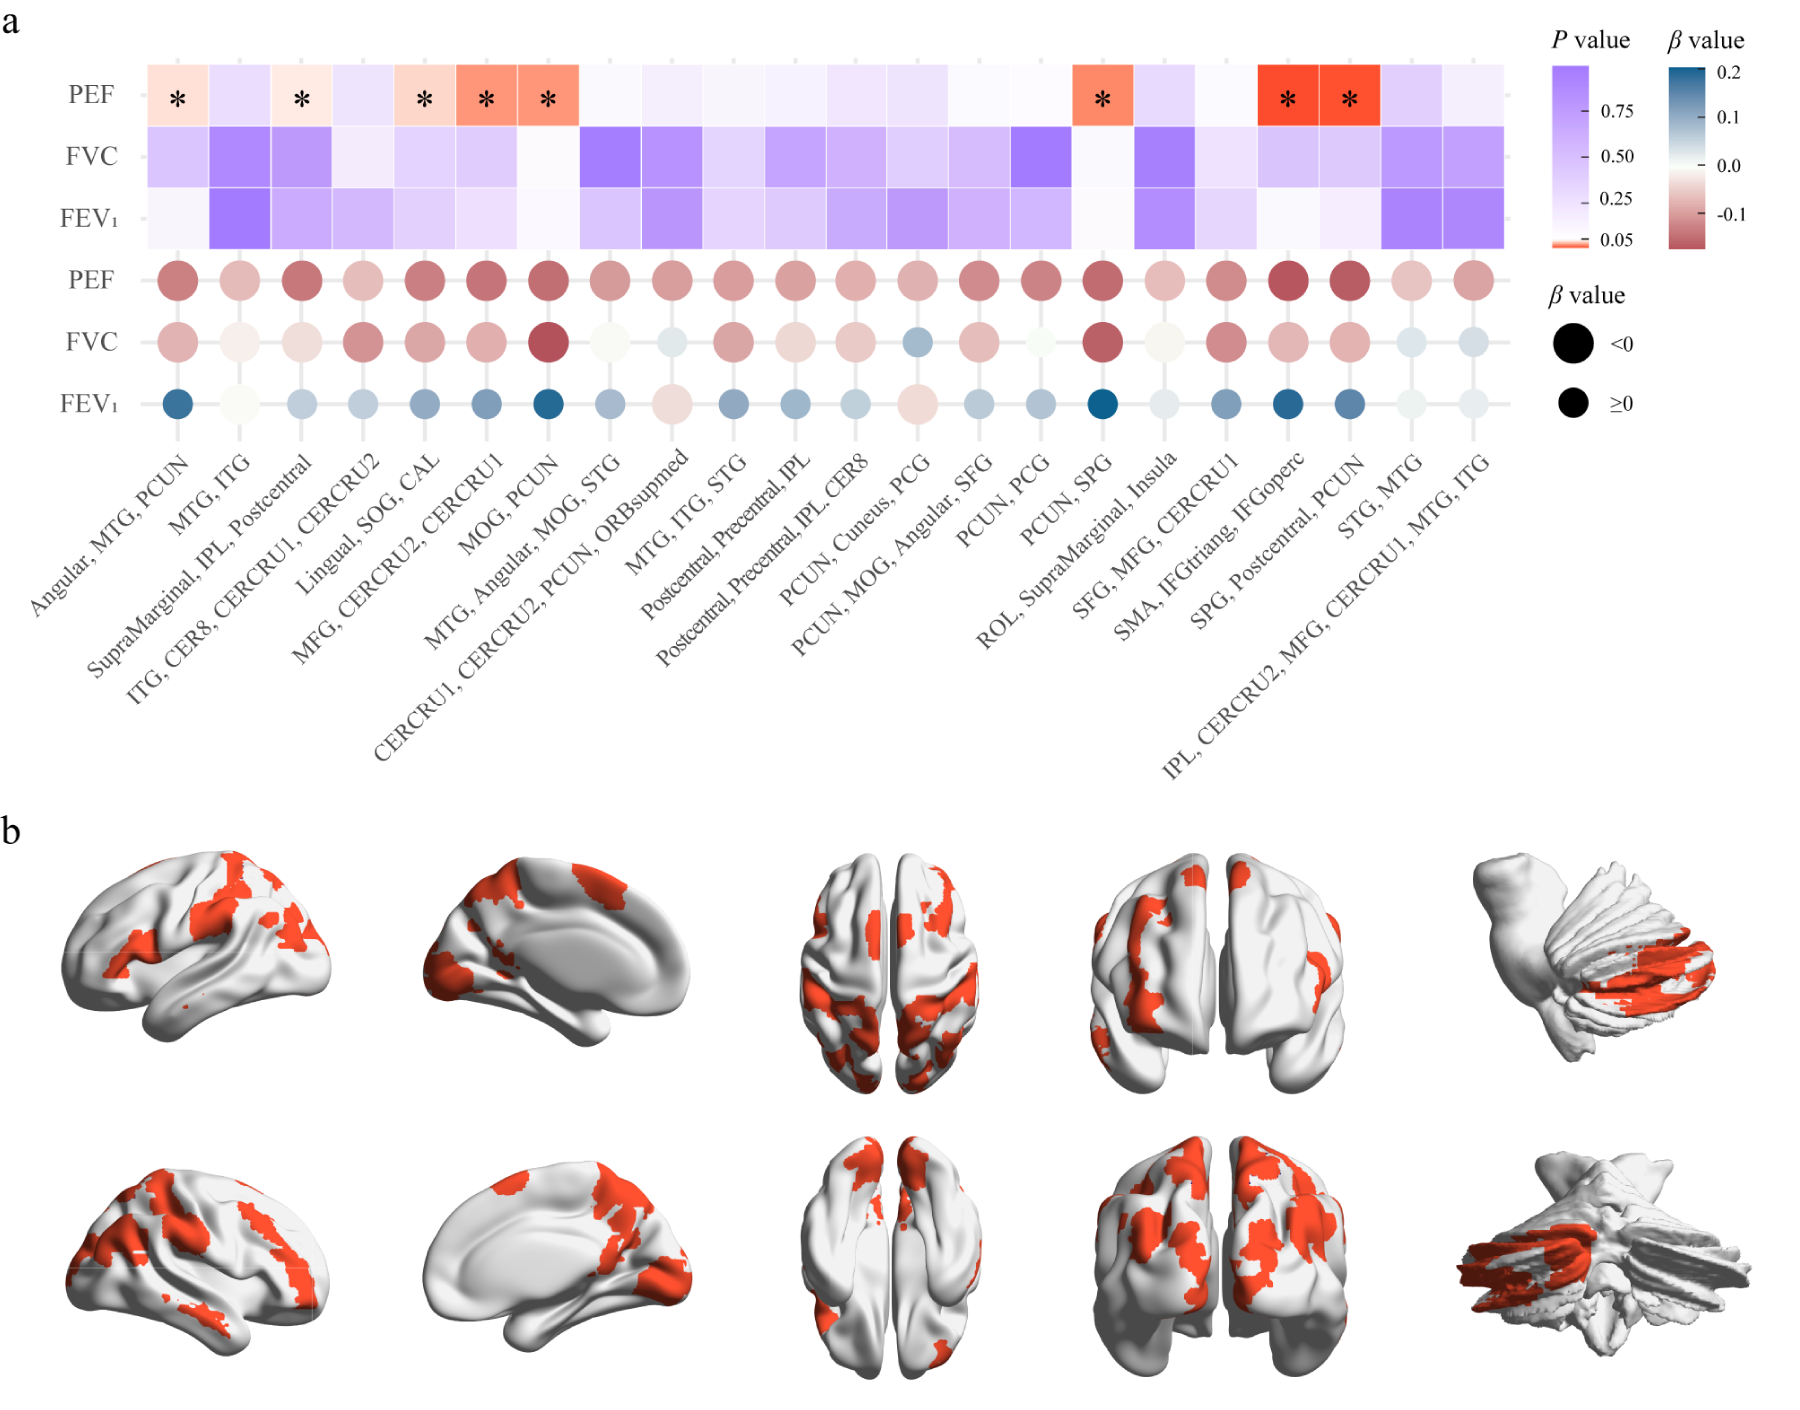
MVMR analysis. (A), IVW-derived P and β values in MVMR analysis reflect the direct causal effect of each lung function on the NAAT. Square elements indicate P values through color, while circular elements represent β values through color and its direction through size. * indicates IVW-derived P < 0.05. (B), Brain regions showing causal associations between PEF and neuronal activity amplitude traits. IVW: inverse-variance weighted; PCUN: precuneus; ITG: inferior temporal gyrus; IPL: inferior parietal lobule; MTG: middle temporal gyrus; CER8: lobule VIII of cerebellar hemisphere; CERCRU1: crus I of cerebellar hemisphere; CERCRU2: crus II of cerebellar hemisphere; SOG: superior occipital gyrus; MFG: middle frontal gyrus; MOG: middle occipital gyrus; CAL: calcarine fissure and surrounding cortex; STG: superior temporal gyrus; SMA: supplementary motor area; PCG: posterior cingulate gyrus; ORBsupmed: superior frontal gyrus, medial orbital; SFG: superior frontal gyrus; ROL: Rolandic operculum; IFGtriang: inferior frontal gyrus, triangular part; IFGoperc: inferior frontal gyrus, opercular part; SPG: superior parietal gyrus.

Eight causal associations of PEF on brain NAATs identified in MVMR analysis. The forest plot represents β values and 95% CIs. IPL: inferior parietal lobule; SOG: superior occipital gyrus; CAL: calcarine fissure and surrounding cortex; MOG: middle occipital gyrus; MTG: middle temporal gyrus; MFG: middle frontal gyrus; CERCRU1: crus I of the cerebellar hemisphere; CERCRU2: crus II of the cerebellar hemisphere; SMA: supplementary motor area; IFGtriang: inferior frontal gyrus, triangular part; IFGoperc: inferior frontal gyrus, opercular part; SPG: superior parietal gyrus.
We found an inverse causal relationship between FEV1 and the NAAT of CERCRU1, CERCRU2, precuneus, and ORBsupmed in the UVMR analysis (β = -0.090, P = 0.025). FEV1 exerts a causal effect on the NAAT of ITG, CER8, CERCRU1, and CERCRU2 regions (β = -0.074, P = 0.023), with consistent direction in MR-Egger and weighted median methods results (Figure 3 and Table S13). In MR-Egger intercept tests, no evidence of directional pleiotropy was found, whereas heterogeneity was identified in Cochran's Q test (Table S17). Forty-two outliers instances were identified across subgroups through the MR-PRESSO test, with some SNPs flagged in more than one subgroup (Table S9). Our results were unaffected by a single SNP, as shown using the leave-one-out analysis, and funnel plots indicated relatively symmetrical results (Figures S23 and S24). However, the MVMR analysis revealed no direct causal effect of FEV1 on the NAAT (Table S15).
FVC
The FVC showed no causal relationship with brain neuronal activity when assessed using the IVW method in the UVMR analysis (Table S14). Outliers and heterogeneity were identified utilizing the MR-PRESSO test and Cochran's Q test; detailed information is provided in Tables S10 and S18. In MR-Egger intercept tests, directional pleiotropy was not observed (Table S18). No direct causal effects of FVC on the brain NAATs were identified in MVMR analysis (Figure 4 and Table S15).
Discussion
We conducted univariable and multivariable MR analyses to investigate the causal effects of lung function on rs-fMRI-measured brain neuronal activity; to our knowledge, this is the first study on this association. Our findings provide novel genetic insights into the intervention and treatment for patients with neuropsychiatric disorders. The genetically determined PEF is associated with 21 brain NAATs in the UVMR analysis. Eight direct causal associations between PEF and brain NAATs were identified in the MVMR analysis, specifically in the precuneus, MFG, inferior frontal gyrus (including IFGoperc and IFGtriang), SPG, IPL, SOG, MOG, CERCRU1, CERCRU2, and postcentral gyrus.
Despite previous research focusing on the impact of FVC and FEV1 on the brain,39,40 our results suggest that the associations between FVC, FEV1, and brain NAATs are unlikely to be directly causal. While the UVMR analysis using FEV1 as a single exposure factor revealed causal relationships in two groups, these associations disappeared in the MVMR analysis incorporating PEF and FVC. Meanwhile, FVC showed no association in either method. Unlike traditional regression, which requires removing highly correlated variables to avoid bias, MVMR leverages the non-complete overlap of IVs (e.g., non-complete overlapping IVs between PEF and FEV1 or FVC) to disentangle direct causal effects among phenotypically correlated exposures—extending the UVMR framework. This is because phenotypic correlation does not imply genetic homogeneity. Given the strong phenotypic correlation among PEF, FEV1, and FVC in individuals,13,41 we conducted MVMR to assess direct causal effects. We detected eight directly causal associations between PEF and NAATs. In MVMR analysis, PEF showed causal effects on brain neuronal activity that were independent of the other two lung function parameters, whereas no such effects were observed for FEV1. These findings suggest that PEF may serve as a more robust indicator compared to FEV1 and FVC.
A common complication of lung function injury is long-term hypoxemia, which can affect oxygen-dependent enzyme activity and interfere with neurotransmitter synthesis, leading to neuronal dysfunction. 42 PEF is a routine examination of pulmonary ventilation function that measures the degree of airflow obstruction. 19 A study involving 431,834 individuals suggested that low PEF levels may reduce the oxygen-carrying capacity of the blood and found the associations between PEF level and IPL and precuneus volumes. 43 Patients with brain function impairment exhibit a higher amplitude of low-frequency fluctuation in the IPL, reflecting higher spontaneous neuronal activity. 44 However, another study reported lower amplitude of low-frequency fluctuation in the precuneus among patients with subjective cognitive decline, possibly owing to different confounders. 45 The precuneus and IPL are pivotal for the cognitive functions of the brain.46,47 Our findings indicate that increased PEF is causally associated with decreased levels of neuronal activity in the precuneus and IPL. This association may be attributed to enhanced oxygen exchange, which leads to more efficient metabolism in these brain regions and increased neural efficiency, manifesting as lower neural activation and better functional performance. 48
Inflammation-induced damage may lead to compensatory neuronal activation. 49 Previous studies have found that low PEF levels can mediate inflammatory factors, which affect inflammatory processes. 43 These factors may trigger neuronal activation and impair brain functionality. 50 A follow-up investigation of COVID-19 survivors revealed heightened spontaneous neuronal activity across multiple cerebral regions, including the left postcentral gyrus, MFG, IFGoperc, IFGtriang, supramarginal gyrus, inferior parietal angular gyrus (part of the IPL), and MTG, suggesting a potential association with compensatory brain tissue repair following inflammation. 51 Compensatory activation of neuronal spontaneous activity was observed in the IPL, MOG, CERCRU1, and CERCRU2.44,52 Herein, we revealed a negative causal relationship between PEF and the neuronal activity of the aforementioned brain regions. High PEF levels may reduce neuronal spontaneous activity amplitude by attenuating the occurrence of compensatory mechanisms caused by inflammation, thereby affecting neuronal function in these brain regions; however, the underlying mechanisms remain unclear. Our findings could enable clinicians to thoroughly assess patients simultaneously presenting with decreased PEF and neurological symptoms, facilitating the formulation of more precise treatment strategies.
Respiratory patterns may contribute to emotion regulation. 53 Comorbidities such as depression and anxiety are frequently observed in individuals with compromised lung function.51,54 In the brain, the MFG and inferior frontal gyrus are associated with emotional regulation, and heightened neuronal activity in these regions can be observed in individuals with mood disorders.55,56 Our findings indicate a negative causal influence between PEF and neuronal activity in the MFG and inferior frontal gyrus. We speculate that PEF influences emotional regulation by modulating respiratory patterns, and improved emotional states contribute to greater stability in the neuronal activity of brain regions associated with emotion management. These findings offer novel insights for the development of interventions or treatments for individuals with mood disorders.
Our findings suggest that PEF, an inexpensive, simple, and non-invasive measure of lung function, may have potential utility as a biomarker of neurological risk. Reduced PEF may indicate neuronal dysfunction which could precede brain structural changes, enabling earlier identification of individuals at elevated risk for neurodegenerative diseases. Moreover, given the accessibility of PEF assessment in routine clinical practice, incorporating its measurement into regular health evaluations may facilitate risk stratification and preventive screening, particularly among populations at risk of cognitive decline or neurodegenerative disorders. In addition, affordable domiciliary PEF monitoring devices also offer promise for clinical translation.
An essential strength of this study is that the MR analysis effectively mitigated confounders bias and reverse causality commonly encountered in observational studies. We utilized large-scale GWAS summary data without analyzing data at the individual level, thereby enhancing the credibility of our results. Our methodologies for selecting IVs adhered to assumptions, 11 effectively eliminating the interference of various confounders.
This study had several limitations. To mitigate the influence of population stratification, the cohort exclusively included individuals of European ancestry. Consequently, the generalizability of our findings to non-European populations may be limited, which could affect the external validity of our results, as the relevance and strength of IVs may differ across populations. Subsequently, the absence of sex stratification in our study may obscure potential sex-specific genetic variations and their unique impacts owing to a lack of relevant data. Although we systematically investigated the linear causal association between lung function and brain neuronal activity, the possibility of non-linear associations, including U-shaped, J-shaped, or threshold effects, cannot be ruled out. The underlying biological processes involved remain to be explored.
Future research should prioritize the inclusion of diverse populations and sex-stratified analysis to validate our findings, while also integrating functional and behavioral assessments, further investigating correlations in brain activity, and conducting longitudinal studies to elucidate the timing and biological mechanisms of lung–brain interactions.
Conclusion
We identified causal associations between PEF and brain neuronal activity. These insights could help identify individuals with lung diseases at a high risk of neurological complications, facilitate early preventive measures, assist clinicians in understanding neurological symptoms in individuals experiencing decreased PEF, and provide insights for future treatment strategies.
Footnotes
Acknowledgments
We express our gratitude to all participants who contributed to this research as well as to the investigators and studies that generated the data used in our analyses.
Ethical statement
This study utilized anonymized, publicly accessible GWAS datasets originally collected from participant studies previously approved by the corresponding ethics committees for human experimentation. Therefore, ethical approval was not applicable.
Author contributions
Conceptualization: RW, GY, YC, and YM. Data curation: QW. Formal analysis: YM, HZ. Methodology: YM, JX, XZ. Supervision: RW, GY, YC. Validation: YM, DS. Visualization: JX, JG, JT. Writing—original draft: YM. Writing—review & editing: NZ, GW. All authors read and approved the final manuscript.
Funding
This study was supported by grants from the Key Programme of the National Natural Science Foundation of China (grant number 82020108016), the General Program of the National Natural Science Foundation of China (grant number 82471974), the International Cooperation and Exchange Program of the National Natural Science Foundation of China (grant number 82411540241), and the Science and Technology Project of Xiamen Medical College, China (grant number K2023-09).
Declaration of conflicting interests
The authors declared no potential conflicts of interest with respect to the research, authorship, and/or publication of this article.
Data availability statement
The original datasets utilized in this study are publicly available summary datasets. These data are available in [GWAS Catalog] at (https://www.ebi.ac.uk/gwas/) and in [BIG-S2] at (![]() ).
).
Supplemental material
Supplemental material for this article is available online.
References
Supplementary Material
Please find the following supplemental material available below.
For Open Access articles published under a Creative Commons License, all supplemental material carries the same license as the article it is associated with.
For non-Open Access articles published, all supplemental material carries a non-exclusive license, and permission requests for re-use of supplemental material or any part of supplemental material shall be sent directly to the copyright owner as specified in the copyright notice associated with the article.