
Abstract
An indigenous breast phantom was customized to optimize the imaging quality of the CT scan according to Taguchi's methodology. A 3D printer made the base gauge of the breast phantom, and the polysmoothTM filament was sprayed. The gauge can be categorized into three major parts vertical and horizontal line pairs, two V-shape slices, and two arrays of nodules with various sizes, then a spherical shell mad by paraffin casting and the sunflower oil was infused as filling material. The Taguchi approach led to the development of a customized measuring device that enabled quantitative assessment aimed at improving the spatial resolution of CT image quality. Five essential factors for operating the CT chest scan (kVp, mAs, FOV, Pitch, and gantry rotation time) were organized according to Taguchi L18(21 × 34) suggestion. Three well-trained radiologists ranked the imaging quality in three discrete time periods according to the imaging quality's sharpness, contrast, and spatial resolution. The derived average, standard deviation, and signal-to-noise ratio of specific factors were reorganized and analyzed from the multiple measurements to propose the optimal CT chest scan protocol recommendation. Accordingly, the optimal suggestion was A1(120 kVp), B3(200 mAs), C2(FOV 350 mm2), D1(pitch 0.516) and E2(rotation time 0.75 s) to fulfill the ALARA principle. In this research, a numerical metric termed the minimum detectable difference (MDD) was introduced to evaluate imaging performance, and its calculated value demonstrated a resolution capability of approximately 1.57 mm.
Introduction
A practical application of a 3D printer in optimizing breast phantom imaging quality was explored according to Taguchi's optimization in this study. Breast cancer is the top one of ten female cancer incidence rates. Its mortality rate ranked the second highest (2655 females in Taiwan died of breast cancer in 2020) among the age of 45 to 54 years old (29.27%) according to the Ministry of Health and Welfare, National Health Insurance Administration cancer registry report for Taiwan in 2020. 1 Specifically, most breast cancer patients are categorized as pathological I or II stages, and the five-year survival rate of new cases of breast cancer patients reached 85.2%, analyzed by the Taiwan Cancer Registry from 2016 to 2020. 2 Furthermore, radiation oncologists prefer to use preoperative computed tomography (CT) images of the chest to plan the scope of radiation therapy for their patients. It is difficult to distinguish the signs of disease without contrast media injection because of the similarity in density between breast tumors and breast tissue. Thus, it is essential to inject contrast media to intensify the imaging of the tumor and help the surgeon accurately identify the location of the tumor and the peripheral invasions. 3
Developing a convenient phantom that is easy for radiologists to adopt in routine chest CT scans is always an unceasing task for medical physicists or biomedical engineers. Chen et al. 4 and Pan et al. 5 adopted the ACR-156 gauge coupled with the PMMA plate to simulate the real breast construction in mammography to fulfill the practical requirements of routine breast scans in clinical examination. In contrast, Lin et al. 6 used the CIRS-016A line gauge, coupled with a PMMA plate, to simulate breast cancer well in the mammography routine examination. Specifically, ACR-156 is composed of three major parts of the line, fat masses, and nodules, to simulate the fibrils, calcification, and mass, whereas CIRS-016A is composed of two sets of line pairs with various gaps among slits to create the discrete intervals. Pan et al. 7 adopted the NDT-CN70589 to quantify the minimum detectable difference (MDD) of spatial resolution of cardiac X-ray, and Peng et al. 8 applied an indigenous PMMA gauge also to quantify the MDD of CT scanned imaging. Either commercial or indigenous gauge has a similar feature that provides a quantified line pair or modulus for further optimization.
Accordingly, an Indigenous breast phantom was fabricated by a 3D printer and optimized by Taguchi methodology to ensure the spatial resolution of the CT chest scan in this study. Taguchi's analysis recommended five essential factors for optimizing CT chest scans, and eighteen combinations of factors were organized to collect the empirical data for further analysis. The correlated calculation and discussion in exploring the derived data and the detail elaboration of fabricating the 3D phantom was all included in this study.
Methods and materials
Taguchi's methodology
Three major algorithms are widely adopted in the Taiwanese academic field: Taguchi methodology, Fuzzy analysis, and Grey relational analysis for the optimization process. The first two are reputed for optimizing single-quality performance based on multiple factors, whereas the latter was specially designed to pursue multiple quality characteristics for various factors. Some researchers have successfully integrated Taguchi's methodology and Grey relational analysis altogether to pursue multiple quality characteristics under Taguchi's recommended orthogonal array to execute the factor combinations and gained great achievement. However, the numerical conversion of demanded quality into a quantitative index from 0.0 to 1.0 is too complicated to fulfill the definition in Grey relational analysis.9,10 Thus, Taguchi's methodology has been widely adopted in optimizing the single-quality characteristic in this study, aiming to obtain an optimal spatial resolution of the indigenous breast phantom. In this work, five primary operational variables for thoracic CT examinations were selected, including tube voltage (A), tube current (B), field of view (C), table pitch (D), and a single gantry rotation (E). As demonstrated in Table 1, Taguchi's orthogonal array of L18(21 × 34) was listed to include five factors for one with two and four with three levels in one standard data matrix format. Table 2 lists the five parameters, each assigned two or three settings. Following the Taguchi design framework, eighteen experimental condition combinations were generated, and images of the breast phantom were acquired on three separate occasions by three experienced radiologic technologists to maintain consistent and dependable results. It is an essential inspection in further ANOVA tests to verify the practicability of the customized breast phantom.11–15
A standard L18 (21 × 34) orthogonal array proposed by Taguchi; the numbers in each column indicate the practical layouts (or levels) of the specific factor (A-E).

A standard L18 (21 × 34) orthogonal array proposed by Taguchi; the numbers in each column indicate the practical layouts (or levels) of the specific factor (A-E).
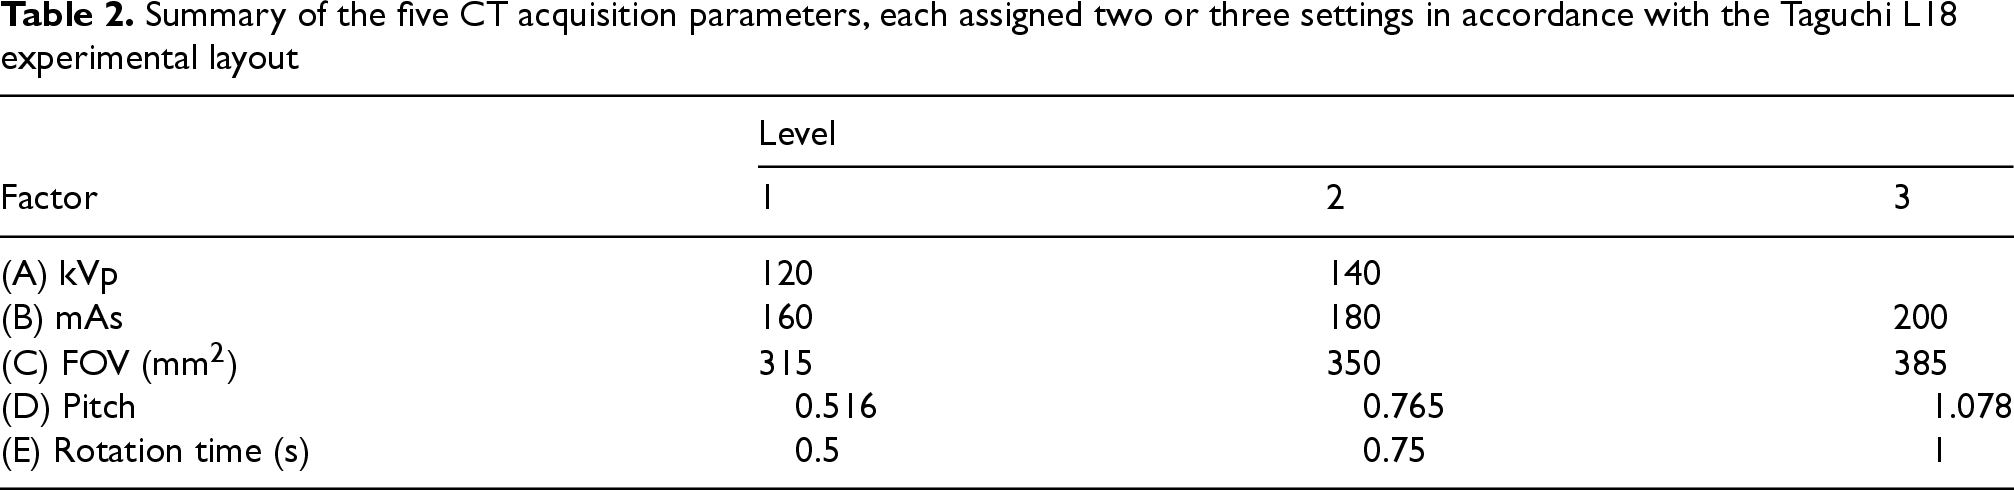
Summary of the five CT acquisition parameters, each assigned two or three settings in accordance with the Taguchi L18 experimental layout
Quantitative gauge
The breast phantom was composed of three major parts: (i) base with quantitative gauge, (ii) outside appearance, and (iii) internal filling material. The base with quantitative gauge was customized from a 3D printer (Snapmaker 2.0 Modular 3D Printer F350, the fine nozzle can spray polysmoothTM filament as precise as 0.4 mm). It contains three parts: (i) vertical and horizontal line pair slices, (ii) two V-shaped slices, and (iii) 14 nodules of various sizes. Specifically, the vertical or horizontal line pairs were composed of four sets of 4-line pairs, each with 0.5, 1.0, 1.5 and 2.0 mm gaps among each other. The slice thicknesses of vertical and horizontal sets were 0.5 and 0.7 mm, respectively, whereas the length and depth of the two line pair groups (vertical and horizontal) were both 10.0 mm. Two V-shaped slices had 0.5 and 0.7 mm thicknesses, with respective widths of 8.45 and 8.00 mm and the same length of 40.46 mm. In addition, the 14 nodules arranged as 7 × 2 arrays had diameters of 0.60, 0.70, 0.80, 0.90, 1.00 and 1.10 mm. Figure 1 illustrates the following details: (A) Snapmaker 2.0 Modular 3D Printer F350, (B) the designation chart of the circular base gauge made of polysmoothTM filament; (C) polysmoothTM filament sprayed from a nozzle with precision up to 0.4 mm, and (D) the customized base gauge of the breast phantom.
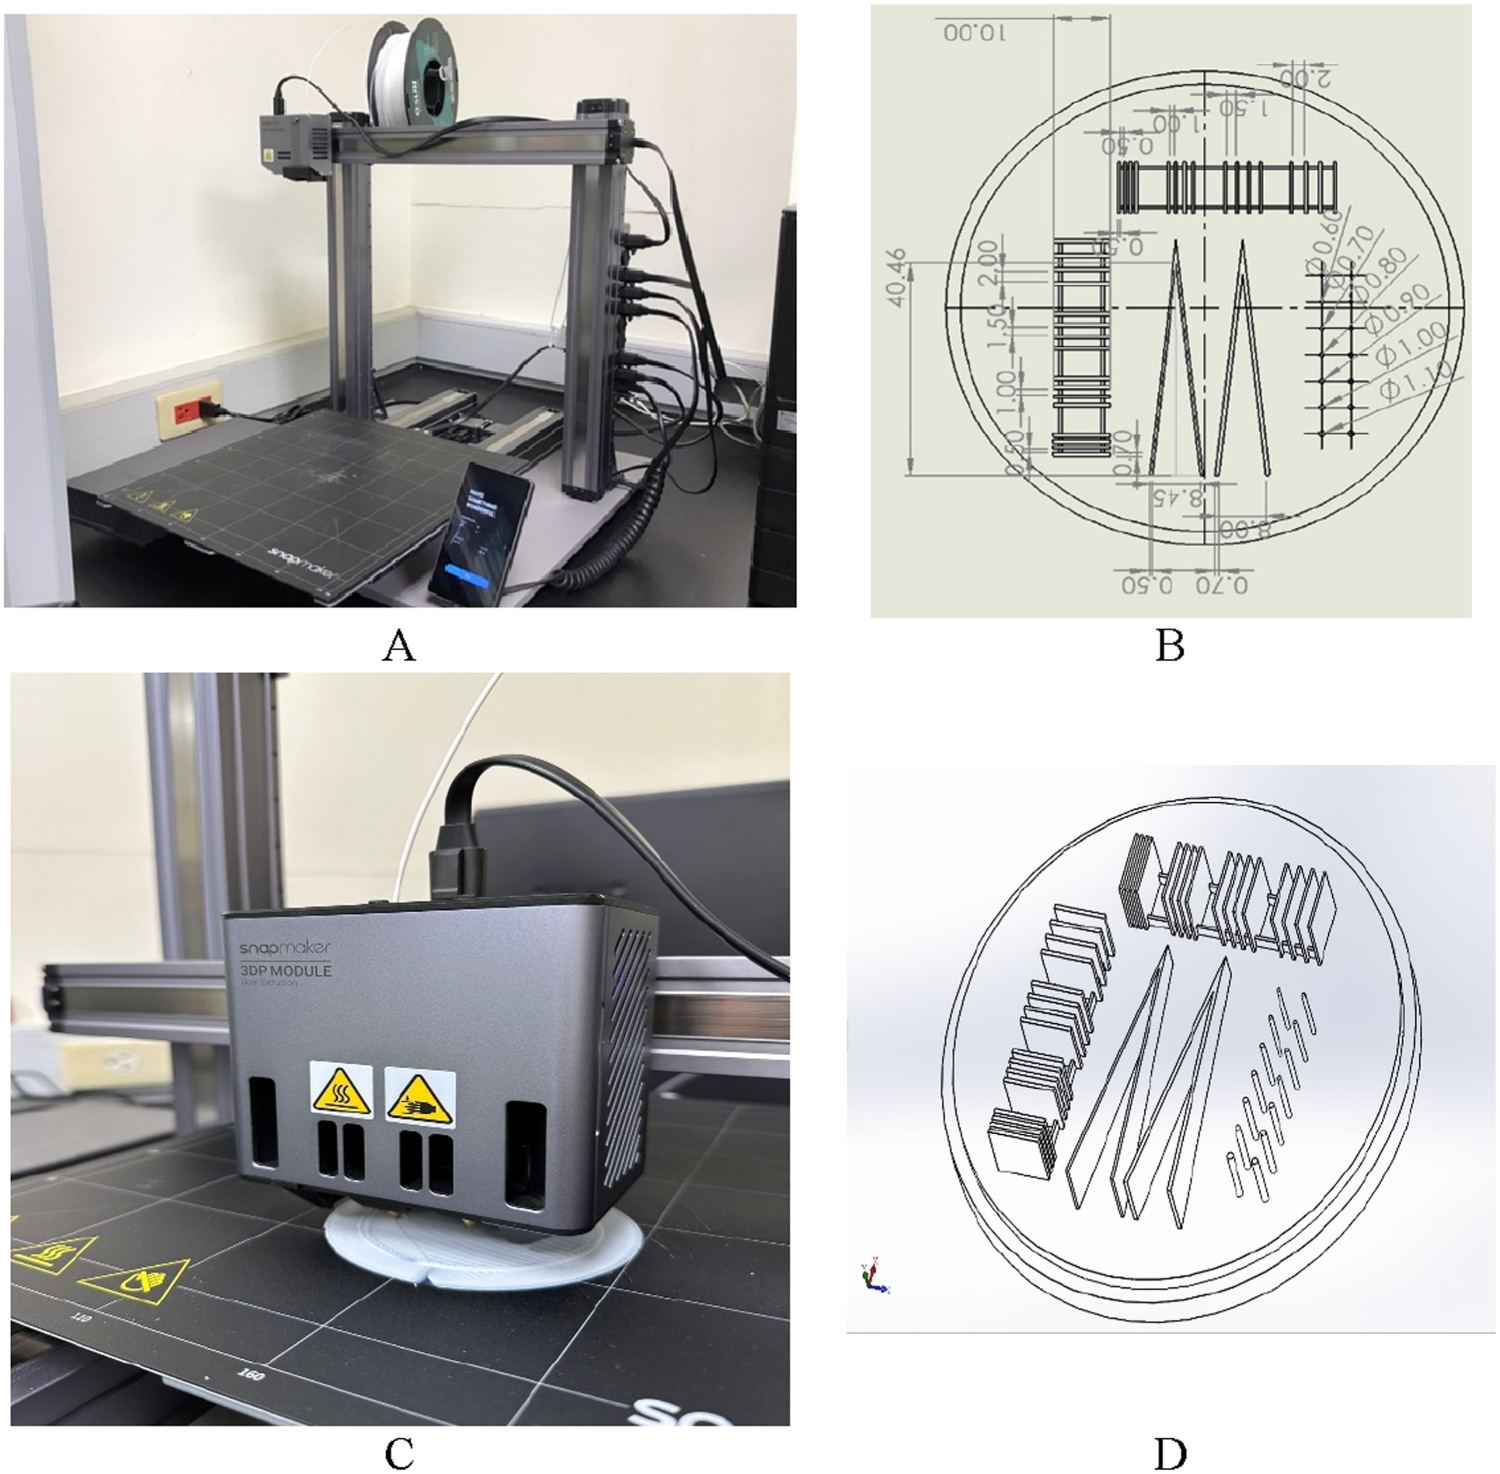
(A) The 3D printer, snapmaker 2.0 modular 3D printer F350, (B) the designation of the circular base, the material being polysmoothTM filament, (C) polysmoothTM filament was sprayed from a nozzle with precision up to 0.4 mm, (C) the 3D printer, snapmaker 2.0 modular 3D printer F350, (D) the customized base of the breast phantom.
The outside shell of the breast phantom is designed according to a half sphere, as indicated in Figure 2(A). The spherical shell had a radius of 85.0 mm and a 1.0 mm thick shell. It is customized by paraffin casting. The top of the breast phantom was specially made a teat to fill the oil inside the phantom and sealed with a cap to prevent any air bubbles remained inside and causing any artifacts in CT scanning, (B) the product of a 3D breast phantom. The base gauge is made of polysmoothTM filament, and the spherical shell was made by paraffin casting.

(A) the half sphere had a radius of 85.0 mm and a 1.0 mm thick shell. It is customized by paraffin casting. The top of the breast phantom was specially made a teat to fill the oil inside the phantom and sealed with a cap to prevent any air bubble remained inside and causing any artifacts in CT scanning, (B) the product of a 3D breast phantom, (C) the specific CT facility (Philips Brilliance 64-slice CT) was located in the Taichung Armed Forces General Hospital, (D) the breast phantom was assembled on the top of a 50-kg-female-phantom for CT scanning. The female phantom was fabricated according to the ICRU-48 report.
The filling oil inside the breast phantom was made from sunflower olive, or canola oil. Eventually, sunflower oil was the most suitable one for its pure and clean quality by nature. Eventually, the density and CT scanned mean HU of base gauge (polysmoothTM filament), shell (paraffin), and sunflower oil are 1.05, ∼0.9, ∼0.9 [g·cm−3] and 13, −110, −120, which is similar to the mammary gland, skin, and adipose tissue, respectively, inside the breast.
Chest CT scan
The major CT scan facility (Philips Brilliance 64-slice CT) was in the Taichung Armed Forces General Hospital. The CT had 64 arrays of detectors with 0.625 mm in diameter. The heat capacity of the X-ray tube was 8 MHU. Note that the other factors were held in the CT scanning to maintain its reliability in optimizing the process. This is essential in Taguchi's methodology to eliminate disturbance caused by artificial interference. The other factors of CT axial scan protocols were maintained as no Dose Reduction function, matrix size 512 × 512, image filter: smooth type B, detector coverage: 64 × 0:625 mm, 5-mm thickness, and 5-mm increment. The CT scan protocol was slightly revised based on a 64-slice CT chest scan performed in the same hospital. As depicted in Figure 2 (C), the specific CT facility (Philips Brilliance 64-slice CT) was in the Taichung Armed Forces General Hospital, (D) the breast phantom was assembled on the top of a 50-kg-female-phantom for CT scanning. The female phantom was fabricated according to the ICRU-48 report. 16
Image quality scoring and signal-to-noise (S/N) evaluation
By applying a Taguchi orthogonal design, 18 different breast phantom CT image sets (see Tables 1 and 2) were produced. These images were independently reviewed in a double-blind manner during three separate sessions by three experienced radiologists to ensure consistent evaluation. Based on criteria such as contrast, edge clarity, and spatial detail, each radiologist assigned a ranking from 1 (lowest quality) to 18 (highest quality). The average score from the reviewers was then used to calculate the S/N value as described in
8
:

In this calculation, std represents the standard deviation and Avg denotes the mean of the nine scores (3 observers × 3 sessions) assigned to each experimental group. A lower standard deviation together with a higher mean indicates superior image performance; theoretically, the optimal setting would achieve both a high average rating and minimal variability across evaluations.
ANOVA test is an essential requirement in the optimized process. The test reveals not only the quantified contribution of a specific factor but the significance of that factor as well. In the most optimized process, researchers only accomplish the signal-to-noise analysis to ascertain the dominant or minor factor and ignore further ANOVA inspection. However, in some cases, dominant factors only make minor contributions to quality characteristics (inspected by the variance of factor) or cannot pass the F-test to prove their significance in reality. This indicates that either the preset level range of factors was too narrow or inappropriate factor selection was made in advance, yielding the experimental data without apparent significance.
Results
Raw data acquisition
Figure 3 demonstrates 18 original images of breast phantom through the CT scan. The image quality was ranked according to its sharpness, contrast, and spatial resolution of the specific line pairs, V-shape slices, or multiple nodules. Table 3 shows all the collected ranking order of breast imaging by three well-trained radiologists at three discrete times. The ranking was given from 1 (the worst) to 18 (the best). Thus, the total average is 9.5, and the SD (standard deviation) is derived from 9 (3 × 3) trials and S/N. Accordingly, the correlated average (Avg), standard deviation (SD), and signal-to-noise ratio (S/N) after reorganizing and analyzing every specific factor is depicted in Figure 4.

The 18 original imaging of breast phantom through the CT scan. The image quality was ranked according to its sharpness, contrast, and spatial resolution of the specific line pairs, a V-shape slice, or multiple nodules.

The correlated average (Avg), standard deviation (SD), and signal-to-noise ratio (S/N) after reorganizing and analyzing every specific factor.
Outcomes based on nine separate rating scores. The Sd column lists the standard deviation calculated for each set of nine assessments, and the corresponding S/N values are computed using Eq. (1).
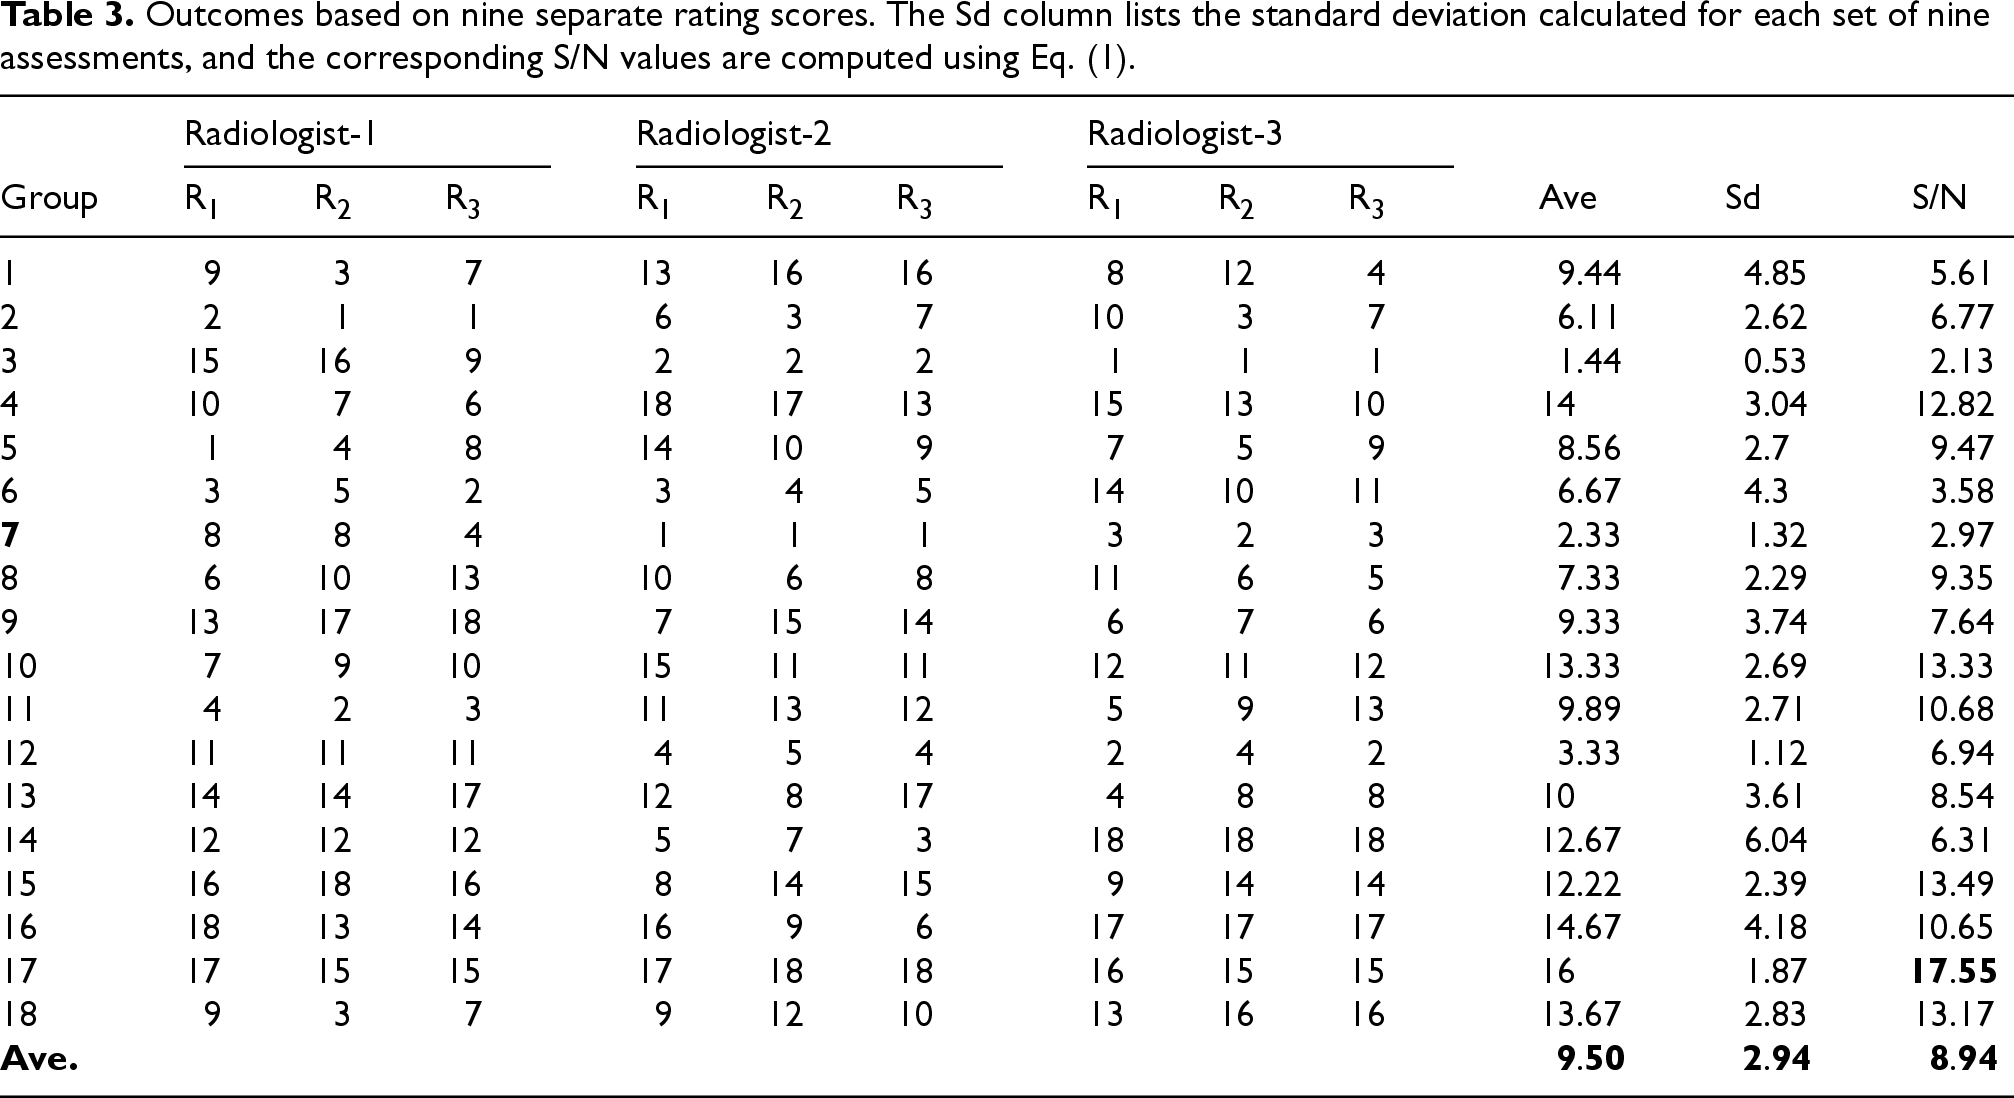
Table 4 shows the derived ANOVA test of every factor and accompanied error in this study. As implied, factor A (kVp) was the most dominant factor, and factor D (Pitch) and B (mAs) were the second and third dominant factors, respectively, whereas E (gantry rotation time) made no significant contribution to the imaging quality. The quantitative contribution of factors A, D, or E to the imaging quality was 18.9%, 12.5%, and 9.3%, respectively. In contrast, factor E provided only 0.3%, which barely made any difference; thus, it also failed to pass the F-test (cf. Table 4).
The confidence values for each parameter, reflecting their influence on the CT scanning setup. Any level above 99 percent indicates that the parameter plays a statistically meaningful role.

The confidence values for each parameter, reflecting their influence on the CT scanning setup. Any level above 99 percent indicates that the parameter plays a statistically meaningful role.
Verifying the breast phantom's optimal imaging quality
Taguchi's recommendation can only provide the optimal factor combination. Nevertheless, additional validation is required to confirm the practicality of this setting. Based on the interpretation of Figure 4 and taking into account the interrelationships among parameters, the provisional optimal configuration was identified as A2 (140 kVp), B3 (200 mAs), C2 (FOV 350 mm2), D1 (pitch 0.516), and E2 (0.75-s gantry rotation). Then a compromising suggestion proposed by the health physicist is to reduce the radiation dosage in fulfilling the ARALA (as low as reasonably achievable) if kVp can be lowered to 120 to minimize the unnecessary dose. Therefore, an alternative recommendation of factor combination was suggested as A1(120 kVp) and held the rest setting.
MDD examination
A well-known quantitative index MDD (minimum detectable difference) was adopted in this study to judge the imaging quality, using the same definition as in previous publications8,15–19:

In this expression, X1 and X2 refer to the peak centers of the first and second maxima, respectively, and FWHM denotes the full width at half of the peak height. To determine the MDD between two adjacent signal peaks obtained from the V-shaped slice SPECT profile, the intensity dip separating the peaks was progressively modified, allowing a quantitative estimation of the effective boundary width. Moreover, a smaller MDD value is desirable in CT imaging, as it reflects improved capability for distinguishing fine vascular structures within the brain.
As illustrated in Figure 5, the CT scan imaging was displayed according to four different combinations as follows: (A) conventional, (B) the highest S/N among original L18, G17, (C) optimal combination, and (D) optimal but lower the kVp from 140 to 120. The correlated calculation of MDD and the factor combinations of various settings were implied in Tables 5 and 6. As demonstrated, the MDD drops when the kVp is reduced from 140 to 120. However, the accompanied radioactive dose was also largely decreased, thus we still recommend the optimal setting is held as A1(120 kVp), B3(200 mAs), C2(FOV 350 mm2), D1(pitch 0.516) and E2(rotation time 0.75 s). The calculated MDD is reduced from 1.52 to 1.57 mm, corresponding to the lower kVp; the solid SPECT profile of the V-shape slice from the CT chest scan was also drawn in Figure 6. The four profiles of SPECT make no significant difference. Thus, only the quantified MDD can identify the tiny difference and ensure the optimal imaging quality of 0.01 mm.

Ct scan images for the four different combinations as (A) conventional, (B) the highest S/N among original L18, G17, (C) optimal combination, and (D) optimal for kVp reduced from 140 to 120.
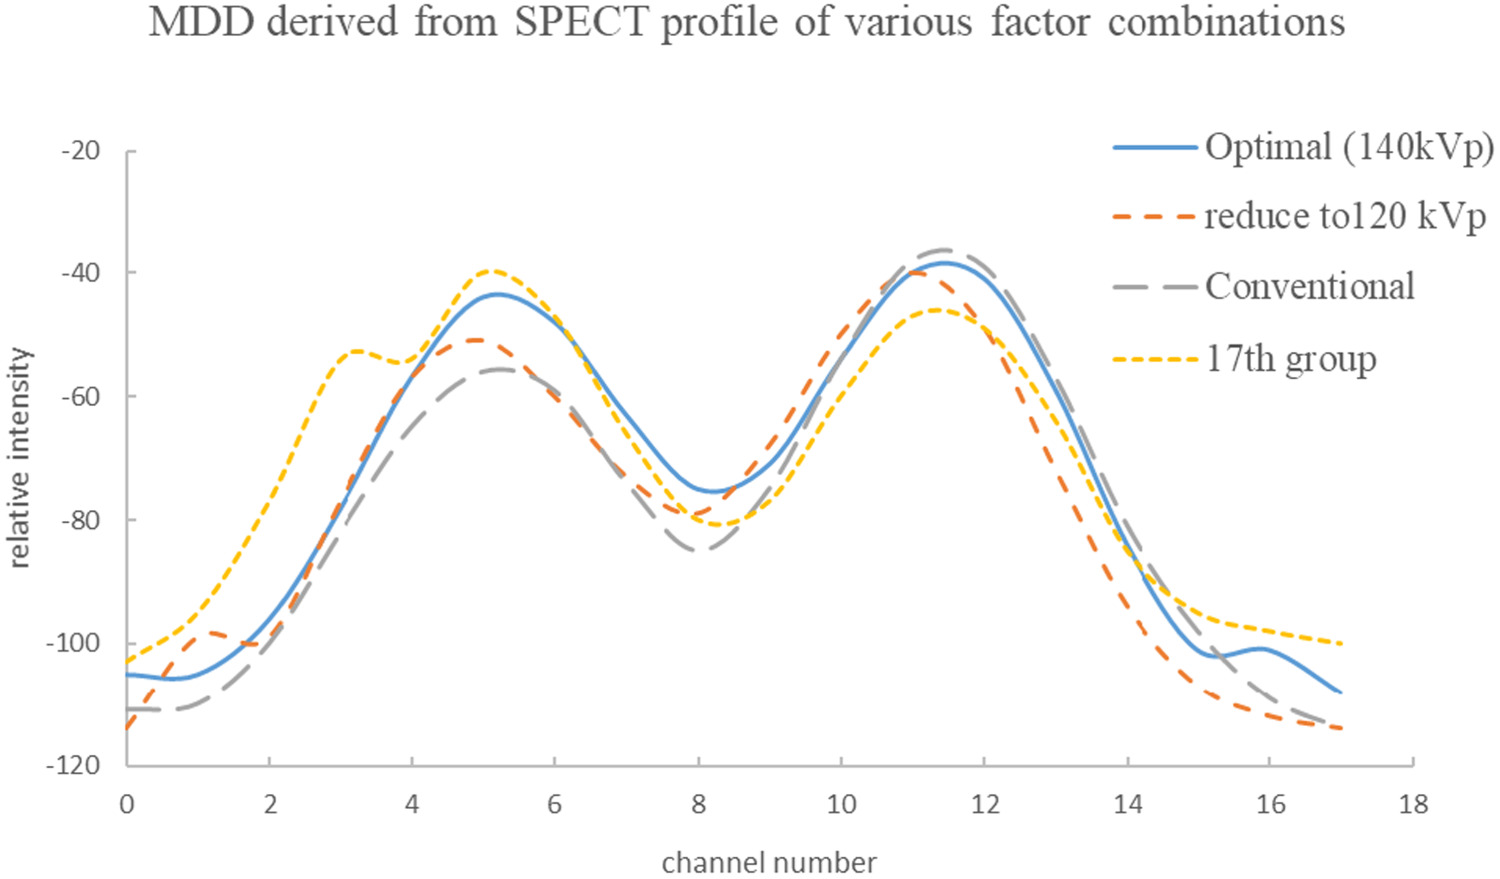
The solid SPECT profile of the V-shape slice from the CT scan. The four profiles of SPECT make no significant difference; thus, only the quantified MDD can exactly identify the tiny difference and ensure the optimal imaging quality to the order of 0.01 mm.
Precise calculation of MDD for four kinds of SPECT profiles from CT chest scan. The MDD exists only if

Comparison of MDD results for the standard protocol, the best-performing original configuration (group 17), the optimized parameter set, and the modified optimal setup using 120 kVp instead of 140 kVp.

The unique shell design of the breast phantom was revised from the original drawing. The original one is a cylindrical shell, as depicted in Figure 7. The vertical-like shell traps the air bubble while the oil fills the shell, which causes a void and blocks out the imaging. The revised onion-like shell successfully overcame the problem and pushed the air bubble uplifted gradually along the spherical shell out of the teat and then sealed. Therefore, there is no void region in the real CT scan. The breast phantom perfectly fulfills the practical need in routine CT chest examination. The complete product of breast phantom is always ready for scanning without any additional PMMA plates to stack in simulating the real breast. The following illustrations are provided in Figure 7: (A) the inappropriate designation of breast phantom shell; the air bubble cannot uplift successfully to the top, thus creating an unwanted void in the CT scan, (B) the product of the cylindrical-form shell, and (C) the real CT scan imaging of the inappropriate breast phantom.

(A) the inappropriate designation of the breast phantom shell. The air bubble cannot be uplifted successfully to the top, thus creating an unwanted void in the CT scan, (B) the product of the cylindrical-form shell, and (C) the real CT scan imaging via inappropriate breast phantom.
Summary of MDD measurements reported using different gauge designs across the present work and previously published investigations.

The MDD values obtained in this work were benchmarked against previously reported results. As summarized in Table 7, the locally developed V-shaped slit device yielded MDD measurements of 1.43 mm and 2.65 mm under two different CTA acquisition settings. The former corresponded to examinations performed for peripheral arterial occlusive disease, while the latter was produced using a liver phantom. For comparison, reported CTA spatial resolution values varied according to phantom characteristics, with MDDs of 2.15, 2.32, and 1.87 mm for simulated body weights of 50, 70, and 90 kg, and 1.71, 2.12, 2.44, and 2.58 mm at heart rates of 0, 60, 75, and 90 beats per minute. Additionally, the configuration using five off-center circular structures posed a more demanding challenge than the V-shaped gauge, resulting in an MDD of approximately 2.26 mm. In contrast, the proposed breast phantom functioned as a complete standalone design without the need for additional stacking components and achieved a spatial resolution of about 1.57 mm while maintaining a clinically acceptable radiation exposure.
Conclusion
An indigenous breast phantom was customized to optimize the imaging quality of the CT chest scan according to Taguchi's methodology. The breast phantom was composed of three major parts: (i) the base gauge with multiple quantitative line pairs, (ii) a V-shaped slice, and (iii) nodules fabricated by a 3D printer. The outer shell was cast with paraffin, and the sunflower oil was infused as filling material. The breast phantom was an all-inclusive product ready for the CT chest scan. Five factors, namely kVp, mAs, FOV, Pitch, and Gantry rotation time, were organized into 18 combinations according to Taguchi's recommendation to acquire the CT scanned imaging of breast phantom, then ranked by three well-trained radiologists according to sharpness, contrast, and spatial resolution. Eventually, the optimal factor combination was determined as A1(120 kVp), B3(200 mAs), C2(FOV 350 mm2), D1(pitch 0.516) and E2(rotation time 0.75 s) to satisfy the ALARA principle. The derived MDD can be as precise as 1.57 mm.
Footnotes
Acknowledgements
None to report.
Ethical approval
This study did not involve human or animal subjects directly. All simulations were based on hypothetical or previously published pharmacokinetic parameters. Therefore, ethical approval was not required.
Author contributions
Ying-Liang Chou, Kai-Yuan Cheng and Lung-Fa Pan conceived and designed the study. Fu-Tsai Chiang, Ching-Hsiu Ke and Jia-Hua Hsu performed the investigation and data collection. Chun-Chieh Liang, Samrit Kittipayak provided resources. Lung-Kwang Pan conducted the formal analysis and visualization. The manuscript was drafted by Lung-Fa Pan and all authors contributed to reviewing, editing, and final approval. Lung-Fa Pan supervised the project and acquired funding.
Funding
The authors highly appreciate the financial support of this study by the Feng Yuan Hospital, Ministry of Health and Welfare of the Republic of China, Taiwan, under contract number FYH-112-15.
Declaration of conflicting interests
The authors declared no potential conflicts of interest with respect to the research, authorship, and/or publication of this article.
Data availability
The MATLAB code used for simulation in this study is available from the corresponding author upon reasonable request.
Copyright and originality
The authors declare that this manuscript is original, has not been published previously, and is not under consideration for publication elsewhere. All authors have read and approved the final version of the manuscript.