
Abstract
Utilizing the Samples of Anonymized Records from the UK 2001 Census, this article presents an analysis of the differential experiences of Muslims in the British labour market as both minority- and majority-group ethnicities in Britain. Using multinomial modelling, this article examines the class distribution (using the NS-SEC scheme) given levels of education and gender. The analysis of ethnicity, age, gender, marital status and number of children in relation to employment suggests that there are no universal characterizations that can be founded on any of these independent variables. Although Pakistanis dominate the demographic profile they are not likely to suffer the greatest. Muslim Black Africans experience harsher conditions and it could be argued that there is an ethnic colour penalty that is greater than the ethnic religion penalty for Muslims. The forces of colour racism remain omnipotent, even when testing for the impact of religion on patterns of employment inequality.
Introduction
Research on the experiences of Muslims in the labour market tends to present this group as a homogeneous entity, paying little attention to the array of internal ethno-cultural differences among this body of people (Anwar, 2008; Peach, 2005, 2006). That is, in discussing the socio-economic profile of Muslims in England and Wales, Peach (2006) has argued that Muslims are the most disadvantaged group; educationally they are poorly qualified and occupationally they are the most under-represented group within the highest occupational class of managerial and professional occupations. Other studies have explored the ethnic and cultural differences among the Muslim population in Britain, but have focused only on the three predominant South Asian Muslim groups: Pakistanis, Bangladeshis and Indians (Abbas, 2003; Brown, 2000; Lindley, 2002; Model and Lin, 2002; Modood, 2005). Most of these studies have reached a similar conclusion suggesting that Muslims in general are the most disadvantaged group in relation to educational achievement and occupational attainment. Additionally, most of these studies have made a clear association between the disadvantage of Muslims and their faith, suggesting that Muslims seem to pay an additional penalty in the labour market due to their religious background (Lindley, 2002), presenting Muslims as being particularly disadvantaged in the British labour market. Some of the above studies such as that by Brown (2000) and a more recent study by Khattab (2009), however, have pointed out that some Muslim groups do not follow the same pattern that characterizes the majority of Muslims in Britain. Moreover, it has been suggested that South Asian Muslim Indians have a stronger socio-economic profile than many other South Asian Muslim groups and which is even relatively better than some of the South Asian non-Muslim groups, such as Sikh Indians.
This article seeks to explore the ethnic differences in employment within the Muslim population in England and Wales. In other words, the article will determine the ‘losers’ and the ‘winners’ among Muslims in the British labour market, focusing on eight different Muslim ethnic groups. It is argued that these groups have different pre-migration histories as part of their varying post-war UK migration periods as well as differentiated patterns of settlement in Britain. Firstly, the article provides a migration history and sociological account of these groups of interest. Secondly, it presents the methodological framework for this research. Thirdly, the descriptive and theoretical analyses of the UK 2001 Census data in relation to Muslim patterns of employment are provided. In conclusion, this article argues that it is important to deconstruct the notion of ‘the Muslim’ so as to generate analytically detailed analyses of sub-group experiences which often differ more widely than the more simplistic notion of a Muslim/non-Muslim dichotomy, and in the case of this study, use such analyses to acquire an understanding of the impact on employment.
Muslims in Britain: migration history, ethnic profile and employment
According to the 2001 Census, there are about 1.6 million Muslims (about 3% of the population) living in the UK, making Islam the second biggest faith after Christianity. Although considerable growth of the Muslim population has occurred in the last 50 years (Peach, 2005), with post-war immigration from India, Pakistan and later on from Bangladesh (Ansari, 2004; Hussain, 2008), a more significant presence of Muslims in Britain has been recorded since the beginning of the 19th century with the arrival of Muslim seamen and traders from the Middle East, especially Yemen, and settling around the major ports such as Cardiff, Liverpool, South Shields and Hull. Indeed, the first mosque in Britain was established in Cardiff in 1860 (Anwar, 2008). It is in the post-war period that Muslims began arriving in Britain in significant numbers and it is possible to divide this period from the 1950s to the early 2000s in terms of three phases of migration to Britain.
The first begins in the 1950s and runs through to the 1960s, during which Muslim migrants from India, Pakistan and later on from East Pakistan (or what has become known as Bangladesh after the separation from Pakistan) came. These migrants were recruited to fill specific labour demands in certain declining industrial cities in the Midlands and the North (Abbas, 2007; Hussain, 2008). The second phase covers the period from the early 1970s to the late 1980s in which elite Muslim Arabs settled in London and other major British cities such as Birmingham, Manchester and Glasgow. During this period, a process of family unification also took place (i.e. among the East Pakistani/Bangladeshi males who had arrived earlier on in the 1960s and early 1970s). The third phase begins in the 1990s and can be described as the age of the ‘refugee and asylum seeker’. Young Muslims, predominantly male and single, have arrived in the UK from Iraq, Somalia, Bosnia, Albania and Kosovo. During this phase, not only has the number of Muslims in Britain increased, but also the diversity of the Muslim population has increased in terms of ethnicity, nationality and colour. For example, White Muslims have become a relatively large group comprising approximately 12 per cent (179,000) of the Muslim population (Peach, 2006).
The different phases have revealed different types of migrants arriving in Britain because of various pull-push factors (Nielsen, 2004; Vertovec and Rodgers, 1998). Therefore, while one can refer to second and third generations of Muslim Indians and Muslim Pakistanis in Britain, one can only refer to the first generation of White Muslims from Eastern Europe or the first generation of Somalis. In addition, while many Arabs have arrived from a wealthy background seeking to establish businesses, most of the Bangladeshis have arrived as economic migrants from poor socio-economic backgrounds. While some of the Muslim groups such as Black African Muslims and South Asians are visible, many others are less visible, such as the White British Muslims and other White Muslims.
According to the 2001 UK Census (see Table 1 above), the largest Muslim ethnic group is Pakistani, accounting for about 43 per cent of the Muslim population, followed by Bangladeshis (about 17%) and Indians (about 9%). Thus, the South Asian Muslims account for about two-thirds of the total population of Muslims in Britain (ONS, 2001). White Muslims account for about 12 per cent, including one-third White-British (about 4%). As Peach (2006) states, the White-British Muslims include those of Turkish-Cypriot origin as well as White converts to Islam. The other White-Muslim group is more heterogeneous in terms of ethnic and national origins, and includes Turks, Iranians, Arabs, Albanians, Bosnians and Muslims from Kosovo. About 6 per cent of the Muslim population in Britain are Black Africans and include Nigerians and Somalis, as well as people from Kenya. Other Asians account for the other 6 per cent and include people from countries such as Malaysia, Thailand, Indonesia and Afghanistan.
Muslims by ethnic group, 2001 UK Census
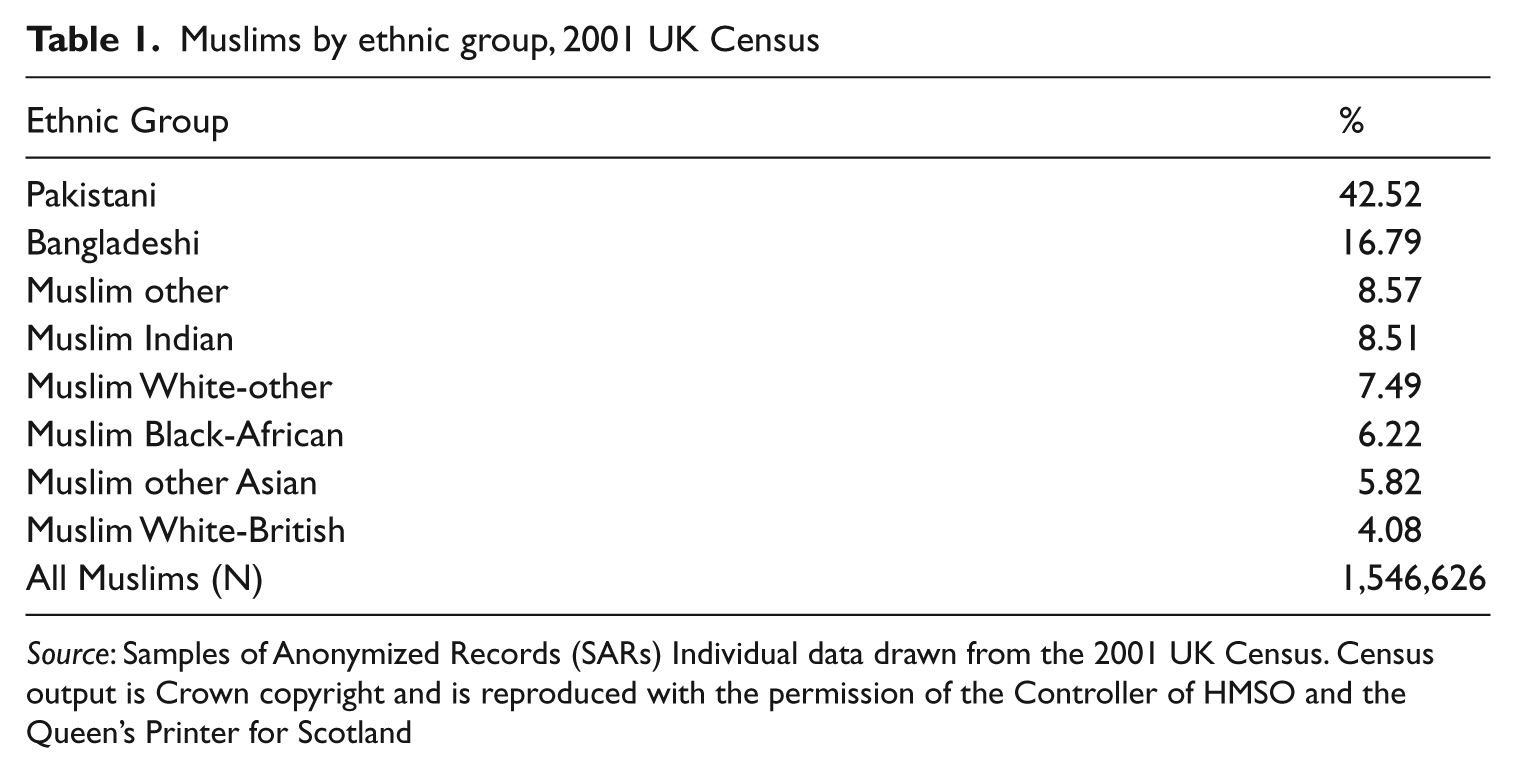
Source: Samples of Anonymized Records (SARs) Individual data drawn from the 2001 UK Census. Census output is Crown copyright and is reproduced with the permission of the Controller of HMSO and the Queen’s Printer for Scotland
With respect to employment among Muslims, previous research has pointed out that Muslim men, and more so women, are likely to face an extra penalty in the labour market due to racism and other forms of discrimination (Ahmad and Modood, 2003; Brown, 2000; Model and Lin, 2002; Modood, 2005; Modood et al., 1997). A recent study by Khattab (2009) has shown that Muslims experience two different forms of racism in the labour market. In the first, all Muslims including White Muslims would experience a religious penalty, whereas in the second non-White Muslims face colour racism. According to Berthoud (2000), the penalties in the labour market faced by ethnic minorities (including Muslims) can take one or more of the following types: lower earnings, longer period of unemployment, lower returns on their qualifications and slower progress and job promotion. While other non-Muslim ethnic groups such as Black Caribbean and Sikh Indian do also experience some ethnic penalties (Heath and McMahon, 1997), it seems that the penalties faced by Muslims are harsher (Khattab, 2009). Some recent studies focusing on the labour market outcomes among Muslims have shown links between their disadvantage and their concentration in highly deprived areas such as the concentration of Muslim Bangladeshis in boroughs such as Tower Hamlets and Newham in London (Clark and Drinkwater, 2007; Johnston et al., 2010).
These studies have highlighted the role of space and segregation in determining people’s employment opportunities, explaining the employment disadvantage of some Muslim groups by the lack of job opportunities accompanied by other social and economic problems. While the observed impact of segregation on employment opportunities in general is negative, some studies have suggested that some Muslim women would benefit economically from living in ethnically segregated areas, in which ethnic economies are found (Bradley et al., 2007; Johnston et al., 2010). According to Bradley et al. (2007), ethnic economies tend to offer more protected labour markets and freedom from racism than is found in the mainstream labour market.
However, most Muslim women do not rely on the ethnic economy in seeking jobs due to limited job opportunities there. They apply for jobs in the mainstream labour market as do other women. Previous research focusing on these women has pointed out that they are likely to face racist abuse and discrimination on the grounds of colour, culture and gender. It was found that Muslim women wearing the hijab would suffer most (Dale, 2008; Dale et al., 2002; Lindley et al., 2006).
Data and methods
The data used in this study were obtained from the 2001 UK Census: The Samples of Anonymized Records (SARs). The analysis has been carried out using all 3 per cent (included in the SARs) of men and women aged 20–59 who ticked the box ‘Muslim’ when answering the voluntary question on religion in the Census in 2001. This sample includes 27,603 respondents, where 51 per cent (14,140) are men and 49 per cent (13,463) are women.
Dependent variable
The dependent variable in this study is the National Statistics Socio-Economic Classification (NS-SEC). The NS-SEC is created based on the Goldthorpe Scheme (Erikson and Goldthorpe, 1992). It combines information on occupations coded according to the Standard Occupational Classification 2000 (SOC2000) and information on the employment status of respondents (i.e. whether an employer, self-employed or employee; whether a supervisor, manager etc). The NS-SEC uses the information on employment status to measure employment relations and conditions within each occupational class (Rose and Pevalin, 2005). While the standard classification uses an eight-class version, five-class and three-class versions can also be used. In this article, following Khattab (2009) and for the sake of simplifying the multinomial models, a three-class version will be used. As recommended by the Office for National Statistics (ONS), the never worked and long-term unemployed will be treated as a separate class. Hence, the classes included in the analysis are: managerial and professional occupations (MPO); intermediate occupations (IO); never worked and long-term unemployed (NWLT); and routine and manual occupations (RMO). The latter class was used as a reference group.
Independent variables
The analysis
Since the dependent variable has four categories, a multinomial regression model was used to examine the impact of ethnicity and the other independent variables as listed above. This model was finalized following a descriptive analysis of the main independent variable in conjunction with the dependent and other independent variables. In the next section the results of the study will be presented beginning with the descriptive analysis. Since there are significant differences between men and women, especially in relation to their labour market profiles, the final model is presented for both sexes.
Research findings and analysis
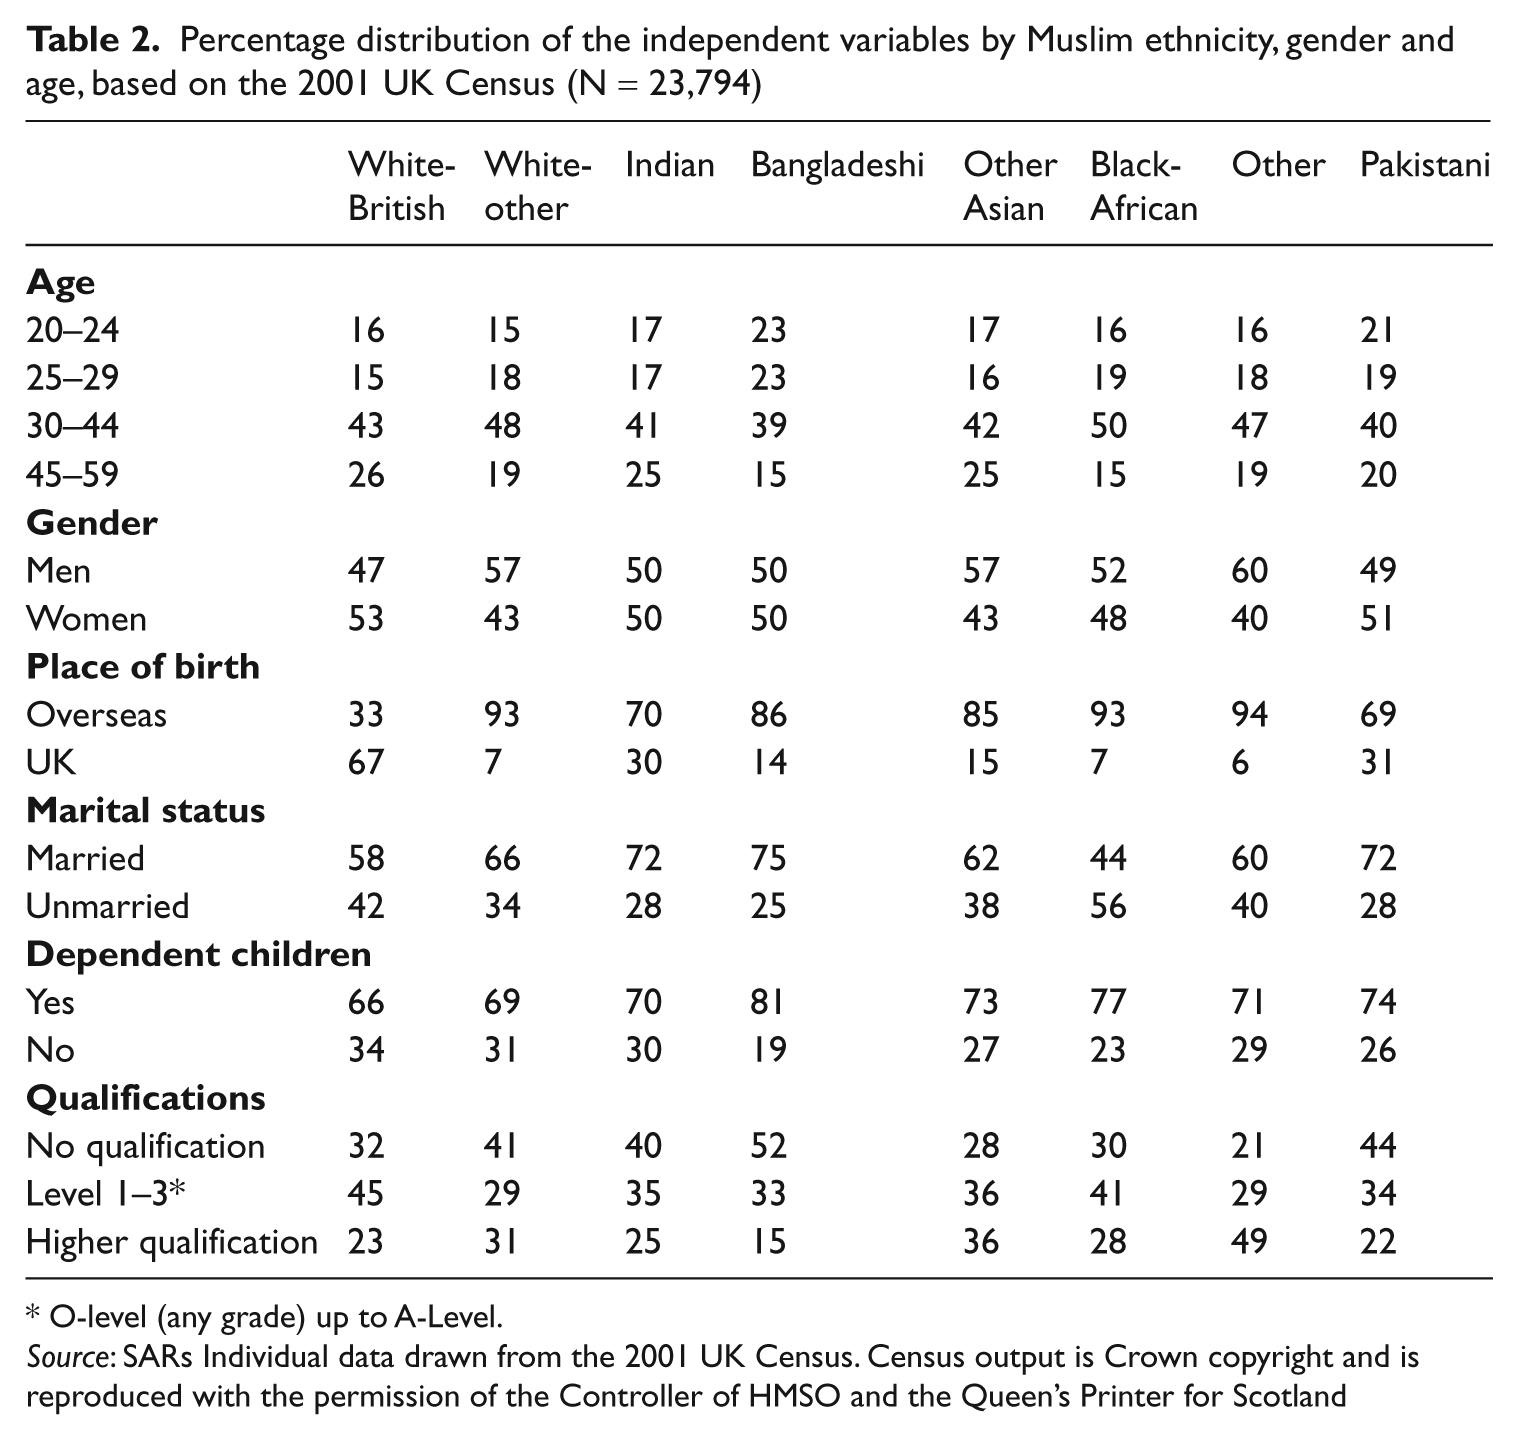
This section begins by describing the independent variables (Table 2), and highlighting the main differences or similarities between these ethnic groups. For the age variable it is seen that Bangladeshis are the youngest population, with just below half under the age of 30. At the other end of the age spectrum, Muslim White-British, Muslim Indians and other Muslim Asians have the highest proportion (about a quarter) of people aged 45–59. The Muslim White-other, Muslim Black-African and Muslim-other groups tend to have a similar age structure, with about half of the people in these groups falling within the age cohort, 30–44. The remaining group, namely Pakistani, have a slightly different age structure with 40 per cent of the Pakistanis aged 20–29, another 40 per cent aged 30–44 and the remaining 20 per cent aged 45 or above. That is, the Pakistani group has the second highest proportion of people aged 29 or below. In terms of sex, Table 2 shows significant differences between the groups with ‘others’ being at one end of an imbalanced division of 60 per cent men and 40 per cent women and with Muslim White-British at the other end with 47 per cent men and 53 per cent women. The other Asian and White-other groups have more men than women (57% vs 43% within each group respectively), followed by the Muslim Black-African group with 52 per cent men and 48 per cent women. Bangladeshis and Muslim Indians have the same proportions of men and women, while Pakistanis have slightly fewer men than women (49% vs 51%).
Percentage distribution of the independent variables by Muslim ethnicity, gender and age, based on the 2001 UK Census (N = 23,794)
O-level (any grade) up to A-Level.
Source: SARs Individual data drawn from the 2001 UK Census. Census output is Crown copyright and is reproduced with the permission of the Controller of HMSO and the Queen’s Printer for Scotland
In relation to the place of birth variable, the majority (about two-thirds) of the Muslim White-British population were born in the UK, while the majority of people among the other groups were born overseas. As expected, Pakistanis and Indians have a relatively high proportion of people born in the UK (just below one-third) indicating their early arrival into the UK compared to other ethnic groups. With the exception of the Muslim Black-African group, the majority of people in most of these groups are married and have dependent children. Interestingly, while the Muslim Black-African group has the lowest proportion of married people (less than half: 44%), they have the second highest proportion (after Bangladeshis) of families with dependent children (77%). The reason for that is the relatively high proportion of lone parents in the Muslim Black-African group (22%). 1 The second highest proportion of lone parents can be found among the Muslim White-British group (13%). Arguably, this is mainly due to women who are actually separated, but are legally still married.
Educational qualifications
Table 2 shows that the Muslim-other and Muslim other Asian groups are the groups with the highest educational profiles. Almost half of the Muslim-other group hold degrees or above, and they have the lowest proportion among those with no qualifications, followed by Muslim other Asians with just above one-third holding degrees or above and just over a quarter without any qualifications. At the lower end of the qualifications scale, Bangladeshis and Pakistanis appear as 52 per cent and 44 per cent having no qualifications. In terms of higher qualifications they appear to be under-represented, with only 15 per cent and 22 per cent (respectively) holding these. The Muslim White-British group is placed just before the latter two groups with about a quarter (23%) holding degrees or above but as high as about one-third (32%) appearing to have no qualifications. Muslim Indians seem to fare slightly better in relation to higher qualifications than the Muslim White-British, but much worse in terms of the proportion of those lacking any qualifications at all. The remaining two groups, Muslim Black-African and Muslim White-other, are placed above Indians but below the Muslim-other and Muslim other Asian groups.
The National Statistics Socio-Economic Classification (NS-SEC) and sex
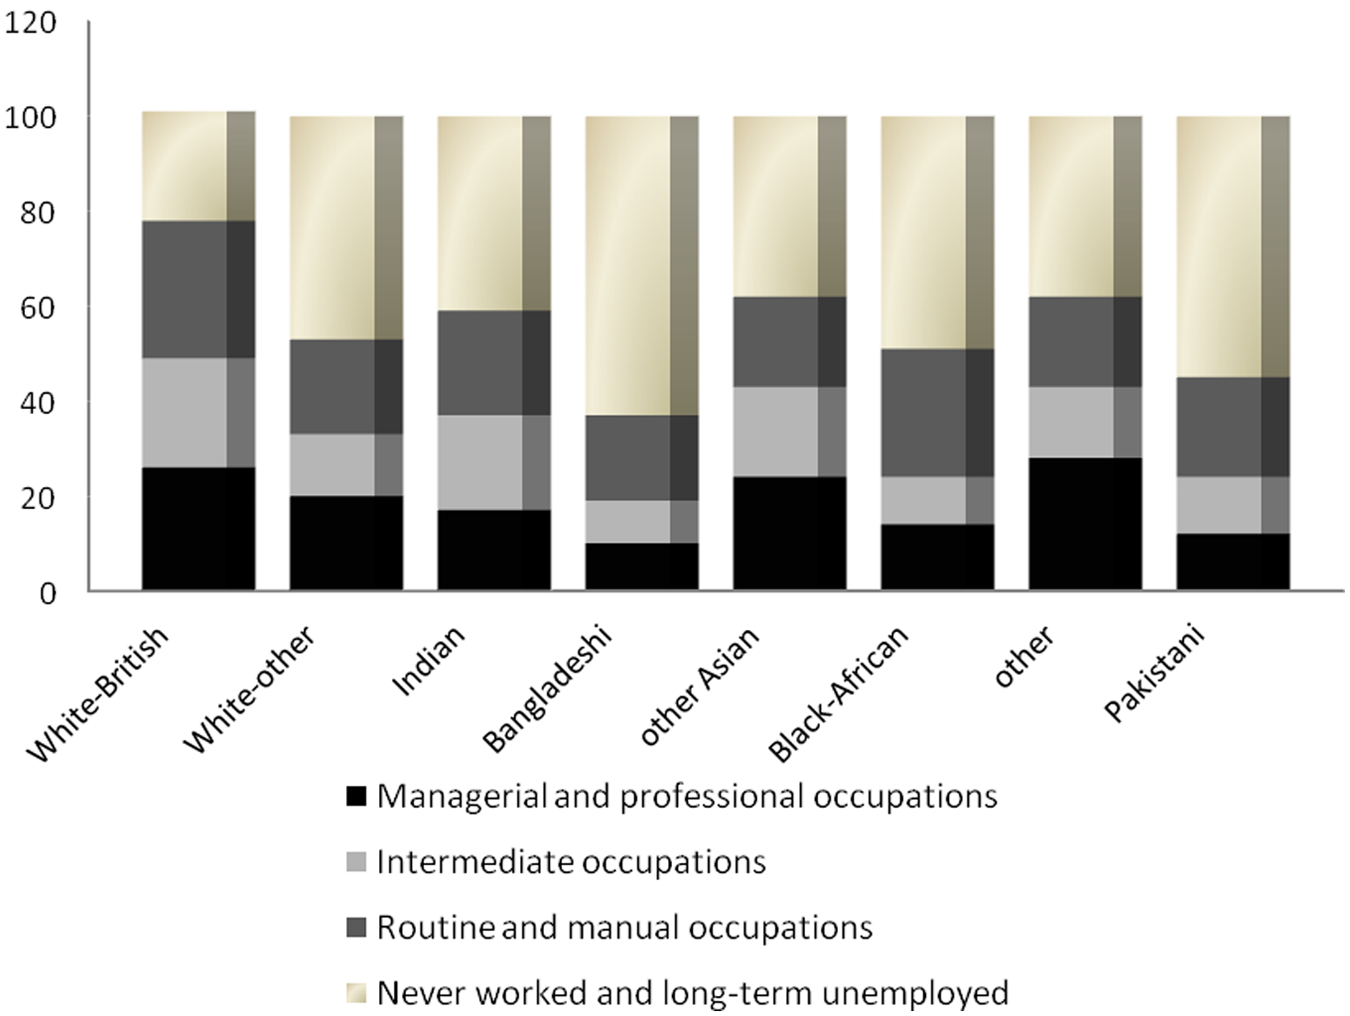
Figures 1 and 2 present the distribution of the dependent variable by ethnicity and sex. It can be seen that all of the four NS-SEC categories vary hugely across the ethnic groups. This is the case for men (Figure 1) and for women (Figure 2) alike. However, the ethnic differences among Muslim women are even more dramatic than among men, especially in relation to the last category of never worked and long-term unemployment. According to Figure 1, Muslim White-British and Muslim Indian men seem to be well placed ahead of other groups. Both groups have the lowest proportion of people in the category of never worked and long-term unemployed (8% and 7% respectively) and have almost the highest proportion of people in the category of managerial and professional occupations (33% and 32% respectively). Although the Muslim-other group is slightly over-represented in the first category of managerial and professional occupations (34%), they are nonetheless the group with the highest proportion of people in the last category of never worked and long-term unemployed. Pakistani and Bangladeshi men are very similar in terms of their representation within the last category of never worked and long-term unemployed. They also have the highest proportion of people in routine and manual occupations (41% and 54% respectively). However, they differ significantly in terms of their distribution across the first and second categories with Bangladeshis having the lowest proportion within the first category of managerial and professional occupations (17%).

Socio-economic classification by ethnic groups, 2001 UK Census, men aged 20–59
Socio-economic classification by ethnic groups, 2001 UK Census, women aged 20–59
Figure 1 shows that around a quarter of Muslim Black-African and Muslim White-other men are in managerial and professional occupations, placing them like Pakistanis somewhere in the middle between Muslim White-British and Muslim Indian men on the one hand and Bangladeshi men on the other hand. While these two groups have the same proportion of people in routine and manual occupations, Muslim Black-African men are over-represented within the category of never worked and long-term unemployed (24% among Black-African vs 20% among White-other men).
Figure 2 shows deeper ethnic differences among women than the differences presented in Figure 1. Muslim White-British women appear to hold the best socio-economic profile. They are significantly over-represented within the category of managerial and professional occupations on the one hand, and under-represented within the category of never worked and long-term unemployed on the other hand, thereby being placed ahead of the other groups. Bangladeshi women were found at the opposite end of the scale, below Pakistani and Black-African women.
Muslim-other women, Muslim other Asian women, Muslim White-other women and Indian women can be placed somewhere in the middle between Muslim White-British women and Bangladeshi women.
Comparing the two Figures, the following patterns can be identified:
as mentioned above, the differences between groups among women are deeper than those found among men;
within each socio-economic category, there are significant differences between men and women in terms of their distribution, especially in relation to the first and last categories; and
Muslim White-British men and women seem to have a better profile than the other groups.
In the next section, the multivariate analysis will be presented.
Multivariate modelling
The multivariate analysis is presented separately for men (Table 3) and women (Table 4). This analysis contrasts the effect of being in managerial and professional occupations, intermediate occupations or never worked and long-term unemployed with that of being in the category of routine and manual occupations. It is worth noting here that the coefficients reported in Tables 3 and 4 are odds-ratios. These coefficients should be read as follows: a coefficient less than one shows that the relevant independent variable has a negative impact on the likelihood of being in the relevant category whereas a coefficient greater than one indicates a positive impact on the likelihood of being in that category. Since an interaction term of ethnicity and qualifications is included, two models are presented. The first model shows the main effects only (without any interaction effects) whereas in the second model the interaction effects are included.
Multinomial models for occupational class^ for Muslim men, UK 2001
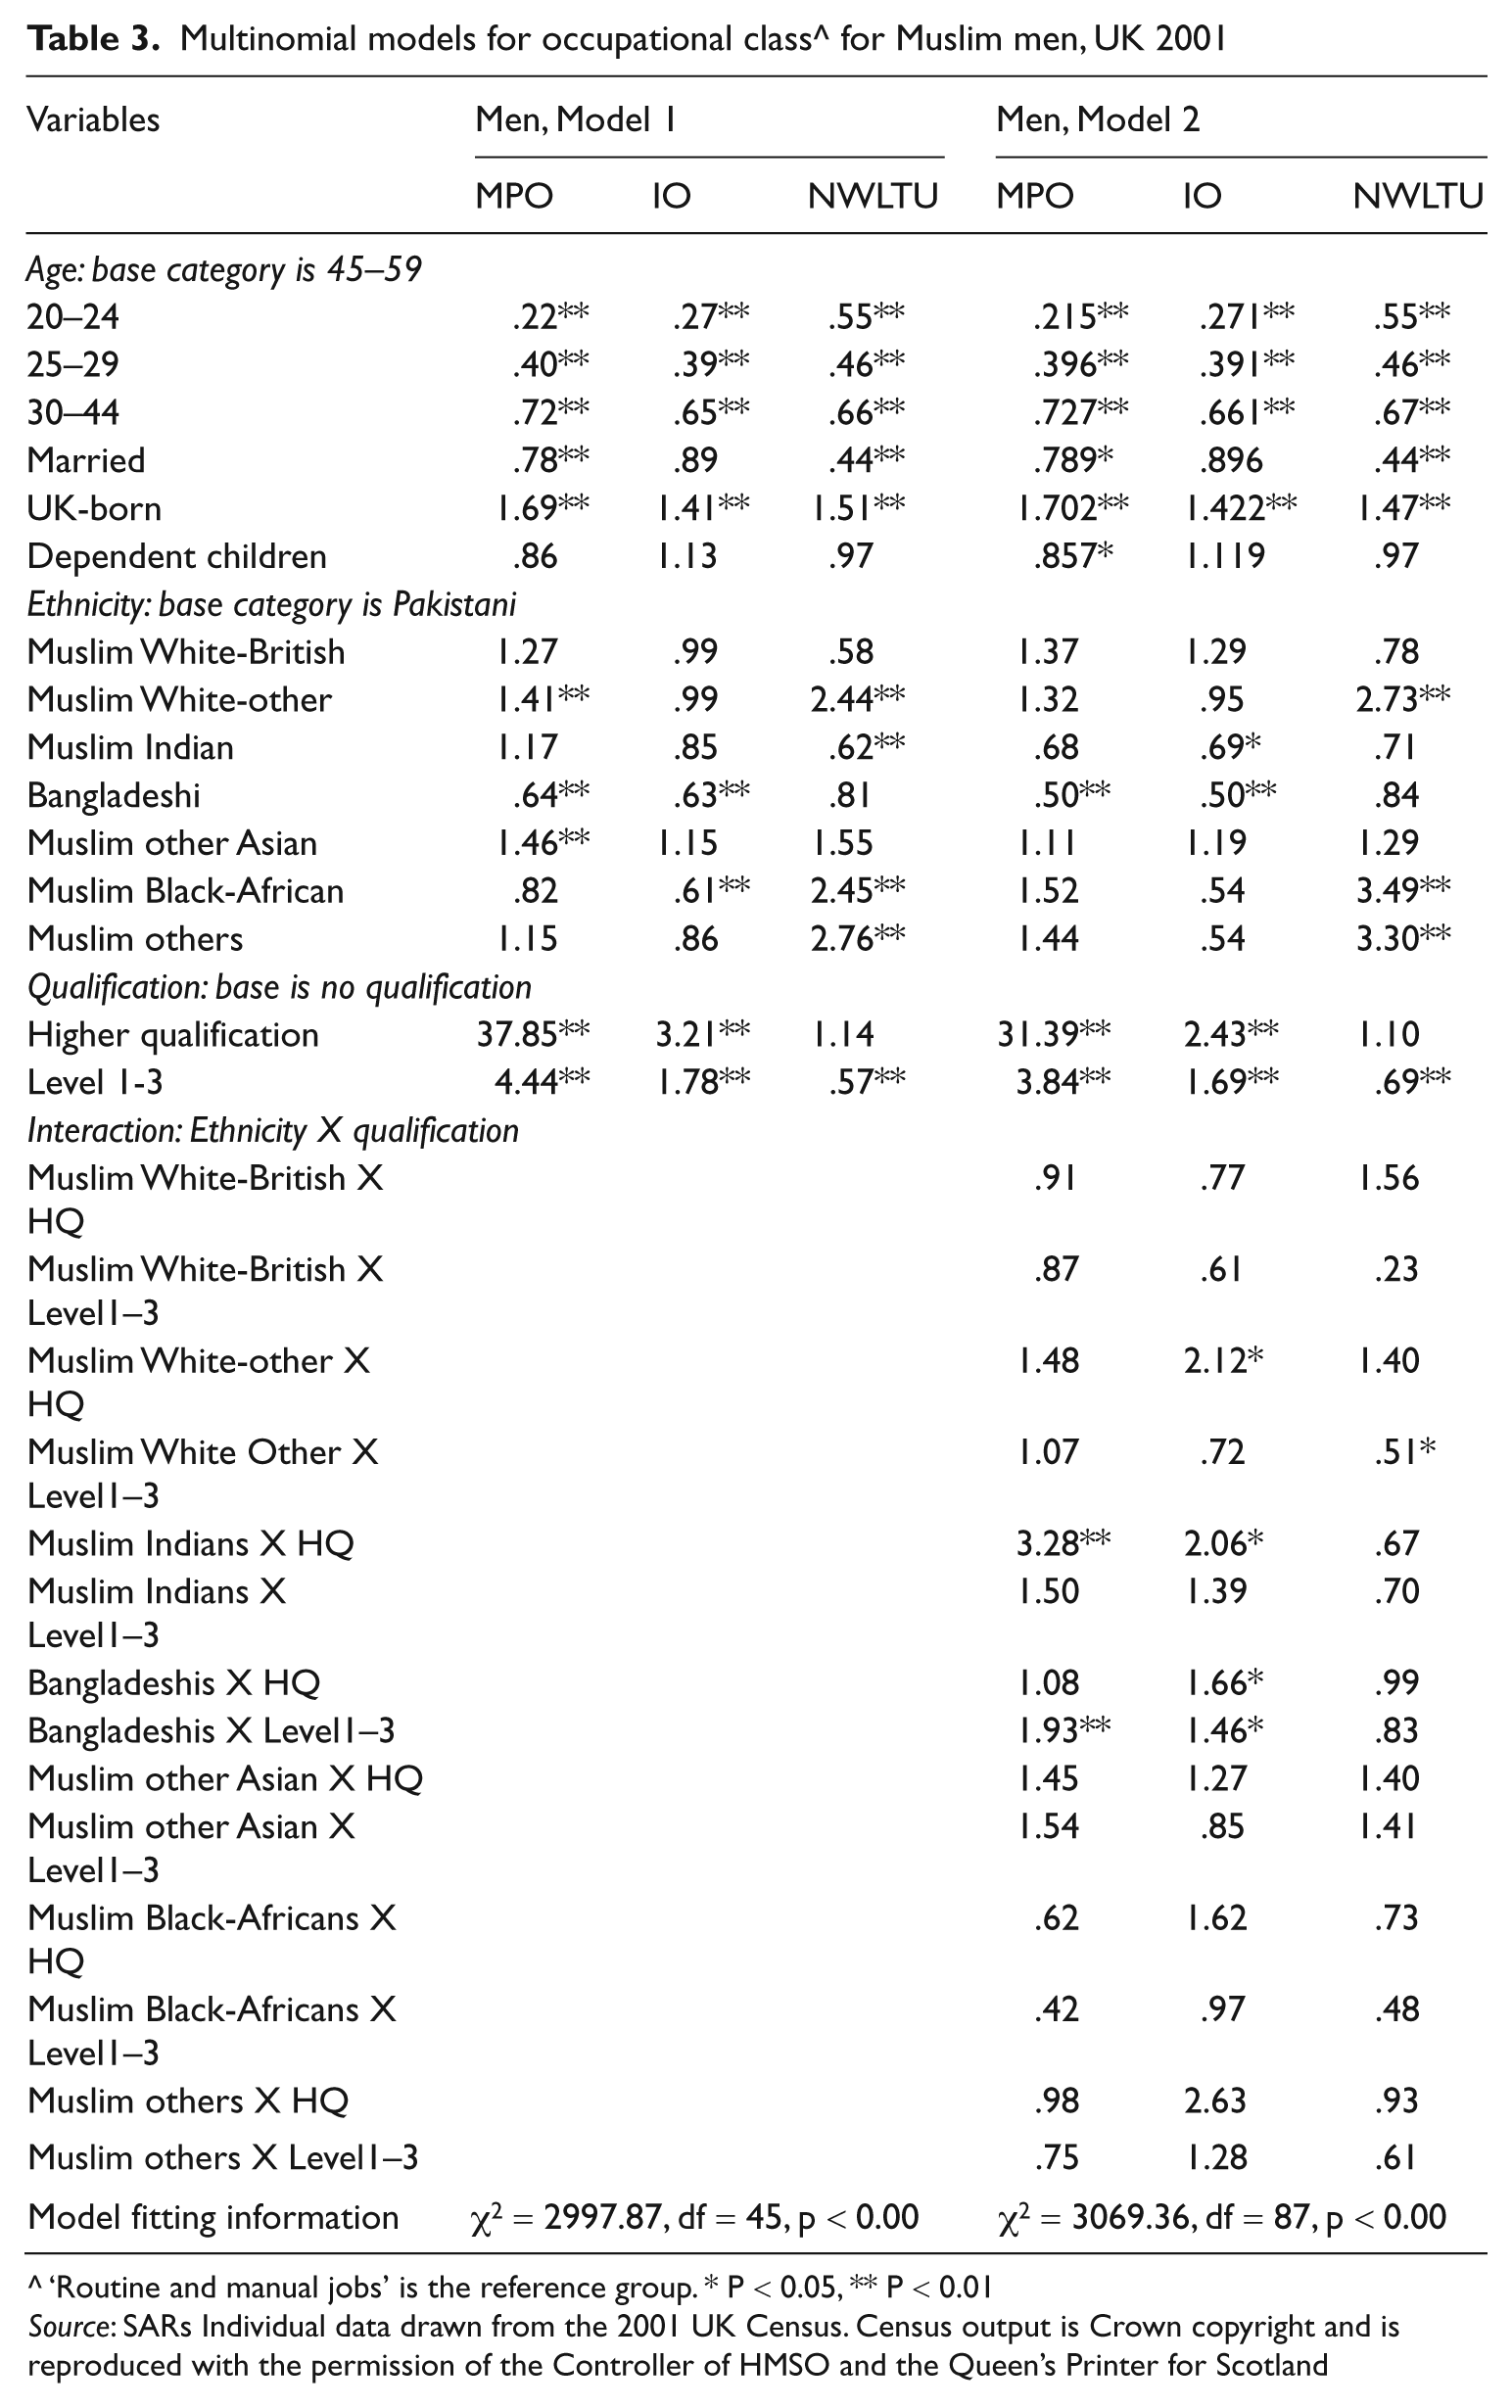
^ ‘Routine and manual jobs’ is the reference group. * P < 0.05, ** P < 0.01
Source: SARs Individual data drawn from the 2001 UK Census. Census output is Crown copyright and is reproduced with the permission of the Controller of HMSO and the Queen’s Printer for Scotland
Multinomial models for occupational class^ for Muslim women, UK 2001
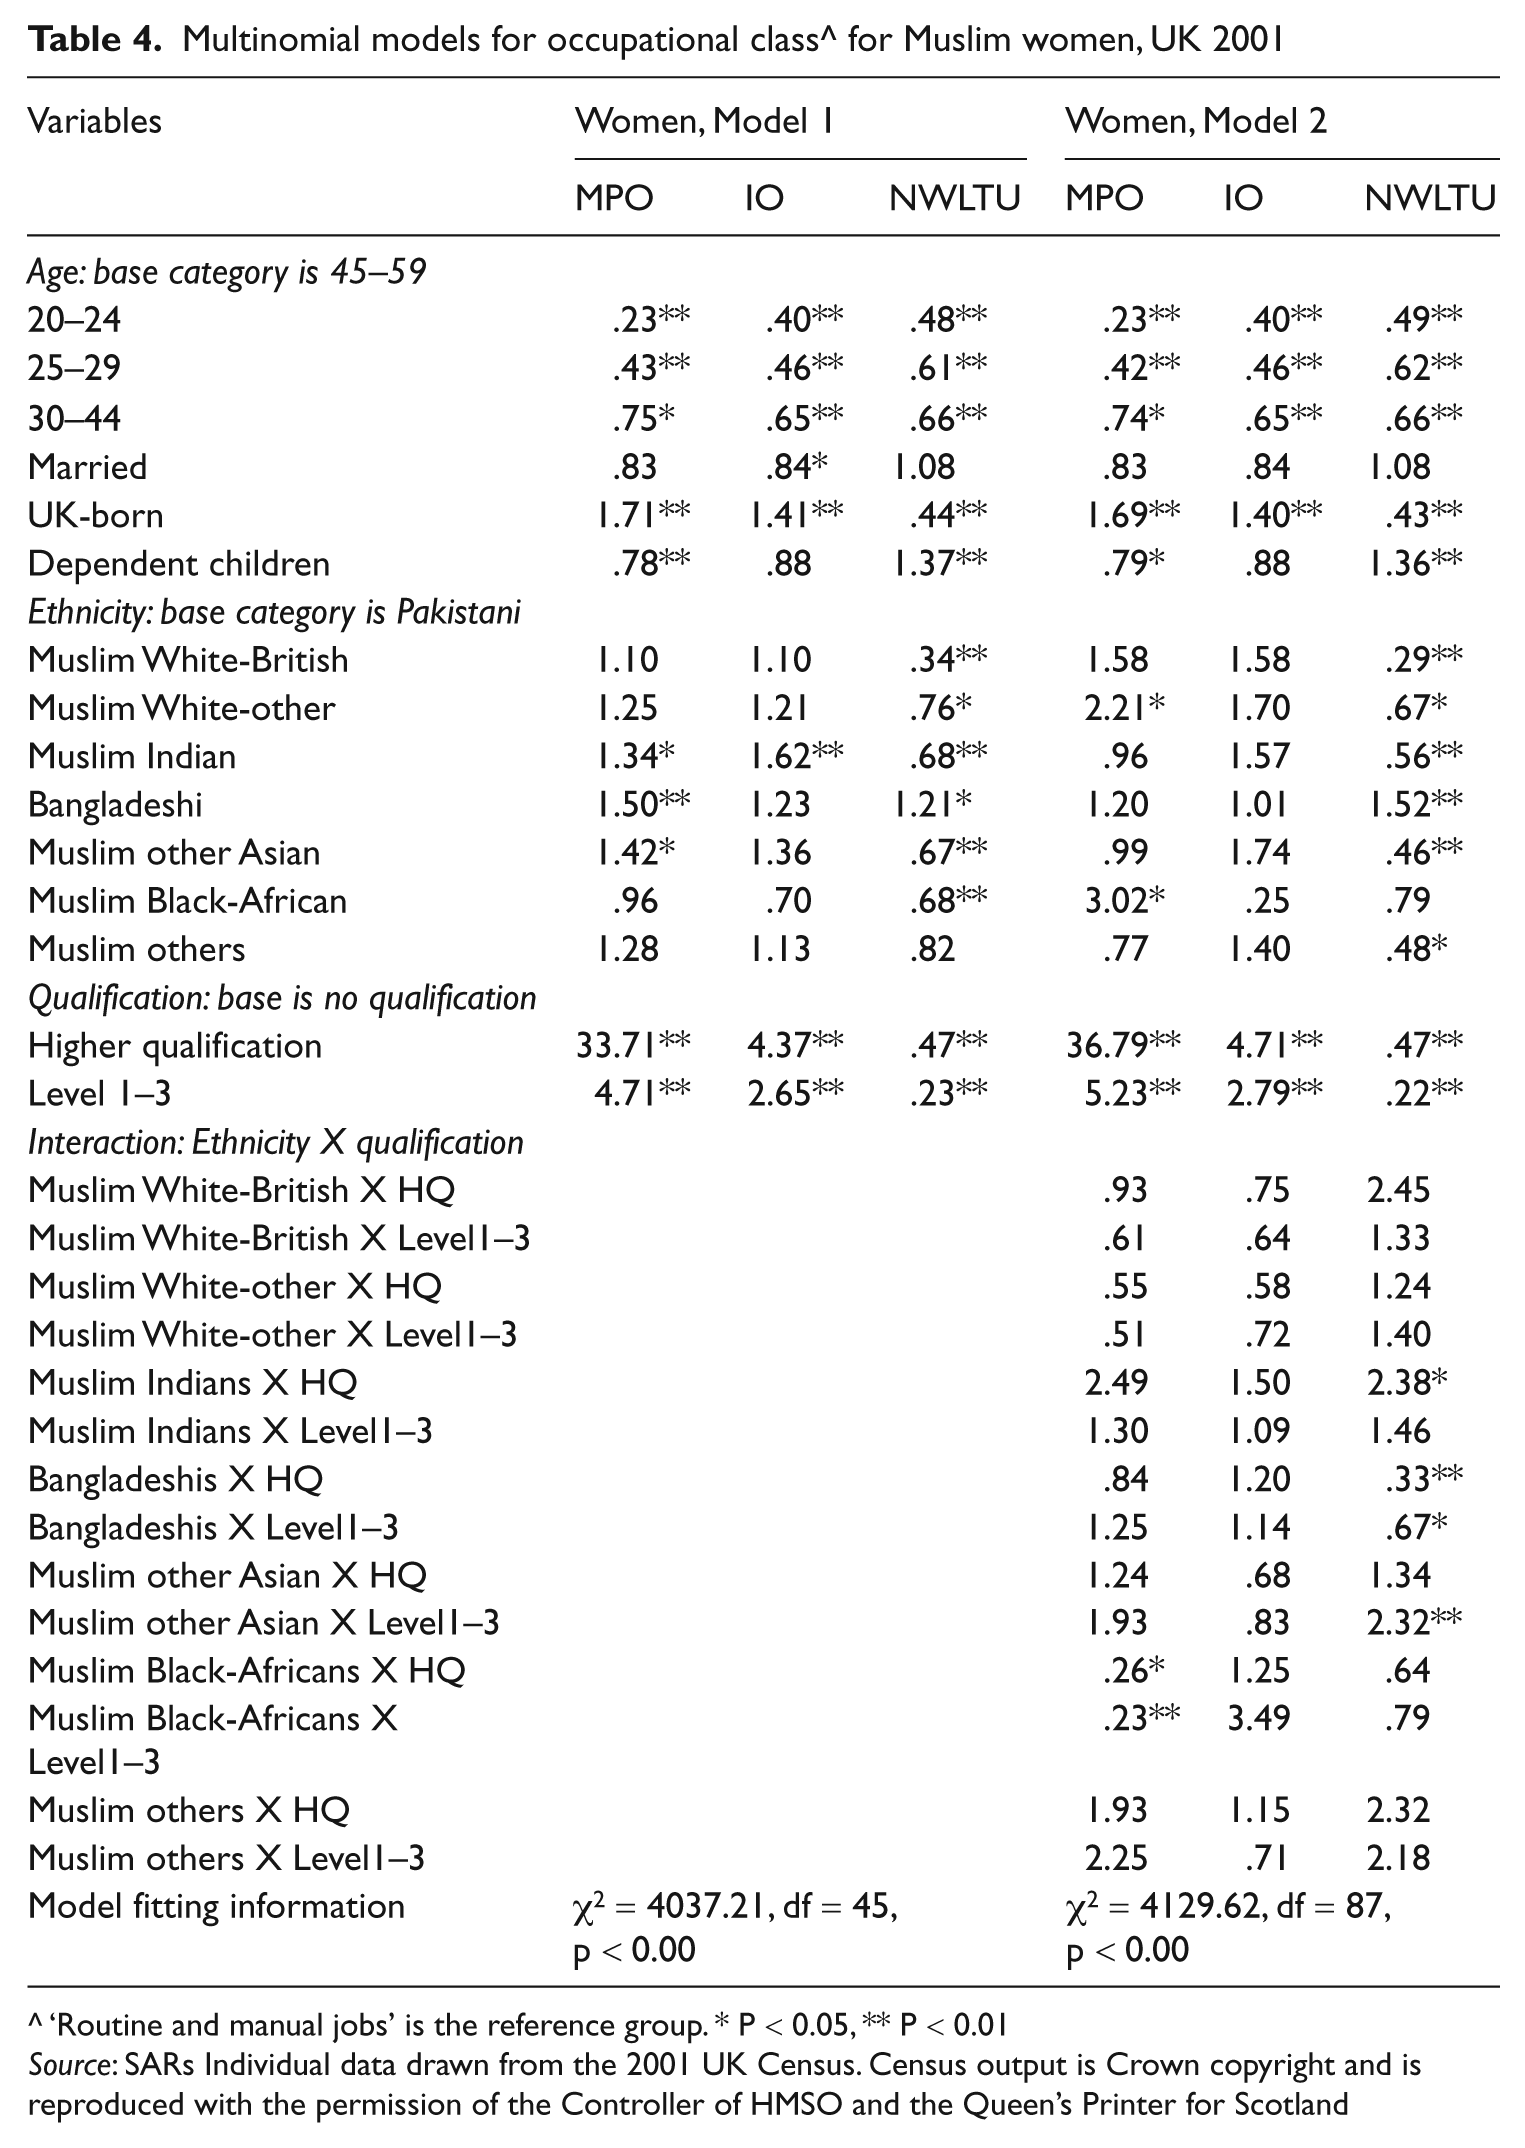
‘Routine and manual jobs’ is the reference group. * P < 0.05, ** P < 0.01
Source: SARs Individual data drawn from the 2001 UK Census. Census output is Crown copyright and is reproduced with the permission of the Controller of HMSO and the Queen’s Printer for Scotland
Turning to the first independent variable in the model, the results show that age operates in the expected direction, that is young people (men and women aged 20–44) are significantly less likely to be in managerial and professional occupations, in intermediate occupations or even in the category of never worked and long-term unemployed, relative to being in the category of routine and manual occupations compared to people aged 45–59. The impact of being married is significant in the men’s model only. Married men are less likely to be in any of the three categories relative to the reference category of routine and manual occupations.
Turning to the impact of place of birth, Tables 3 and 4 show that UK-born Muslim men and women have greater chances of being in managerial and professional occupations and intermediate occupations relative to being in the reference group (routine and manual occupations) than overseas-born Muslim men and women. However, compared to overseas-born Muslim men and women, UK-born Muslim men and UK-born Muslim women have different odds-ratios of being in the category of never worked and long-term unemployed relative to the reference category (greater odds-ratio for men at 1.47 and smaller odds-ratio for women at 0.43). The presence of dependent children in the family has a significant negative impact on the men’s and women’s chances of being in the category of managerial and professional occupations relative to the reference category. As expected, the presence of dependent children has a stronger influence on women’s employment than on men’s employment. Table 4 reveals that Muslim women are more likely to be in the category of never worked and long-term unemployed as a result of having dependent children, whereas the equivalent men’s coefficient is insignificant.
The impact of qualifications (main effect) seems to be very significant and in the expected direction. Obtaining a higher qualification, and to a lesser extent a level 1–3 qualification, significantly increases the chances of Pakistani men and women achieving positions in the category of managerial and professional occupations, or intermediate occupations and reduces the likelihood of being in the category of never worked and long-term unemployed (especially among women) relative to those Pakistani men and women without any qualification.
Turning to the impact of ethnicity (main effect), Tables 3 and 4 reveal significant ethnic differences in the models of men and women alike. However, it is worth noting two important differences between men and women: the ethnic differences among women are larger than those found among men (more significant coefficients), confirming the pattern revealed in Figures 1 and 2; and secondly, most of the significant coefficients in the women’s model are in relation to the category of never worked and long-term unemployed and all of them are less than 1 except for Bangladeshi women. This means that compared to Pakistani women without any qualifications, Bangladeshi women have the greatest chances of being outside the labour market or experiencing long-term unemployment. In the men’s model, the Muslim White-other, Muslim Black-African and Muslim-other groups have the highest likelihood of being in the category of never worked and long-term unemployed. Moreover, compared to Pakistani men with no qualifications, Bangladeshi men are significantly less likely to be in the categories of managerial and professional occupations or intermediate occupations relative to the reference category. Muslim Indian men too have coefficients less than 1 in both categories, but only the coefficient of the second category (intermediate occupations) is significant. It is worth pointing out that compared to Pakistanis, most of the other ethnic groups (among men and women alike) have greater chances of achieving positions within the categories of managerial and professional occupations or intermediate occupations. While all of the coefficients of these groups in the men’s model (Table 3) are statistically insignificant, Table 4 shows that Muslim White-other women and Muslim Black-African women have significant coefficients suggesting that these groups are more likely than Pakistani women with the same level of qualification to have managerial and professional positions.
The results of the interaction effects of ethnicity by qualification are presented at the bottom of Tables 3 and 4. These results clearly confirm that qualifications have different effects among different ethnic groups. In other words, it seems that some Muslim ethnic groups are able to achieve higher value (returns) for their qualifications than others. This pattern is more evident in the men’s model than in the women’s model. For example, the importance of higher qualifications among Muslim Indian men and among Bangladeshi men is greater than among Pakistani men. Similarly, the impact of higher qualifications and Level 1-3 qualifications among Bangladeshi women is far greater than among Pakistani women in avoiding the category of never worked and long-term unemployed. The same can be said about the impact of higher qualifications among Muslim White-other men and the opposite can be said about Muslim Black-African women. The occupational returns from higher qualifications among the latter group are the lowest relative to Pakistani women. The equivalent result concerning Muslim Black-African men are similar to those for women (but not as significant) suggesting that Muslim Black-African women and to a lesser extent men are among the most disadvantaged (‘losers’). These results suggest that
different Muslim ethnic groups face different levels of penalty in the labour market, and
ethnic differences were greater among women than among men.
In the next section these results are discussed in more detail.
Concluding thoughts
In this analysis of the Muslim ‘winners’ and ‘losers’ in the British labour market, this article has determined a set of findings that suggest it is important to move beyond a simplistic notion of a Muslim/non-Muslim differential category. It is clear that when discussing the notion of ‘the Muslim’, there are vastly divergent starting points for different groups. Some groups, such as Pakistanis, Muslim Indians and Bangladeshis migrated to Britain because of the need for economic workers to take up employment in declining industrial sectors, while others such as some Muslim Arabs came because they were elites, and the more recent wave is characterized by the influx of those fleeing persecution or violence in the sending countries and who have been granted status by the British government as ‘refugees or asylum seekers’. Additionally, some, like Muslim White-British, were born in the UK either as a result of mixed marriages between Muslim men and White women, or converted to Islam, thereby forming a distinctive ethnic group of Muslim White-British. This latter group does not have a history of migration, does not face language difficulties and does not experience colour racism as do other Muslim groups (Khattab, 2009).
Originating from variously differentiated starting points impacts on the ability to create and eventually realize opportunities for social mobility, and often this comes about through the operationalization of cultural and social as well as economic capital (Modood, 2004). Moreover, as Muslim groups began to adapt to majority society, while adopting some of the norms and values of their new home and rejecting others, different Muslim groups experienced a differential reality because of a host of endogenous and exogenous factors. Internally, there are issues of inter-generational disconnection, for example, while, externally, racism, discrimination and Islamophobia have become significant features, particularly in the post-9/11 and post-7/7 climate. It is important to appreciate the latter issue in the context of ways in which different Muslim groups have been directly or indirectly affected at the macro level, as well as the fact that in many micro-level instances, concerns in relation to stress, cultural expectations and questions of religiosity are significant. What this analysis of the 2001 Census has revealed is that, without doubt, it is clear that education impacts on labour market outcomes as has been found in classical social mobility studies (Halsey et al., 1980). There is a general finding that supports this sentiment (the fixed effect of qualification presented in Tables 3 and 4), but it does not apply equally to Muslims across the range of ethnicities under study. The findings of this study have revealed that some ethnic Muslim groups benefit or are able to utilize education more successfully than others, as is the case with Muslim Indian men and women or indeed Bangladeshi men, in obtaining jobs within the category of managerial and professional occupations. The finding in relation to Muslim Indian men is in line with other previous and recent studies (Brown, 2000; Khattab, 2009). The fact that Muslim Indian women with higher qualifications have greater chances of obtaining jobs within the category of managerial and professional occupations than do Pakistani women is indeed interesting and shows that even among Muslim women in Britain there are vast ethnic differences. Even Bangladeshi women with level 1–3 qualifications have higher chances than Pakistani women of getting managerial and professional jobs. Although the difference between these two groups was insignificant, this result is indeed in line with the results of a recent study on the impact of residential segregation on labour market outcomes among Bangladeshi men and women (Johnston et al., 2010). According to that study, Bangladeshi women were able to find non-manual jobs after completing school by utilizing informal recruiting channels through family and friends inside the ethnic economy. In many cases these jobs required skills that did not always match those held by these women (Johnston et al., 2010).
This article has demonstrated that there are indeed acute ethnic and religio-cultural differences in relation to Muslims in Britain and migration histories characterize aspects of this story in relation to relative integration, but it is the impact of education and especially higher education, which significantly shifts the opportunity structure afforded to women relative to men. South Asian Muslims, by virtue of their history in relation to the Raj, have a particular profile but there are other groups that can be characterized in distinctive ways, namely as within-majority-South Asian groups but also in relation to Muslims who are minority-Indian, White-British, Black-African or ‘other’. However, it is also the case that the Muslim Black-African group experiences greater penalties than Pakistanis on a consistent basis. This finding suggests that the forces of colour racism are as strong if not stronger than religious racism in the context of under-achievement in employment spheres (cf. Cheng and Heath, 1993). This article has provided a detailed discussion of these differences in relation to employment and it gives researchers and policy-makers potentially greater insight into the wider Muslim experiences in British society, in particular beyond the historical focus on South Asians, and one that is aimed at a more holistic interpretation and analysis of the Muslim experience in Britain per se.
Footnotes
Acknowledgements
The support of the Office for National Statistics (and the General Register Office for Scotland and the Northern Ireland Statistical Research Agency where appropriate), CCSR and ESRC/JISC Census of Population Programme is gratefully acknowledged. The author alone is responsible for the interpretation of the data. The author wishes to thank Tahir Abbas for his helpful comments on the article. Special thanks for the editor and the anonymous referees for their comments.