



Abstract
Under the recently enacted pharmaceutical price and reimbursement regulation in Germany, new drugs are subject to a rapid assessment to determine whether there is sufficient evidence of added clinical benefits compared with the existing standard of treatment. If such added benefits are confirmed, manufacturers and representatives of the Statutory Health Insurance (SHI) are expected to negotiate an appropriate reimbursement price. If parties fail to reach an agreement, a final decision on the reimbursement price will be made by an arbitration body. If one of the parties involved wishes so, then the Institute for Quality and Efficiency in Health Care (Institut für Qualität und Wirtschaftlichkeit im Gesundheitswesen, IQWiG) will be commissioned with a formal evaluation of costs and benefits of the product in question. IQWiG will make a recommendation for a reimbursement price based on the ‘efficiency frontier’ in a therapeutic area. The purpose of the assessments is to provide support for decision-making bodies that act on behalf of the SHI insurants. To determine the willingness to pay for new drugs, IQWiG uses the following decision rule: the incremental cost-effectiveness ratio of a new drug compared with the next effective intervention should not be higher than that of the next effective intervention compared with its comparator. The purpose of this paper was to investigate the theoretical and empirical relationship between the willingness to pay for drugs and their health benefits. The analysis shows that across disease areas IQWiG has a curvilinear relationship between willingness to pay and health benefits. Future research may address the validity of the willingness-to-pay function from the viewpoint of the individual SHI insurants.
Traditionally, market approval of a drug was based on evidence from one or more phase III clinical trials only. Phase III clinical trials were usually placebo-controlled to demonstrate that the drug works. After market approval the manufacturer was able to freely set a price (considering a price/volume trade-off). Launching a novel drug today obliges companies to convince on its value. Quality, safety and efficacy are just three of four hurdles to market access. The requirement to prove cost-effectiveness/value has been described as the fourth hurdle. For manufacturers an implication of the fourth hurdle is to invest in areas where the achievable health benefit is greatest. 1 Areas of high disease prevalence combined with unmet need are the obvious highest returns. 1
Several countries around the world are using cost-effectiveness analysis as part of their formal decision-making process for the pricing or reimbursement of drugs. 2 In Germany, new legislation regulating the reimbursement of drugs within the statutory health care system (Arzneimittelmarktneuordnungsgesetz [AMNOG]) was introduced on 1 January 2011. According to this law, new products are subject to a rapid assessment to determine whether there is sufficient evidence of added clinical benefits compared with the existing standard of treatment. If such added benefits are confirmed, manufacturers and representatives of the Statutory Health Insurance (SHI) are expected to agree on an appropriate reimbursement price within 6 months, starting from the completion of the benefit assessment. If drug makers and health insurers cannot agree on the price, a final decision on the reimbursement price will be made by an arbitration body. If one of the parties involved wishes so, the Institute for Quality and Efficiency in Health Care (Institut für Qualität und Wirtschaftlichkeit im Gesundheitswesen, IQWiG) will be commissioned with a formal evaluation of costs and benefits of the product in question. The purpose of the assessments is to provide support for decision-making bodies that act on behalf of the SHI insurants. The methodology of IQWiG, which is described below, aims at proposing a price that is ‘cost-effective’ as defined by IQWiG; however, the final decision is made by the relevant committees and not by IQWiG. 3 Recently, two price calculations using IQWiG’s methodology were published.4,5
To recommend reimbursement prices, IQWiG uses a decision rule
a
which comes in three variants and is based on a proportional relationship between incremental costs and incremental health benefits.6,7 Each of the three variants may yield a different reimbursement price. In the base case, the incremental cost-effectiveness ratio (ICER) of a new drug compared with the next effective (non-dominated) intervention should not be higher than that of the next effective intervention compared with its next effective (non-dominated) intervention.
3
That is, incremental costs (compared with the comparator’s comparator) should increase at most proportionally to incremental effects. If the price of a drug is below the reimbursement price, incremental costs increase less than proportional. According to IQWiG, the various alternatives are placed on a ‘cost-benefit plane’ (Figure 1), an ‘efficiency frontier’ is drawn along non-dominated alternatives (A and B in the figure), and the threshold ICER and thus the reimbursement price C″ is determined by an extension of the last segment of the ‘efficiency frontier’ (from A to B). Stricter variations of the base-case rule, leading to lower reimbursement prices, exist. They determine threshold cost-effectiveness either based on (i) the ICER of the currently most effective intervention (B) compared with no intervention (henceforth called ‘no intervention’ rule and yielding C′) or (ii) the average ICER of all non-dominated alternatives.
3
In case a new drug has no more than two comparators with one being no intervention, the ‘no intervention’ and the base-case rule coincide.
Decision rules for setting reimbursement prices by the Institute for Quality and Efficiency in Health Care. A, B and X are pairs of incremental costs and effects of existing interventions and C′ and C″ are cost and effect pairs of the new drug. The reference point is ‘no intervention’.
Each therapeutic area is assessed separately; this means that no direct comparisons between therapeutic areas are performed. Although measures of health benefits may differ between therapeutic areas and within a therapeutic area for different indications, they need to be the same for the interventions compared in order to determine the reimbursement price. As potential measures of health benefit, IQWiG allows the use of either clinical outcomes such as mortality, morbidity (e.g. disease complications) and health-related quality of life; validated surrogates or a preference-based measure of outcome that translates health into value. 3 IQWiG requires health benefits to be measured on a cardinal value scale, that is, two increases considered to be equal in size correspond to an identical growth in benefit. 3 The value scale used to measure benefit may need not be cardinally scaled across its entire range but needs to be cardinally scaled over the range of benefit relevant to the interventions in question. 3
In terms of costs, IQWiG considers (i) drug-related costs that include costs of the drug and treatment of side effects, (ii) savings from avoided clinical outcomes or events (CEs) and (iii) change in future health care costs due to life prolongation stemming from the reduction in CEs. Unrelated health care costs during extended lifetime are not considered in the base case, but are included in a sensitivity analysis. 3 In a primary or base-case analysis IQWiG requires to take into account only costs and effects that occurred during a randomized controlled trial (RCT). 3 An extrapolation of costs and effects beyond the end of the RCT is considered in a secondary analysis 3 when it is relevant for decision making.
While IQWiG’s decision rule has received a lot of attention and criticism,8,9 its implied value functions remain to be investigated. IQWiG has two fundamental value functions. One translates health outcomes into health benefits as discussed above. And the other translates health benefits into willingness to pay as determined by the last segment of the efficiency frontier (IQWiG 3 explicitly uses the term ‘willingness to pay’, p. xi).
The purpose of this paper was to investigate IQWiG’s willingness-to-pay function across therapeutic areas both theoretically and empirically. The analysis helps to understand how much weight IQWiG implicitly puts on severity of disease to determine reimbursement prices. In the discussion section of this paper IQWiG’s value function(s) will also be compared with those of health technology assessment (HTA) agencies and initiatives around the world.
For the empirical analysis we used a German public data set. The fact that IQWiG rejects comparisons across therapeutic areas is not relevant for the purpose of this paper as it is possible to conduct such comparisons by using a common measure of health benefit such as quality-adjusted life years (QALYs). Note that IQWiG does not explicitly exclude QALYs as a measure of health benefit 3 but criticizes its use based on ethical and methodological grounds.
Methods
‘No intervention’ rule
As stated, IQWiG’s decision rule is a ‘proportional’ rule,6,7 that is, incremental costs increase in at most proportional to incremental health benefits, see also a short proof in the appendix. For example, if incremental health benefits increase by 5%, incremental costs should also increase by no more than 5%. Based on the ‘no intervention’ rule this means that the same absolute increase in health benefits leads to a smaller relative increase in health benefits when the next effective intervention is fairly effective already (compared with no intervention). Thus, the value function for health benefits based on the ‘no intervention’ rule is concave and implies diminishing marginal value of health benefits. Similarly, an increase in value by one unit requires an increasing health benefit.
The idea of diminishing marginal value of health benefits is formalized as follows.
7
Based on a pre-treatment level of health benefits H = 1, 2, 3, … , h the marginal value of an equivalent increase in health benefits (by one unit) is 1/H. If we measure total gain in value by increasing health benefits from level 1 to h we obtain, based on the proportional rule:
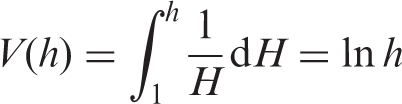
While the proportional rule and the logarithmic value function, strictly speaking, refer to a single therapeutic area, they also apply across therapeutic areas. That is, if we use a common currency of health benefits across therapeutic areas such as QALYs, then in therapeutic areas where health benefits are low (e.g. the number of QALYs without treatment) an equivalent increase in health benefits will be valued higher.
Value also depends on the level of costs because higher baseline costs translate into a higher cost increase (based on the principle of proportionality) and willingness to pay. Hence, equation (1) needs to be expanded to include information on costs. Within therapeutic areas the value of an equivalent increase in health benefits decreases with baseline level of health benefits, as described above. On the other hand, the value of a proportional increase in costs increases with baseline level of health benefits because a higher baseline level of health benefits translates into a higher baseline level of costs. In fact, the relationship between increase in costs and baseline level of health benefits is linear (based on the principle of proportionality), which is expressed as follows:
7
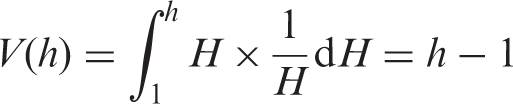
In order to include information on costs in the value function across therapeutic areas, we similarly need an estimate on the relationship between health benefits and costs across therapeutic areas. We use the variable β to describe the elasticity of costs with respect to health benefits across therapeutic areas. When costs decrease with health benefits (because healthier populations have lower costs), then β > 0. That is, consideration of costs decreases the value increase from incremental health benefits. If we incorporate β into the value function described by equation (1), we obtain

Base-case rule
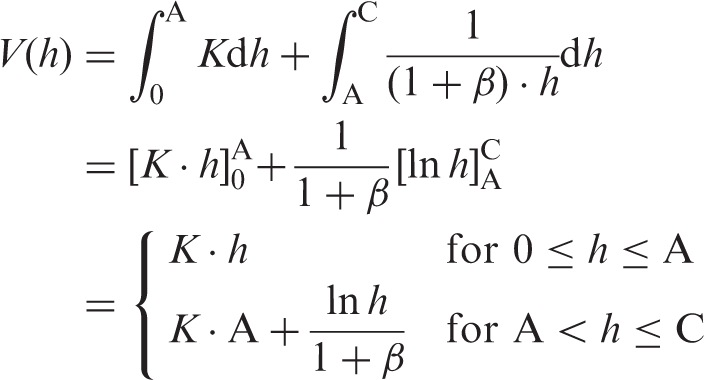
When describing the value function for the base-case rule within and across therapeutic areas we need to consider that the base-case rule does not refer to the lowest possible level of health benefits (h = 1) but to a higher level of health benefits defined by the comparator’s comparator. Up to the level of health benefits achieved by the comparator’s comparator the value function is linear with respect to health benefits due to the absence of a diminishing effect. The value function within therapeutic areas continues to be linear as shown for the ‘no intervention’ rule. In contrast, the value function across therapeutic areas shows diminishing marginal value of health benefits but only starting at the level of health benefits achieved by the comparator’s comparator. This is formalized as follows:
Data set and analysis
To assess β, we conducted an empirical analysis of disease-specific health benefits and costs in Germany. As a measure of health benefits we used mortality reduction. That is, we estimated changes in costs in relation to changes in mortality (of one therapeutic area compared with another). When a reduction in mortality across therapeutic areas is associated with lower costs, then β > 0. The analysis used mortality and cost data by ICD-10 code published by the German Federal Statistical Office.10,11 Both mortality and cost data were from the year 2008 and matched by ICD-10 codes (first two digits). All ICD-10 codes and diseases were included. Cost data include all direct medical costs (for inpatient as well as outpatient services) as well as a portion of direct non-medical costs (such as transportation costs) aggregated across all patients with the ICD-10 code in question over 1 year. Indirect costs were not included. As the analysis used country-level data, there was no variation at the country level. To assess the impact of mortality reduction in the change in costs across diseases, we used a log–log linear regression model with log costs as the dependent variable and log number of deaths as the independent variable (the estimation method was ordinary least squares regression). A log–log model specification has the advantage of providing an estimate of the average elasticity of costs with respect to mortality. P values < 0.05 were considered statistically significant. White’s test for heteroscedasticity was performed to establish whether nonhomogeneity of variance occurred with increasing mortality. All analyses were conducted in Stata Version 10.1 (StataCorp LP, College Station, Texas).
Results
The regression model shows that log mortality is significantly associated with log costs (see Table 1 for results). The elasticity of costs with respect to mortality (β) is constant and equal to 0.17 (95% confidence interval, 0.005–0.34), meaning that when mortality increases by 10%, costs increase on average by 1.7% (or conversely, when health benefits increase by 10%, costs decrease by 1.7%, meaning that healthier individuals have lower costs). Figure 2 shows a scatter plot of log costs as a function of log mortality. Each data point represents one ICD10 two-digit category. White’s test for heteroscedasticity was not significant. While the Q–Q plot showed departures from the straight line, these departures were smaller than for untransformed variables.
Scatter plot of log costs (in million €) as a function of log number of deaths. Results of the regression analysis on the impact of a change in log mortality (number of deaths) on the change in log costs (in millions €) across diseases. The R
2
value was 0.05.

Discussion
IQWiG’s value function(s)
A previous paper 7 showed that across therapeutic areas IQWiG’s ‘no intervention’ rule assumes a curvilinear relationship between health benefits and value. To further characterize IQWiG’s value function across therapeutic areas, this paper introduced a scaling factor that describes the elasticity of costs with respect to health benefits across therapeutic areas. The empirical investigation on the sign of the scaling factor shows that it is positive, in line with our intuition that healthier populations, who have lower mortality, also have lower costs. Therefore, curvilinearity of IQWiG’s value function across therapeutic areas increases when considering this scaling factor.
A curvilinear relationship between health benefits and value means that the same absolute gain in health benefits has more value when baseline health benefits are low, that is, disease is more severe. Consideration of disease severity is supported by many international surveys showing that people are willing to trade the maximization of health against a fair distribution of health and, in particular, give priority to persons with worse lifetime health prospects (see Dolan et al. 12 for a systematic review). That is, there is broad evidence supporting IQWiG’s assumption of a curvilinear relationship between health benefits and value.
As a word of caution, a curvilinear relationship across therapeutic areas was only demonstrated with mortality as a measure of health benefits. Mortality is an important but not the only measure of health benefits used by IQWiG. Other measures of health benefits supported by IQWiG include morbidity and health-related quality of life. Furthermore, other specifications of the willingness-to-pay function are possible and include a piecewise function, which changes the definition depending on the level of mortality. Moreover, our empirical analysis did not consider the cost of life extension and one may argue that lower mortality perhaps leads to higher lifetime costs. Yet, as IQWiG’s base-case analysis only considers a short time horizon (RCT-based) and does not account for unrelated health care costs during extended lifetime, we do not expect that base-case results fundamentally differ.
IQWiG’s base-case rule also considers diminishing marginal value of health benefits, but only over a limited range of health benefits. Differences in reimbursement prices between the ‘no intervention’ and the base-case rule then result from different degrees of consideration of diminishing marginal value of health benefits. Whether or not IQWiG’s value functions are representative of the individual SHI insurants cannot be answered in this paper (i.e. IQWiG’s willingness-to-pay function may be different from that of the individual insurants). Future research may address this question through empirical testing.
Comparison with agencies around the world
In the following we would like to compare IQWiG’s value function(s) with those of other HTA agencies and initiatives around the world. An interesting and in some respects similar approach to evaluate the cost-effectiveness of interventions has been proposed by the World Health Organization (WHO) CHOICE b initiative. 13 Similar to IQWiG, WHO-CHOICE uses ‘no intervention’ as a comparator. Furthermore, WHO-CHOICE also has a curvilinear value function based on a quantitative consideration of equity and distributive justice.
Still, there are important differences between IQWiG and WHO-CHOICE. IQWiG has different value functions within and across therapeutic areas (one is linear and the other is curvilinear), while WHO’s value function is curvilinear both within and across therapeutic areas. Furthermore, there may be considerable differences between IQWiG and WHO-CHOICE in the shape of the value function even across therapeutic areas. These cannot be further defined, however, as WHO-CHOICE does not recommend a particular method or set of values to define its value function. The reason is that WHO-CHOICE is cautious about ‘bringing considerations of equity into health policy decision making through a quantitative methodology like the person trade-off methodology’. 14 This is based on ‘deep and long-standing divisions in moral and political philosophy about which there is not now, and may never be, anything approaching consensus’. 14
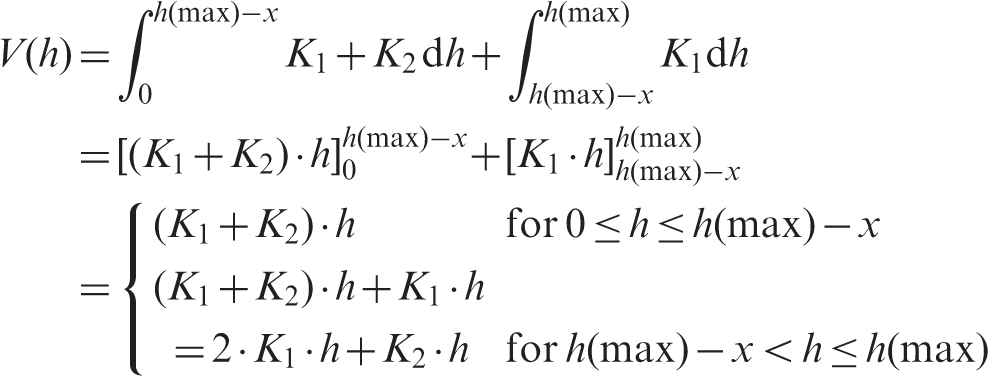
Another HTA agency that seems worth discussing is the National Institute for Health and Clinical Excellence (NICE) in the UK. In contrast to IQWiG, NICE does not specifically recommend ‘no intervention’ as a comparator. In 2008, NICE enacted a policy for treatments for patients with a short life expectancy (normally less than 24 months). This policy allowed the cost-effectiveness ratio for such treatments to be higher than the cut-off normally used by NICE. Thus, NICE’s value function is not curvilinear but piecewise linear and can be formalized as follows:
Conclusion
Given that conventional cost-effectiveness analysis is based on the assumption of a linear increase in willingness to pay with respect to health benefits (in a utilitarian manner), IQWiG’s rule may present an improvement over conventional cost-effectiveness analysis. In any case, IQWiG is unique among international pricing/reimbursement agencies in having a well-definable curvilinear value function across therapeutic areas. While the WHO-CHOICE initiative also has a curvilinear value function, it is less quantifiable based on WHO’s hesitation to use a particular set of person trade-off values. The findings presented in this paper may provide a starting point for empirical testing and further development of IQWiG’s decision rule.
Footnotes
Declaration of conflicting interest
The author declares that there is no conflict of interest.
Funding
This research received no specific grant from any funding agency in the public, commercial, or not-for-profit sectors.