



Abstract
Data envelopment analysis is a methodology particularly well-suited to measuring the efficiency of hospitals because it is able to accommodate multiple heterogeneous inputs and outputs in order to model the complex relationships that exist within them. This research uses data envelopment analysis to develop a model of Canadian hospital production efficiency in collaboration with the Canadian Institute for Health Information. The model is intended to illustrate the utility of data envelopment analysis as a hospital performance measurement tool for Canadian Institute for Health Information and to augment their current hospital performance indicators. The model measures the overall production efficiency of acute care hospitals using labour and capital inputs together with outputs measuring inpatient and outpatient activity. The model also includes non-discretionary variables adjusting for case-mix variations among the hospitals. The model is extensively validated and identifies a set of highly referenced, efficient hospitals ideal for the establishment of best practices.
Introduction
Developed countries spend a sizeable portion of their national income on health care annually. In Canada, total health care expenditure increased from US$39.7 billion in 1975 to US$200.1 billion in 2011 and is forecast to have reached US$211.2 billion in 2013. It accounted for 5.4% of Canada’s gross domestic (GDP) in 1975 and is forecast to have reached 11.2% of GDP in 2013. In addition, health care expenditure in Canada is largely financed by the public sector, as governments and government agencies accounted for approximately 70% of health care spending in 2011. 1 Therefore, the government needs to ensure that its capital is being effectively utilized. In addition to the government, there are also many other potential stakeholders interested in studies on the efficiency of health care delivery, including other health care purchasers, health care providers and the general public. Health care purchasers will want to be able to discriminate between different providers in order to determine which one provides the best value, and health care providers seek to measure themselves relative to their peers in order to identify best practices and improve their own performance. Finally, the general public has been increasingly demanding reliable information about the performance of its health care systems. 2
Despite the increasing public sector expenditures on health care, Canadians are still faced with lengthy waiting lists, hospital closures and other cost-cutting measures, leading to the perception of inefficient health care delivery in Canada. In turn, heightened concerns over the costs of health care and sustainability in the face of an aging population have increased the demand for public accountability, and ever-improving performance-measurement techniques have led to a surge in interest in measuring the efficiency of health care systems.
As the centre of any health care system, hospitals make up the largest component of health care expenditures in Canada, accounting for 29.5% of total health expenditures in 2011 (although this number has decreased from approximately 45% in the mid-1970s). 1 Many different approaches have been applied to measuring the efficiency of hospitals, from conventional methods such as ratio and regression analysis to advanced frontier analysis approaches. One of the frontier analysis approaches, data envelopment analysis (DEA), has been applied extensively to efficiency measurement in health care. It has been used to assess the performance of health districts, primary care delivery, hospitals, nursing homes, pharmacies and other types of health care organizations. At the hospital level, DEA has most commonly been applied to measuring the overall production efficiency, assessing how efficiently hospitals produce outputs such as patients treated using capital and labour inputs. DEA has also been applied to examining specific hospital services and patient groups. It is particularly well-suited to measuring the efficiency of hospitals because it is able to accommodate multiple, heterogeneous inputs and outputs in order to model the complex relationships that exist between them.
The remainder of this paper is organized as follows: ‘Literature review’ section gives a brief literature review of hospital efficiency assessment, while ‘Data envelopment analysis models’ section reviews basic DEA models and their relevant extensions. ‘Measuring hospital production efficiency’ section uses DEA methodology to develop a hospital production efficiency model to measure Canadian acute care hospitals. Finally, ‘Conclusion’ section provides conclusions based on the model and suggests future research directions.
Literature review
In a broad sense, efficiency can be viewed as the extent to which objectives are achieved in relation to the resources consumed. Therefore, the analysis of efficiency is concerned with measuring the competence with which inputs are converted into outputs. 2 Within the health care context, the production efficiency of a hospital refers to the manner in which services are produced. For example, health care is inefficiently produced if a hospital is half empty or employs skilled labour to do work that can be done by less-skilled workers. The various techniques used in measuring hospital production efficiency are reviewed in this section.
Parametric methods
Ratio analysis uses either single input and output or multiple ratios to measure efficiency; however, health care organizations appearing efficient in one set of ratios may appear inefficient in another. Stochastic Frontier Analysis (SFA) is a parametric method that specifies the production function in a manner similar to regression analysis. However, it is a stochastic process that decomposes the residual error term into inefficiency and random error. As with regression analysis, models with both multiple inputs and multiple outputs are methodologically challenging with SFA, and therefore the multiple inputs are often combined into a single cost function. 2
Data envelopment analysis
DEA is a non-parametric method that specifies the shape of the production frontier from observed data and therefore places no restrictions on the form of the efficient frontier. In addition, DEA is able to handle multiple inputs and outputs for each entity under evaluation in the form of a single efficiency score. It follows that DEA has been applied to all different types of health care organizations, from different hospital types to primary care delivery, nursing homes and pharmacies. 3 However, very few studies have been undertaken on Canadian hospitals.
Several studies have examined the effect of ownership structure on hospital production efficiency. Grosskopf and Valdmanis 4 and Morey et al. 5 examined 22 public and 60 private hospitals in California and found that the public hospitals are more efficient overall. Valdmanis 6 corroborated these findings on a sample of Michigan hospitals and suggested that public hospitals may be more efficient due to the tight governmental control over the resources allocated to them. Moreover, Hollingsworth et al. 7 found the average efficiency score for US public hospitals to be 0.96 versus 0.80 for not-for-profit hospitals. Not-for-profit hospitals also had a much greater efficiency spread, suggesting the potential for substantial efficiency gains.
A number of studies have examined the impact of varying the input and output specifications in hospital production efficiency models.8,9 Magnussen 10 measured the production efficiency of 46 Norwegian hospitals using labour and capital inputs and specifying various output vectors. Notably, he examined the disaggregation of outputs based on patient complexity and the type of activity and found the rank correlation between the models to be 0.78, again revealing significant sensitivity to the model specification. Another research investigated 113 Ontario hospitals to compare their efficiency differences before and after involving case-mix as a separate output. The research showed no significant difference before and after adding case-mix in the outputs. However, the efficiency of hospitals was apparently changed when case-mix was treated as a weighting device rather than a separate output. 11
DEA studies have also been undertaken on specific hospital services. Examples of such studies include the examination of operating room efficiency at 24 US Veterans Health Administration hospitals; 12 the examination of nine California obstetrics departments; 13 an analysis of 49 UK neonatal units where significant technical and scale inefficiencies were found; 14 and an efficiency comparison between hospitals using electronic medical records and other acute care hospitals. 15
Data envelopment analysis models
DEA is a fractional linear programming technique that can be used to rank and compare the relative performance of various entities, termed Decision Marking Units (DMUs). The first DEA model, termed the CCR model, was developed by Charnes et al. 16 as a method for evaluating publicly funded programs, but has since been applied to many industries including health care, financial services and high technology. The BCC model was then proposed by Banker et al., 17 relaxing the constant returns to scale assumption of the CCR model (i.e. if inputs are changed by a positive proportional factor, outputs become increased by that same factor) and thus was also named variable returns to scale (VRS) DEA. An input-oriented BCC model was employed in this research due to the wide range in hospital size (thus, the VRS model was selected) and the properties of the BCC model in units and translation invariance.
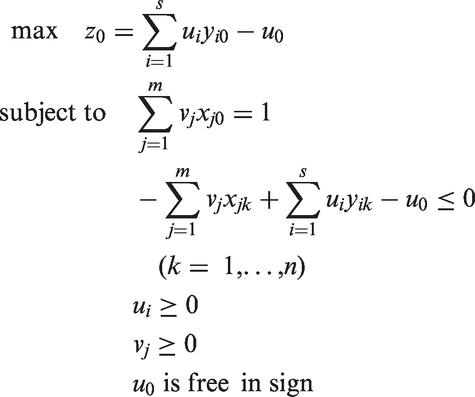
The multiplier form of the BCC model is shown below
The BCC model also has a dual envelopment form
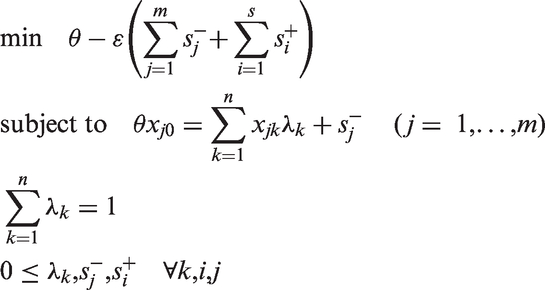
The BCC model varies from the CCR model only in the presence of the free variable u0 in the multiplier form and the additional constraint Σ λ = 1 in the envelopment form. The constraint Σ λ = 1 is known as a convexity constraint, which combines with the constraint λk ≥ 0 to impose a convexity condition on the permissible ways in which the n DMUs can be combined. The variable u0 of the multiplier form identifies the returns-to-scale situation for a DMU on the efficient frontier. A positive u0 is indicative of decreasing returns-to-scale, a negative u0 is indicative of increasing returns-to-scale, and u0 = 0 is indicative of constant returns-to-scale. 18
Measuring hospital production efficiency
The data source
A model of Canadian acute care hospital production efficiency was developed using data from Canadian Institute for Health Information’s (CIHI’s) Canadian Management Information Systems Database (CMDB), which contains financial and statistical information about hospitals and health regions across Canada. The hospital production model was developed using CMDB hospital records for the period of 1 April 2005 to 31 March 2006. Aggregate data for all 469 Canadian acute care hospitals reporting to the CMDB were initially included. However, the dataset required significant refinement. More than half of the 469 hospitals had to be excluded from the analysis due to blank data fields.
Further, the hospital production efficiency model also utilizes average inpatient Resource Intensity Weight (RIW) and Expected Length of Stay (ELOS) statistics drawn from the Discharge Abstract Database (DAD) in combination with the data from the CMDB. Therefore, those hospitals for which the number of inpatient cases as measured by the DAD did not match inpatient and resident (patients admitted on a longer-term basis, defined below) cases (measured by the number of discharges and deaths) as measured by the CMDB to ±15% were also excluded. A small discrepancy between the two values is reasonable due to the different reporting requirements of the two databases and the inclusion of residents in the CMDB data only. However, a large discrepancy suggests either a data error or a large number of residents at the hospital (who would not be accounted for in the RIW and ELOS variables). Eliminating such hospitals ensures the exclusion of potentially erroneous data and increases the accuracy of RIW and ELOS in adjusting for variations in the hospitals’ case-mix complexities by ensuring that the variables incorporate the vast majority of the hospitals’ discharged and deceased patients. This data check did not require the exclusion of many hospitals as the hospital production efficiency model examines acute care hospitals, which tend to admit fewer residents, who are usually instead admitted to extended care facilities, personal care homes or group homes.
These exclusions left 154 hospitals that were analyzed in the hospital production efficiency model. When measured in terms of inpatient and resident admissions, the hospitals included in the model tended to be larger institutions, with an average of 9201 admissions in the 2005 fiscal year versus an average of only 5017 admissions for the entire hospital population. The exclusions were mostly smaller hospitals that likely do not have the resources to track and report all data metrics to the CMDB, and the left ones are rather standard hospitals providing representative analysis results. Furthermore, the refined dataset mixed hospitals across Canada having a variety of distinctions in teaching status, size, occupancy rate, patient age, location, etc., which we will give detailed analysis in ‘Factors affecting efficiency’ section; therefore, this ensures that the findings of our research are generalizable and would be applicable or referential in other places.
Selection of inputs/outputs
Inputs
Service Recipient Workload Units (SRWU)
SRWUs measure the time spent by Unit Producing Personnel (UPP) performing service recipient activities of the hospital. UPP are those personnel whose function is carrying out activities contributing to the fulfilment of the hospital functional centre’s service mandate. SRWU is a measure of the hospital’s labour input in treating all types of patients.
Bed Days
Bed Days staffed and in operation (bed Days) measures the calendar days that beds and cribs are available and staffed to provide services to inpatients and residents. 19 It is a measure of the hospital’s capital input.
Outputs
Inpatient/Resident Discharges and Deaths
Inpatient/Resident Discharges and Deaths measures the volume of inpatient activity handled by a hospital by counting inpatient and resident cases at their point of separation from the hospital either due to discharge or death. (Deaths are included in this measure because, strictly speaking, a deceased patient consumed hospital resources just as a discharged patient had, and this model aims to measure production efficiency.) In this context, an inpatient refers to an individual who has been accepted by the hospital in order to receive health services on a time-limited basis and who has been assigned a bed.
Outpatient Visits
Outpatient Visits measures the number of occasions during which service recipient activities are provided face-to-face or by videoconference to an outpatient. In this context, an outpatient refers to an individual who has been accepted by the hospital in order to receive health services without being admitted as an inpatient or resident and who has not been referred-in from another hospital.
Inpatient surgical visits
Inpatient surgical visits measures the number of inpatient surgical interventions in an operating room. (If an inpatient undergoes multiple surgeries, each is counted as a separate visit.)
Outpatient surgical visits
Outpatient surgical visits measures the number of outpatient surgical interventions in an operating room. (If an outpatient undergoes multiple surgeries, each is counted as a separate visit.)
RIW
The RIW is a resource allocation metric developed by CIHI for estimating the costs of acute inpatients and day surgery cases. RIW estimates the expected resource intensity of each inpatient relative to the average inpatient cost, which is represented by an RIW of one. It is based on the most recently available actual patient-specific Canadian cost data and is determined by assigning patients to clinically homogeneous groups based on their diagnoses, co-morbidities, age and other relevant factors. 20
ELOS
ELOS is a metric developed by CIHI that represents an estimation of the typical length of stay for acute inpatient cases. In this model, the average ELOS for all of a hospital’s inpatients is used. ELOS is based on the most current patient LOS data available, and similar to the RIW, it is determined by assigning patients to groups with homogeneous lengths of stay based on their diagnoses, co-morbidities, age and other relevant factors. 20
In the model, RIW and ELOS are treated as non-discretionary variables since their values are directly the result of the case mix treated by the hospital and are used to control for variations in the hospitals’ case-mix complexities. Such variables are necessary as the hospitals analyzed in this model are from all across Canada and operate in very different environments. However, RIW and ELOS pertain only to the hospitals’ inpatients and therefore do not adjust for variations in the hospitals’ outpatient case-mix complexities. The case-mix adjustment variables are treated as outputs because increasing values for RIW and ELOS represent increasingly complex case mixes, and a hospital can only be reasonably compared to those peers with equally or more complex case mixes.
It is also worth noting that patient discharges were specified as the unit of measurement for inpatient activity in place of patient days, consistent with the recommendations of Magnussen 10 and Parkin and Hollingsworth, 21 as the latter was shown in our model to penalize the possible substitution between length of stay and intensity of resource use. Moreover, concern over the lack of medical homogeneity in patient discharges was partially mitigated in the hospital production model due to the inclusion of the case-mix adjustment variables.
There were concerns over correlations between various variables in the hospital production model. As a general rule of thumb, when the correlation between two variables exceeds 0.95, either such variables should be combined or one should be removed. 22 One example of correlative variables in our research is UPP Worked and Purchased Hours (UPP Hours), which measures the total number of hours of UPP time consumed by the hospital. The input UPP Hours was very strongly correlated with both the input SRWU (0.96) and the output Outpatient Visits (0.97) (Table 6). Further, it was strongly correlated (between 0.90 and 0.95) with the input Bed Days and the outputs Inpatient/Resident Discharges and Deaths and Inpatient Surgical Visits. Therefore, it was determined that UPP Hours should be excluded from the hospital production model.
Analysis of results
Data for the eight most highly referenced efficient hospitals from the hospital production model.

ELOS: Expected Length of Stay; RIW: Resource Intensity Weight; SRWU: Service Recipient Workload Units.
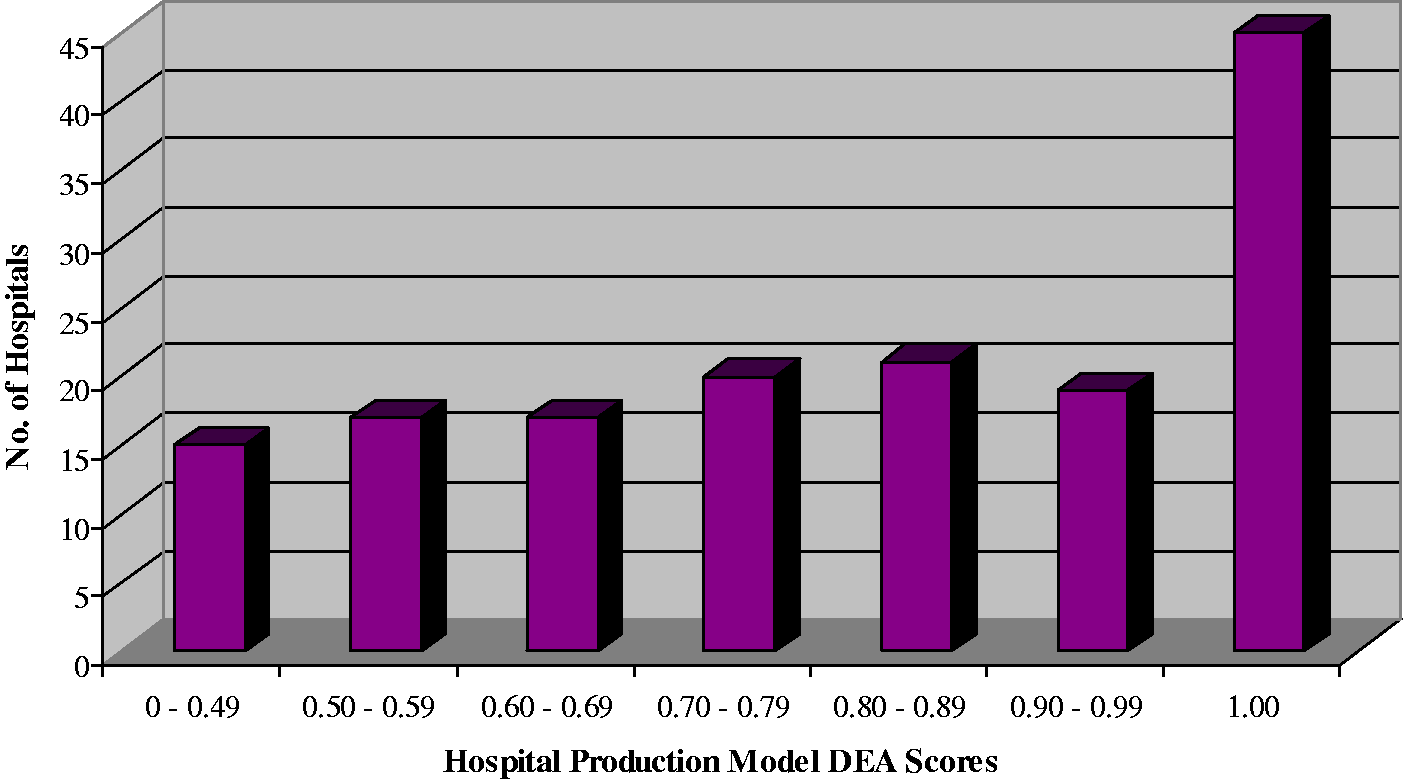
Frequency distribution of hospital production model efficiency scores.
While similar studies examining the production efficiency of hospitals using comparable input and output vectors have been performed, to the best of our knowledge, none has been undertaken on Canadian hospitals and therefore direct comparisons cannot be made. Differences in the ownership structures of hospitals (among other factors) make it impossible to compare the results of a Canadian hospital efficiency study with one from another country. In Canada, hospitals are predominantly privately run, not-for-profit institutions. (That is, although Canadian hospitals are publicly funded, they are owned and operated by private organizations such as communities, regional health authorities or religious associations. 23 By contrast, the US, for example, has a larger share of for-profit and publicly run hospitals. 24 Moreover, it has been shown that hospital DEA scores are affected by ownership structure.4,5,25 Simply as a frame of reference, however, Grosskopf and Valdmanis 26 looked at private not-for-profit hospitals in New York and California using comparable input and output vectors and risk-adjustment techniques to our hospital production model. They found that the average technical efficiency of the New York hospitals is 0.86 and the California hospitals 0.85. Notably, however, they only looked at large urban hospitals, and their sample sizes were limited to 49 and 59 hospitals from the two states, respectively. As both of these factors are likely to lead to higher overall DEA scores, their efficiency findings appear to be in the same ballpark as the present hospital production model.
Factors affecting efficiency
Once the efficiency of a hospital has been captured by its DEA score, it is useful to try to identify some of the factors that affect performance. In this section, the following factors are examined for their effect on performance: the hospital’s teaching status, size and occupancy rate as well as patient demographics.
Since the theoretical distribution of DEA efficiency scores is usually unknown, nonparametric statistical tests that are independent of the distribution of the data are used in the analysis of the hospital production efficiency model. Specifically, the Mann–Whitney U-test was used to test for statistically significant differences between two sets of DEA scores, as suggested by Cooper et al. 18 Differences in DEA scores were tested at the 0.05 significance level. As well, the nonparametric Spearman rank correlation coefficient was used in place of the standard Pearson product–moment correlation coefficient to examine the relationship between different variables.
Teaching hospitals
One might have expected that teaching hospitals would have lower efficiency scores in a production model as the added focus on training students may reduce their labour efficiency. For example, Kooreman 27 found the presence of nurse trainees to have a negative impact on the efficiency of nursing homes. Clearly, however, teaching hospitals were not disadvantaged in the hospital production model and, in fact, may have performed slightly better than non-teaching hospitals. Of the 154 hospitals included in this model, 16 are teaching hospitals, and the average efficiency score of which was 0.87, whereas the average score of the non-teaching hospitals was 0.78. Further, half of the teaching hospitals were ranked as efficient. The Mann–Whitney U-test indicated, however, that the scores for the two sets of hospitals were not statistically significantly different (p = 0.070), likely due to the large difference in their sample sizes. Further, when the 16 teaching hospitals were removed and the hospital production model was re-run, the results were almost identical. The average efficiency score only increased from 0.79 to 0.80, and the percentage of efficient hospitals only increased from 29% to 33%. This suggests that there are non-teaching hospitals in the sample that are very comparable to the teaching hospitals, and they assume similar positions on the efficient frontier when the teaching hospitals are excluded from the model.
Hospital size
Effect of hospital size on performance.

Using the Mann–Whitney U-test to compare the first and fourth quartiles indicated that their efficiency scores are not statistically significantly different (p = 0.823). When the sample was divided in half, however, there was a statistically significant difference between the efficiency scores (p = 0.046). This difference is the result of the unusually low-efficiency scores observed in the second quartile of the sample. As will be shown immediately below, a higher occupancy rate is associated with better efficiency, and the second quartile in Table 2 had the lowest average occupancy rate at 83%, well below the population average of 90%. Thus, the inefficiency in the second quartile is at least partially the result of unused capacity. The hospitals in the third and fourth quartiles may be considered to be large urban hospitals (the hospitals in these quartiles average 185 and 532 beds, respectively, calculated by dividing Bed Days by 365 days per year), whereas the hospitals in the first quartile (averaging 29 beds) may be considered to be small community hospitals. The hospitals in the second quartile (averaging 71 beds) appear to be stuck in the middle. They may be too large to be community hospitals and perhaps offer a wider range of services out of necessity, thus reducing their efficiency.
The Spearman rank correlation between Bed Days and hospital efficiency was only 0.07 and statistically insignificant (p = 0.344). Thus, these findings suggest that there appears to be no clear relationship between hospital size and efficiency, which is an expected result as the hospital production model was run under VRS, measuring efficiency conditionally on hospital size. It should be noted, however, that the 12 largest hospitals in the sample, those with over 200,000 Bed Days, did have an average efficiency score of 0.92, well above the overall average score of 0.79. These hospitals had high-occupancy rates (averaging 96% occupancy), and further, their very large size may lead to efficiencies as a result of economies of scale.
Hospital occupancy rate
Effect of occupancy rate on hospital performance.
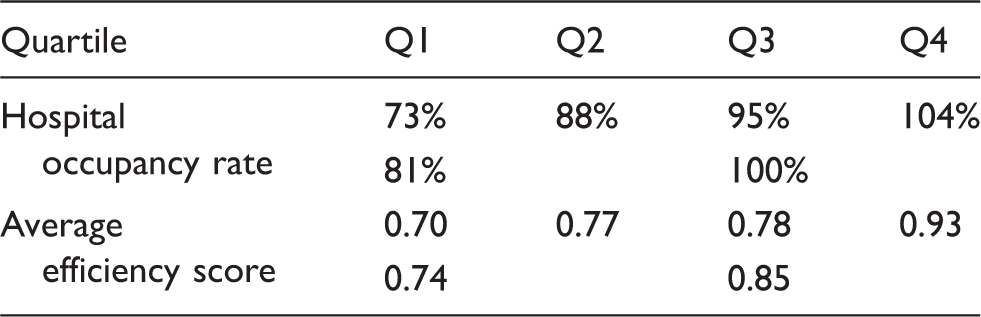
Using the Mann–Whitney U-test to compare the first and fourth quartiles indicated that they have efficiency scores that are statistically significantly different (p = 5 × 10⁻⁵). Similar results were found when the sample was divided in half (p = 6 × 10⁻⁴). The Spearman rank correlation between hospital occupancy rate and efficiency was 0.35, and this correlation was statistically significant (p = 6 × 10⁻⁶). It is fully expected that occupancy rate would have a positive effect on efficiency because it suggests that the hospital’s capital resources (measured in the hospital production model by Bed Days) are being utilized rather than lying vacant. Interestingly, a very similar positive relationship was found between hospital occupancy rate and efficiency when the capital input variable (Bed Days) was removed from the hospital production model and only the labour input variable (SRWU) was used. This suggests that labour efficiency also increases with higher occupancy rates. This may be because the UPP at hospitals with high-occupancy rates are handling many patients simultaneously and cannot afford to spend a great deal of time with individual patients. Conversely, the UPP at hospitals with low-occupancy rates can afford to spend more time with individual patients, thus decreasing their hospital’s efficiency.
Patient demographics
Effect of inpatient age on hospital performance.

Using the Mann–Whitney U-test to compare the first and fourth quartiles indicated that there is a statistically significant difference between their efficiency scores (p = 0.005). Similar results were found when the sample was divided in half (p = 0.036). Further, the Spearman rank correlation between inpatient age and hospital efficiency was −0.23, and this correlation was statistically significant (p = 0.004).
Normally, one would expect to find some inverse relationship between inpatient age and hospital efficiency, since older patients tend to be more resource intensive. However, one would not necessarily have expected to find such a relationship in the hospital production model due to the inclusion of the output variables RIW and ELOS to adjust for variations in the hospitals’ inpatient case-mix complexities. When the case-mix adjustment variables were removed from the hospital production model, an even stronger inverse relationship between inpatient age and hospital efficiency was observed. The Spearman rank correlation increased to −0.40 (from −0.23 above), and the efficiency difference between the first and fourth quartiles divided by average inpatient age became more pronounced (p = 4 × 10⁻⁶ vs p = 0.005 above). These findings suggest that RIW and ELOS partially mitigate the effect of variations in inpatient case-mix complexity on hospital efficiency but do not completely control for such variations in the hospital production model.
Model validation and sensitivity analysis
The validity of findings may be divided into internal and external validity. Internal validity examines whether the methods used alter the results, and external validity examines whether the results can be generalized beyond the current data. 21 Sensitivity analyses are useful for both assessments.
Effect of removing variables from the hospital production model.

ELOS: Expected Length of Stay; RIW: Resource Intensity Weight; SRWU: Service Recipient Workload Units; UPP: Unit Producing Personnel.
It is shown in Table 5 that the removal of UPP Hours from the hospital production model significantly improved the model’s efficiency discrimination by reducing the average efficiency score from 0.86 to 0.79 and the percentage of efficient DMUs from 38% to 29%. Moreover, the high-Spearman correlation suggests that the hospital rankings were not significantly altered, leading to the decision to exclude UPP Hours from the model.
The removal of either input SRWU or Bed Days had a significant impact on the model results both in terms of the general distribution of the efficiency scores, as evidenced by the significant drop in average efficiency, as well as the rankings of the hospitals, as evidenced by the low-Spearman correlation. The removal of Bed Days appeared to have a greater impact on the distribution of the scores whereas the removal of SRWU appeared to have a greater impact on the hospital rankings. It is not surprising that the removal of either input significantly affected the model results as they measure two very different resource categories (capital and labour), and thus either one’s removal would result in significant information loss.
On the output side, removal of Inpatient/Resident Discharges and Deaths significantly affected the distribution of efficiency scores but had a lesser effect on the hospital rankings. None of the other outputs appeared to significantly alter the model results when individually removed. It is expected that the removal of outputs would have a lesser impact on the hospital production model as the model is input-oriented, and thus the radial efficiency variable is only applied to the inputs. Outputs are indirectly considered when assessing a DMU’s efficiency.
Finally, the external validity of the hospital production model was assessed by looking at the consistency of the results over time. In this analysis, the hospital production model was re-run using 2004 data, and the efficiency scores were compared to the 2005 results (Table 8). However, of the 154 hospitals included in the 2005 results, only 135 were used in this test of external validity as 19 had to be excluded due to missing or potentially erroneous 2004 data. The average efficiency score was 0.79 in 2004 versus 0.80 in 2005. The standard deviation was 0.20 for both years. Thirty-two percent of the hospitals were efficient in 2004 compared with 31% in 2005. In both 2004 and 2005, the lowest individual efficiency score was 0.29 for hospital H016. The Mann–Whitney U-test indicated no statistically significant difference between the distribution of efficiency scores for the two years (p = 0.822). The Spearman rank correlation between the two years was 0.89. Further, of the 42 hospitals found to be efficient in 2005, 35 were also efficient in 2004. Thus, neither the general distribution of the efficiency scores nor the rankings of hospitals appear to vary much from year-to-year, and the hospitals ranked as efficient largely remain consistent from year-to-year.
Conclusions
This study focused on employing DEA methodology to measure the production efficiency of acute care hospitals in Canada, using data provided by CIHI. Given the scarceness of the research about the production efficiency of Canadian hospitals, the purpose of the study to offer DEA as an analytical tool for CIHI to augment their current hospital performance indicators as well as illustrate the utility of DEA in such an environment.
The hospital production efficiency model inputs included a capital variable (Bed Days) and a labour variable (SRWU). Outputs measured by the model included inpatient and resident discharges (and deaths), outpatient visits and inpatient and outpatient surgical visits. Case-mix adjustment variables were also included as non-discretionary outputs. UPP Hours was excluded from the model as doing so was shown to improve efficiency discrimination without significantly altering the hospital rankings. Patient discharges were specified as the unit of measurement for inpatient activity in place of patient days as the latter was shown to penalize the possible substitution between length of stay and intensity of resource use. Hospitals appeared to be operating mostly under decreasing returns-to-scale, suggesting against any upsizing or consolidation of the hospitals. Teaching hospitals and non-teaching hospitals were found to be comparable in the hospital production model, and higher occupancy rates were shown to positively affect performance. The case-mix adjustment variables were shown to partially mitigate the effects of inpatient demographics, and better adjustment could be achieved by excluding those hospitals with a significant number of residents (who are unadjusted for). The model was able to identify a set of highly referenced, efficient hospitals ideal for the establishment of best practices. Extensive model validation and sensitivity analysis was also carried out.
The DEA method, through what has been demonstrated in preceding part, could be quite useful to augment current performance indicators used by CIHI, such as the Risk Adjusted Mortality Rate. Further, DEA is particularly useful as signalling devices in order to identify poorly performing hospitals in need of improvement as well as strongly performing hospitals that may represent prime candidates for the establishment of best practice guidelines. Moreover, the examined factors, which are considered to affect the efficiency of a hospital, may actually not play important roles in efficiency evaluation, and this finding could be useful in collecting data for other researchers who want to use the same way in future research, and the sensitivity analysis would be a helpful method in determining inputs/outputs as well.
Correlation analysis for Hospital Production Model.
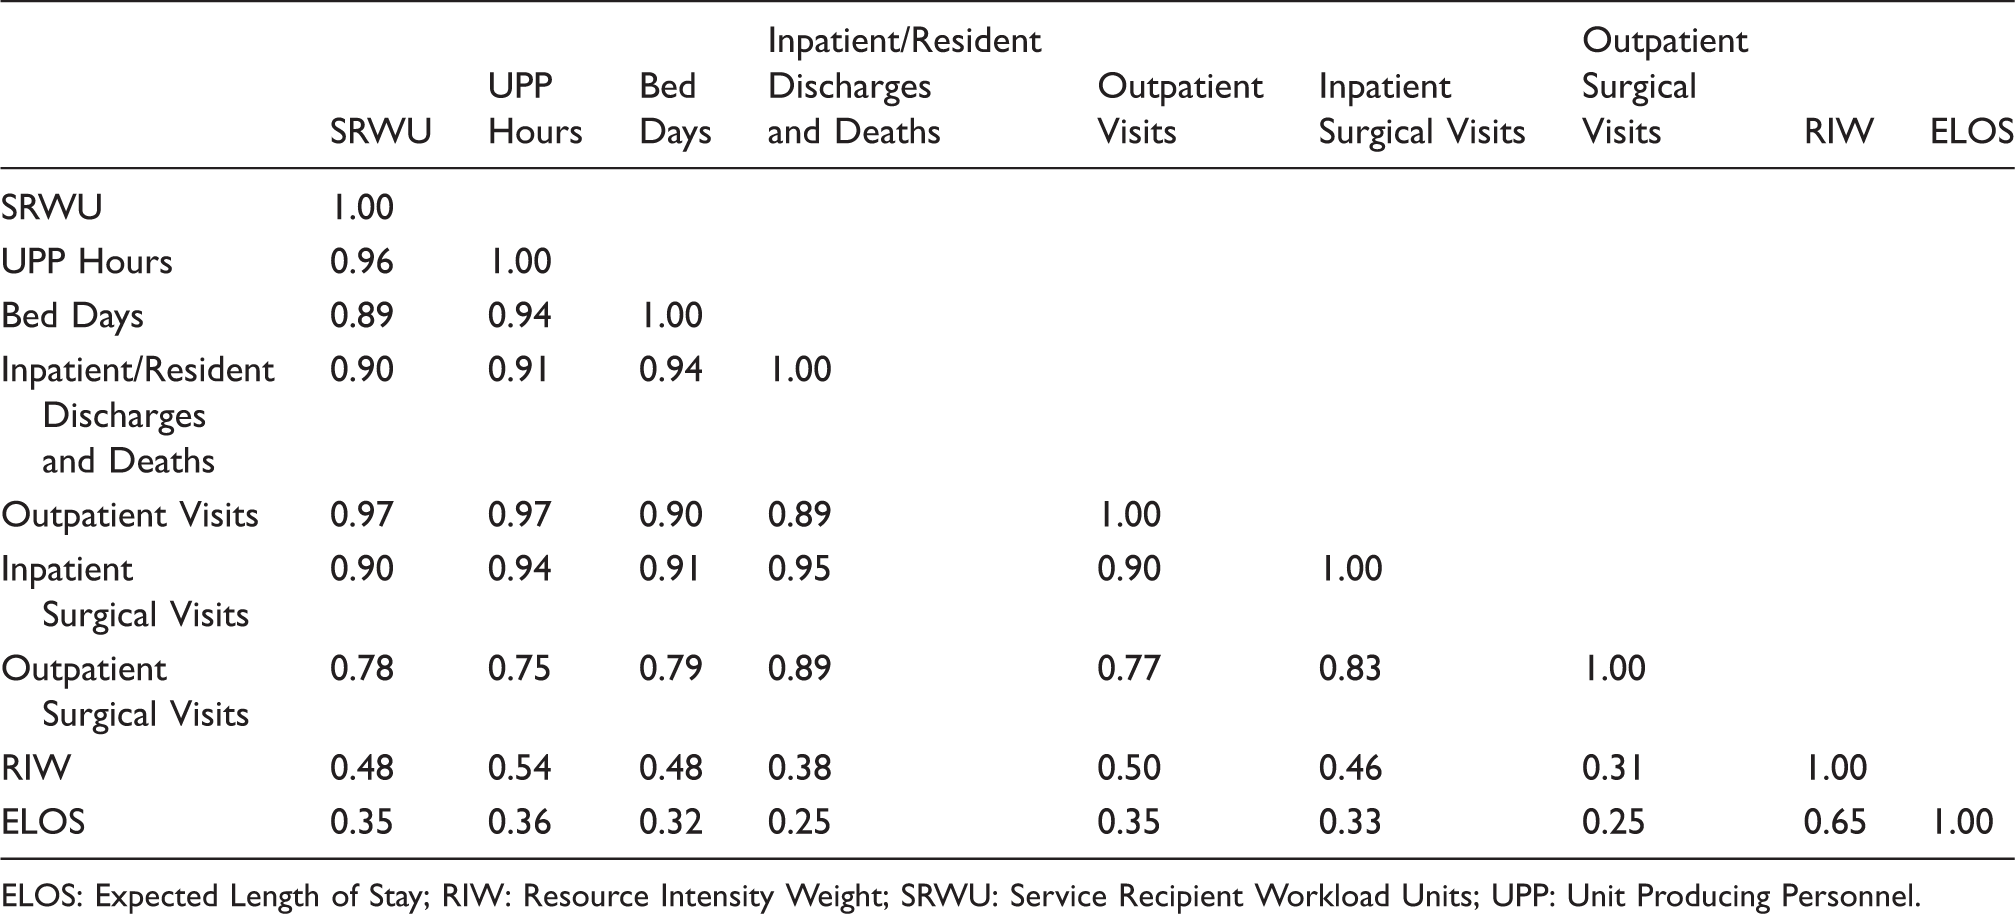
ELOS: Expected Length of Stay; RIW: Resource Intensity Weight; SRWU: Service Recipient Workload Units; UPP: Unit Producing Personnel.
Hospital production model efficiency scores.

DEA: data envelopment analysis.
Hospital Production Model Scores for 2004 and 2005.
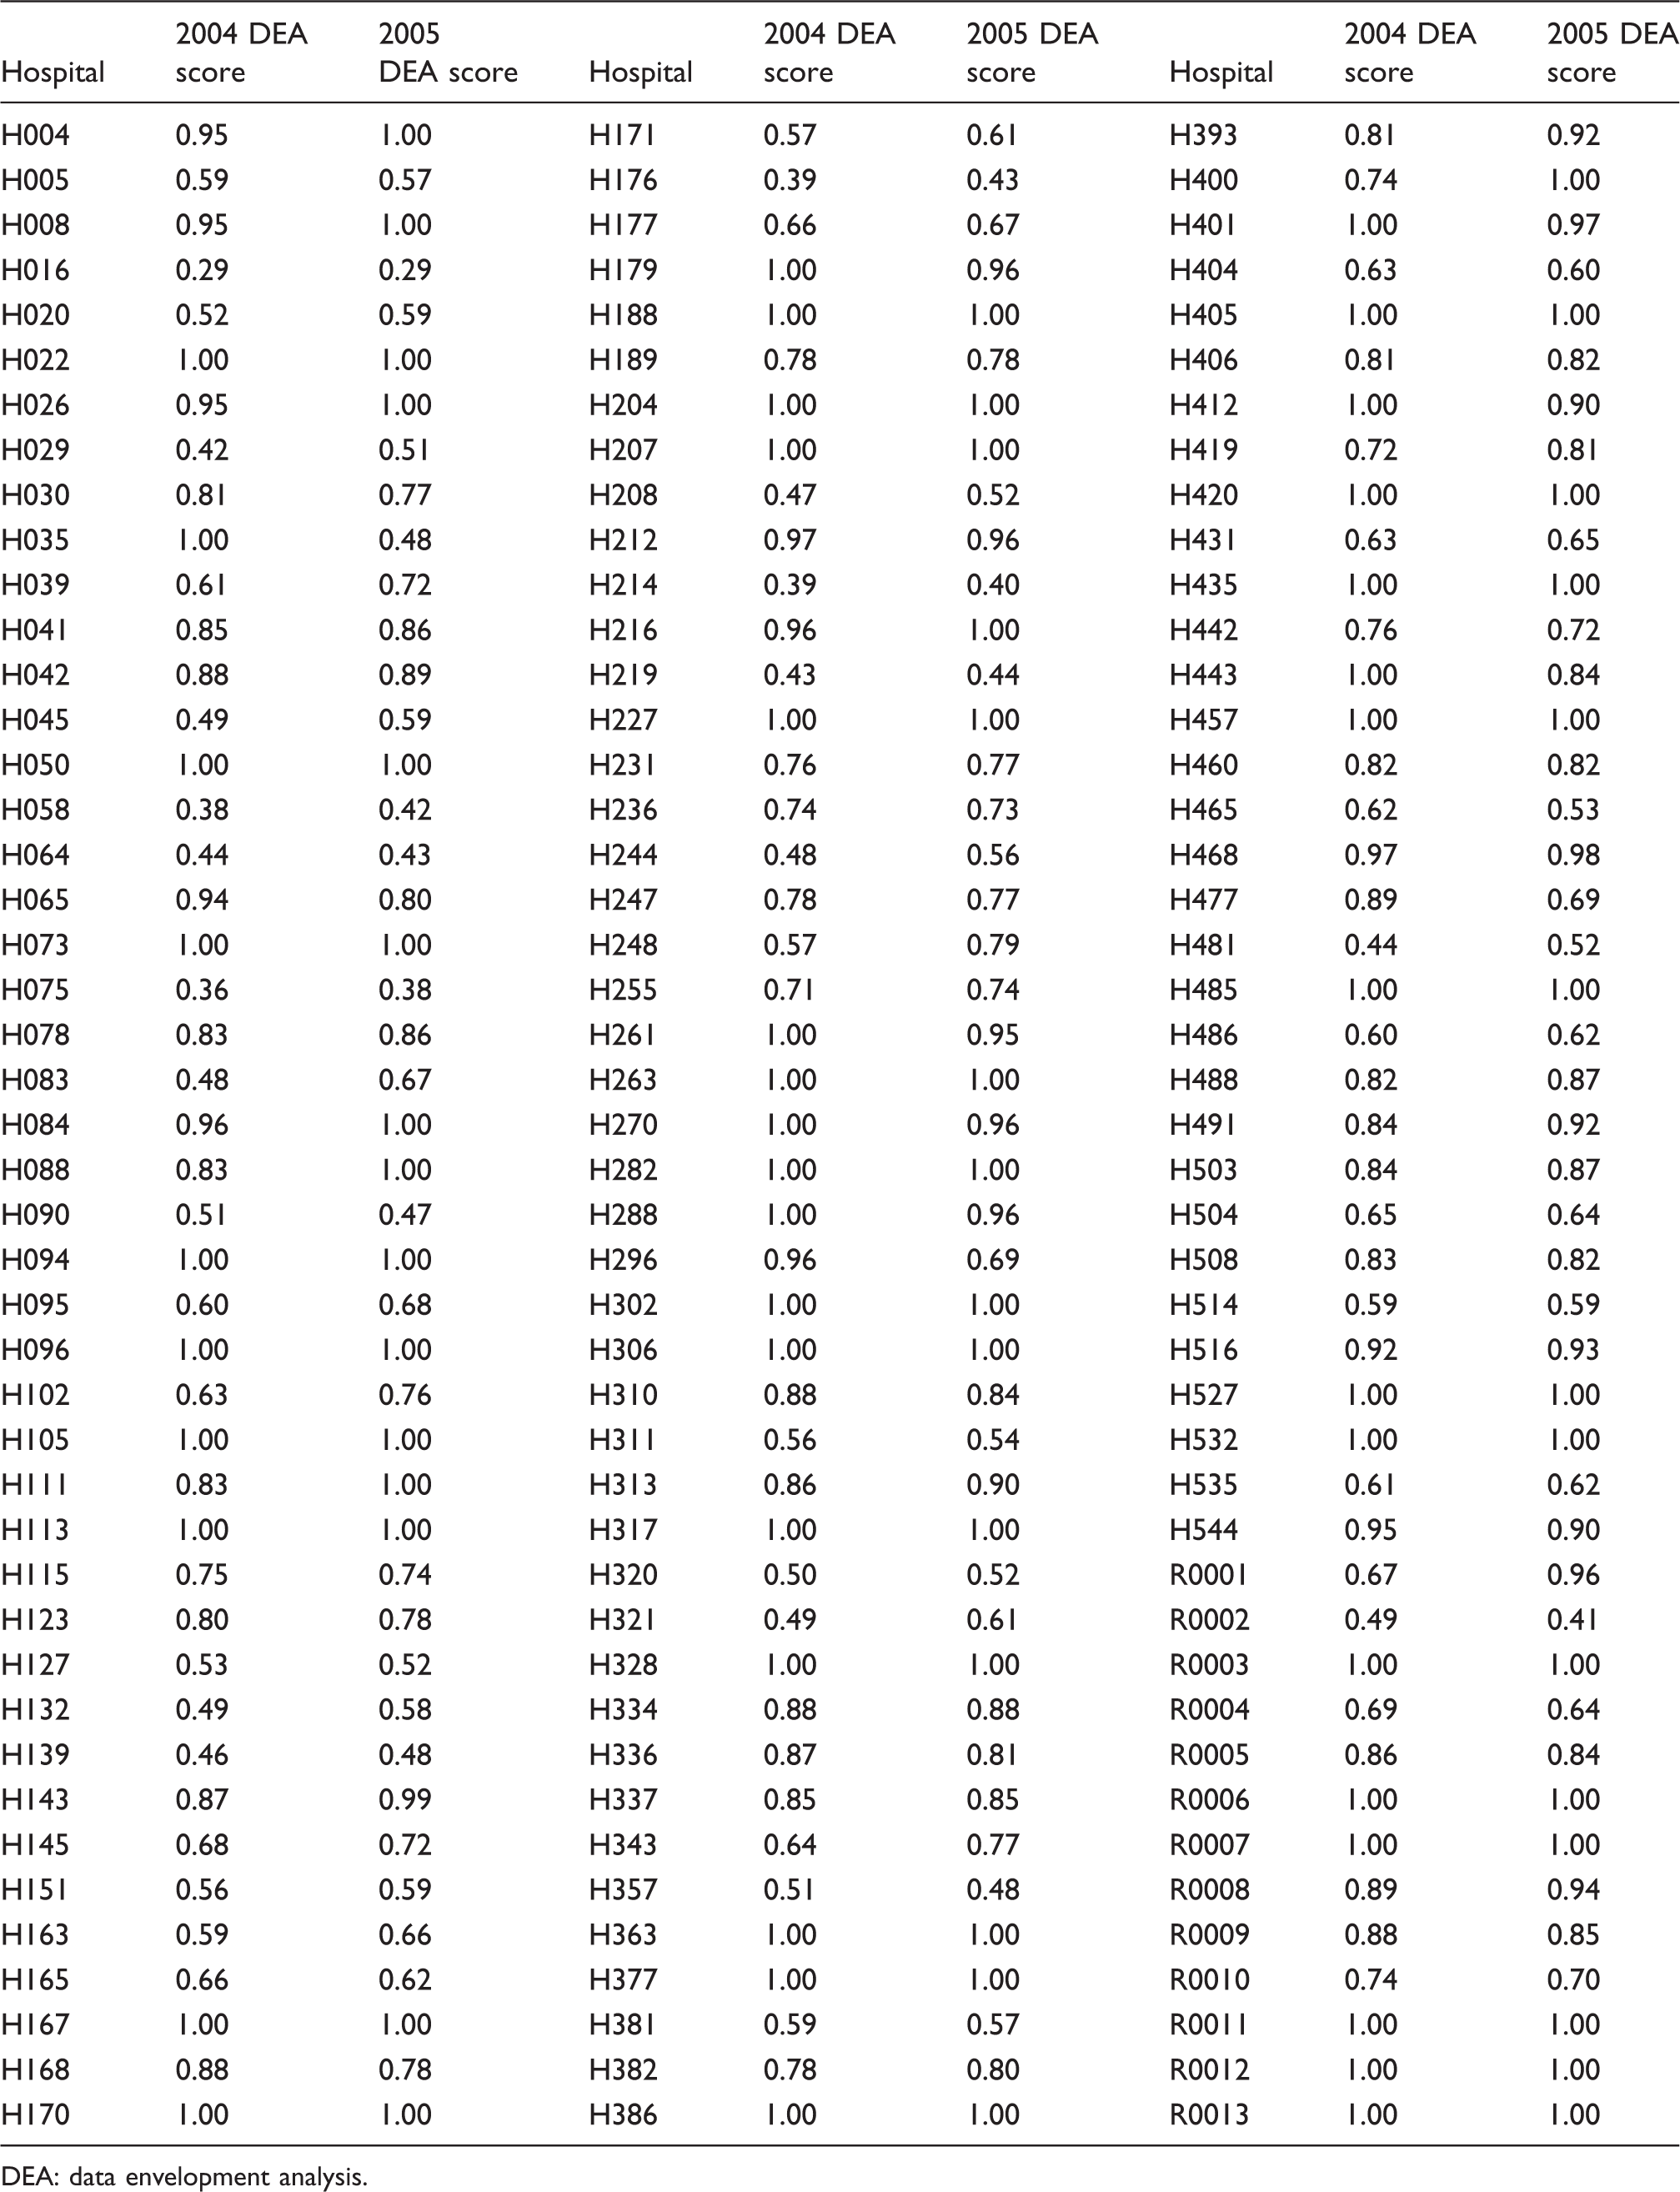
DEA: data envelopment analysis.
Footnotes
Declaration of conflicting interests
The author(s) declared no potential conflicts of interest with respect to the research, authorship, and/or publication of this article.
Funding
The authors gratefully acknowledge the financial support from Bell Canada and large Canadian Banks.