
Abstract
Over the past few years, there has been increased interest in data mining and machine learning methods to improve hospital performance, in particular hospitals want to improve their intensive care unit statistics by reducing the number of patients dying inside the intensive care unit. Research has focused on prediction of measurable outcomes, including risk of complications, mortality and length of hospital stay. The length of stay is an important metric both for healthcare providers and patients, influenced by numerous factors. In particular, the length of stay in critical care is of great significance, both to patient experience and the cost of care, and is influenced by factors specific to the highly complex environment of the intensive care unit. The length of stay is often used as a surrogate for other outcomes, where those outcomes cannot be measured; for example as a surrogate for hospital or intensive care unit mortality. The length of stay is also a parameter, which has been used to identify the severity of illnesses and healthcare resource utilisation. This paper examines a range of length of stay and mortality prediction applications in acute medicine and the critical care unit. It also focuses on the methods of analysing length of stay and mortality prediction. Moreover, the paper provides a classification and evaluation for the analytical methods of the length of stay and mortality prediction associated with a grouping of relevant research papers published in the years 1984 to 2016 related to the domain of survival analysis. In addition, the paper highlights some of the gaps and challenges of the domain.
Keywords
Introduction
Healthcare expenditure constitutes a significant share of the gross domestic product (GDP) of many countries. For example, in 2012 healthcare spending in the UK reached nearly a tenth (9.3%) of GDP.1,2 Government funding in many countries has fallen behind patient care costs, leaving healthcare institutions to face the growing number of patients. 3 Accordingly, cost containment has become one of the most critical challenges in healthcare today. Hospitalisation constitutes the principal cost of patient care and is therefore a main focus in healthcare management.4,5
Patient hospital length of stay typically refers to the number of days that an inpatient stays in a healthcare facility during a single admission. 6 It is considered one of the major indicators for the consumption of hospital resources.7,8 It also provides a better understanding of the flow of patients through a healthcare system which is essential for evaluating both the operational and clinical functions of such systems. Previous research has attempted to group patients by their medical condition, assuming that each disease, illness, or procedure is associated with a recommended length of stay (LOS). 9 Grubinger et al. in 2010 refer to these systems as diagnosis-related-group (DRG) systems. 10 In addition, a relative value, namely case mix index (CMI) can be assigned to a DRG of patients in a medical care environment used in determining the allocation of resources to care for and/or treat the patients in the group. However, both studies assumed that all patients who fall within the same diagnosis-related-group are the same. However, the LOS is a complex metric affected by other factors including each individual’s demographics, treatment complexity, complications and discharge planning which may stretch the LOS beyond the target range.
A model that helps to predict a patient's LOS during a single visit – the time from hospital admission until discharge – can be an effective tool for health care providers to plan for preventive interventions and to improve the utilisation of hospital resources. 11 Moreover, usually caregivers maintain an overall assessment of their patients based on important observations and trends over the first few days of admission. Some research demonstrates a strong correlation between LOS and mortality;12,13 however, other experts/ intensivists consider LOS highly unregarded as a determinant of mortality as it is subject to influences, which may not bear upon the outcome of real interest. For example, a diagnosis which simply requires a prolonged period of hospital care, but which confers a low risk of hospital mortality, would bias the use of LOS as a surrogate for mortality; a condition which requires a series of complex treatment interventions might prolong the stay, without necessarily conferring a high mortality risk. Also, conversely, presentations of high severity of illness scores, as quantified by acute physiology and chronic health evaluation (APACHE) II, 14 Intensive Care National Audit and Research Centre (ICNARC) score, 15 Sequential Organ Failure Assessment (SOFA), 16 or mortality prediction model (MPM), 17 might be associated with a short LOS, because of an early decease, but also a high mortality, further undermining the correlation between LOS and mortality. In contrast, the work by Vincent and Singer linked LOS to mortality.12,13 Results showed significantly greater intensive care unit (ICU), hospital and long-term mortality in patients with an ICU stay longer than than 3 days, in comparison with those who have a stay of 3 days or less.
This paper reviews LOS and mortality applications in acute medicine and critical care units and the correlation among them. Moreover, the paper classifies and evaluates the analytical methods available in the literature over the past three decades. In addition, the paper highlights some of the gaps and challenges of the domain.
The rest of this paper is organised as follows; the ‘Applications of the LOS’ section provides a survey of the different applications of the LOS in the health care domain. The ‘Analytical methods for LOS prediction’ section provides a classification of the analytical methods for LOS prediction associated with a grouping of relevant research papers published in the domain. The ‘Applications in mortality prediction’ section provides a survey of the different applications in mortality prediction, the ‘Methods to mortality prediction’ section provides a classification for the methods of mortality prediction, the ‘Applications in concurrent prediction of LOS and mortality’ section provides some examples of applications in previous literature that predicts both the LOS and mortality, and the ‘Measuring the performance of mortality and LOS prediction models’ discusses performance evaluation of the different LOS and mortality prediction models. Finally, the conclusion is drawn in the ‘Conclusion’ section.
Applications of the LOS
LOS is often used as a surrogate for other outcomes in research, where those outcomes cannot be measured; for example as a surrogate for hospital mortality or ICU mortality. LOS is also a parameter, which has been used to identify the severity of illnesses and healthcare resource utilisation.18–20 As a surrogate outcome measure it is sometimes not highly regarded, as it is subject to influences, which may not bear upon the outcome of real interest. For example, a diagnosis which simply requires a prolonged period of hospital care, but which confers a low risk of hospital mortality, would bias the use of LOS as a surrogate for mortality; a condition which requires a series of complex treatment interventions might prolong the stay, without necessarily conferring a high mortality risk. Also, conversely, presentations of high severity of illness scores, as quantified by APACHE II, 14 ICNARC score, 15 SOFA, 16 or MPM, 17 might be associated with a short LOS, because of an early decease, but also a high mortality, further undermining the correlation between LOS and mortality.
Moreover, the LOS in a hospital may be affected by factors unrelated to the disease, such as the availability of social care or community nursing support. There is an analogous effect upon discharge from critical care to the ward, in the event that there are insufficient ward beds for timely ICU discharge.21,22 Finally, LOS may also be influenced by characteristics of the organisation including hospital management style.23,24
As LOS is an important determinant of both healthcare costs and patient experience, it is a high priority for it to be optimal; therefore it is also significant to identify any factors which affect it. The following two subsections will examine LOS applications in acute medicine and critical care, highlighting factors affecting LOS prediction.
LOS in acute medicine
This section presents previous studies on the different applications used in modelling LOS and its association with influencing factors with respect to patient flow. Patient flow typically refers to the progressive movement of a patient through a sequence of processes. 25 Reducing delays and making sure that the patient receives the right care at the right time will have a significant beneficial effect on the quality of service. In turn, this will improve patient outcomes and reduce the cost of care.
In 2012, Freitas et al. studied variables associated with high LOS outliers, together with some hospital characteristics (administrative, economic and teaching characteristics). 26 Results show that age, type of admission and hospital type were significantly associated with high LOS outliers. Moreover the study conducted by Caetano et al. showed that the top three influential input attributes were the hospital episode type, the physical service where the patient is hospitalised and the associated medical speciality. 27 However, hospital related factors on their own are not sufficient to accurately predict the LOS.
An important variable associated with LOS prediction and common is several studies is the nutritional status of a patient prior to admission. Previous research has examined the effect of the variable malnutrition on patient LOS.28–33 In the study of Robinson et al. in 1987, 28 on average LOS was 15.6 days for a malnourished patient group versus 10 days for the well nourished group. However, in 1997 Chima et al. showed that the LOS for the two patient groups was six days for the at-risk for malnutrition population and four days for the not-at-risk for malnutrition population. 29 The significant decrease in LOS may reflect the fact that all health institutions are under pressures of payment and reviews by government and other third-party payers. In addition, according to Correia et al., 30 the length of hospital stay is shorter in the well-nourished patients, with a median of six days versus nine days for the malnourished. Warnold and Lundhon, 32 studied the clinical significance of preoperative nutritional status in 215 non-cancer patients. The variables investigated included weight loss, weight-for-height index, serum protein levels (serum albumin, transferrin, prealbumin, retinol-binding protein), delayed hypersensitivity skin testing, arm circumference and triceps skinfold thickness. Of the markers evaluated, weight-for-height index, arm muscle circumference, serum albumin level and weight loss correlated significantly to the post-surgery outcome. In addition, Epstein et al. also emphasised that underweight patients have 40% higher LOS than normal weight patients. 33 Also according to Burritt et al., 31 a low serum albumin level is the most sensitive single nutrition-related variable in the prediction of complications and LOS.
Another important variable in a different clinical domain that was also associated with an increase in LOS was serum creatinine (SCr). Chertow et al. 34 evaluated the marginal effects of acute kidney injury (AKI) on mortality, LOS, and costs. Changes in serum creatinine (SCr) was used as a determinant for adverse outcomes. Results show that AKI was consistently associated with an independent increase in LOS. Larger increases in SCr were associated with longer relative increases in hospital LOS.
LOS in critical care
There are significant potential benefits from quantification and optimisation of LOS in critical care: Specifically, these relate to cost containment and clinical quality. The provision of critical care is of necessity expensive, deploying complex interventions and requiring a high intensity of clinician input to a relatively small group of patients. Greater LOS requires more critical care resource and greater cost. As critical care facilities experience increasing pressure and economic resources are more constrained, the priority given to improvements in the timeliness and efficiency of critical care, is rising. 35 Clinical quality in the critical care unit may also be affected by extended LOS. Prolonged LOS gives rise to capacity pressure; this may lead to the cancellation of elective surgery, which is both costly and harmful; it may increase the pressure to decline or delay emergency admission, which could potentially have an adverse effect upon outcome; it may dilute the attention given to the most seriously sick individuals. 36
The critical care unit is also an environment which is well suited to exploiting data for mathematical modelling and prediction, both because of analytical experience and data availability. There are well developed methodologies for performance benchmarking. The increasing use of electronic clinical information systems, means that computer analysis can now be performed directly on the patient record, rather than after specific-to-purpose hand data extraction; the physiological and laboratory data sets are relatively large by comparison with other patient groups.
In England, Wales and Northern Ireland, the benchmarking of critical care unit performance is conducted by the intensive care national audit and research centre (ICNARC), by means of its case mix programme (CMP). 15 The CMP uses rigorous methods to ensure data are complete, valid and reliable;37,38 admissions are scored for severity using an in house scoring system and also the APACHE II model, and then a predicted hospital mortality for admissions is calculated. Comparison is made with actual mortality and a standardised mortality ratio is generated quarterly.37,38 Another example of a non-commercial database of this kind is that held by the Australia and New Zealand intensive care society, which contains data on over 900,000 ICU stays. 39
Several research groups have investigated LOS in the ICU as it has been felt to be a suitable target for improvement.12,13 LOS has been linked to mortality; research in 2006 showed significantly greater ICU, hospital and long-term mortality in patients with an ICU stay longer than than three days, in comparison with those who have a stay of three days or less. Others have sought to develop models which predict LOS; Buchman et al predicted chronicity in a surgical intensive care unit by classifying patients LOS in accordance with a seven day norm. 38 Levin et al. developed a model to produce real-time, updated forecasts of patients intensive care LOS using naturally generated provider orders. 40 The model was designed to be integrated within a computerised decision support system to improve patient flow management. The study compared the predicted LOS to the actual LOS based on fixed variables, such as age, source of admission and readmission status; temporal variables, such as current LOS, day of the week, time of the day, and order-based predictor variables grouped by medication, ventilation, laboratory, diet, activity, foreign body and extra-corporeal membrane oxygenation.
LOS prediction would help with capacity planning. At present, LOS prediction tools are not used in mainstream critical care practice. Surges in demand are managed reactively, requiring considerable staffing flexibility and variability in the balance between demand and capacity. It is possible that accurate prediction of LOS would help to align these quantities in critical care, and improve resource allocation, in particular staffing resource. According to Celi et al, 36 healthcare delivery has worked as well as it has to date because clinicians are bright, hard-working and well-intentioned, not because systems are well designed nor data systematically harnessed.
It follows that the presence of complete, highly detailed critical care databases is essential, if the potential benefits of modelling and prediction are to be fully realised.12,41 Several commercial ICU databases have been developed, archiving patient demographics and aggregating information such as underlying disease, severity of illness and hospital-specific information such as LOS, mortality and readmission. For example, among the commercial ICU databases is APACHE Outcomes, created at Cerner by merging APACHE with Project IMPACT,14,42 and includes data from about 150,000 ICU stays since 2010. The commercial Philips eICU, a telemedicine intensive care support provider, archives data from participating ICUs; Philips eICU is estimated to maintain a database of over 1.5 million ICU stays, and is adding 400,000 patient records per year from over 180 subscribing hospitals in the US. More ambitious still is the multiparameter intelligent monitoring in intensive care (MIMIC) II database established in October 2003. Developed by an interdisciplinary team from academia (MIT), industry (Philips Medical Systems) and clinical medicine (Beth Israel Deaconess Medical Center), the database incorporates two different types of medical data: Clinical data is stored in a relational database and bedside monitoring is stored in flat binary files. There are over 25,000 patients in the MIMIC II relational database, which permits the systematic capture, analysis and integration of information contained within the massive quantity of data generated by each critical care admission. Clearly these kinds of datasets and the several listed earlier could be used to investigate LOS as they provide well-structured high quality data. They could also be exploited for broader research activity.
Analytical methods for LOS prediction
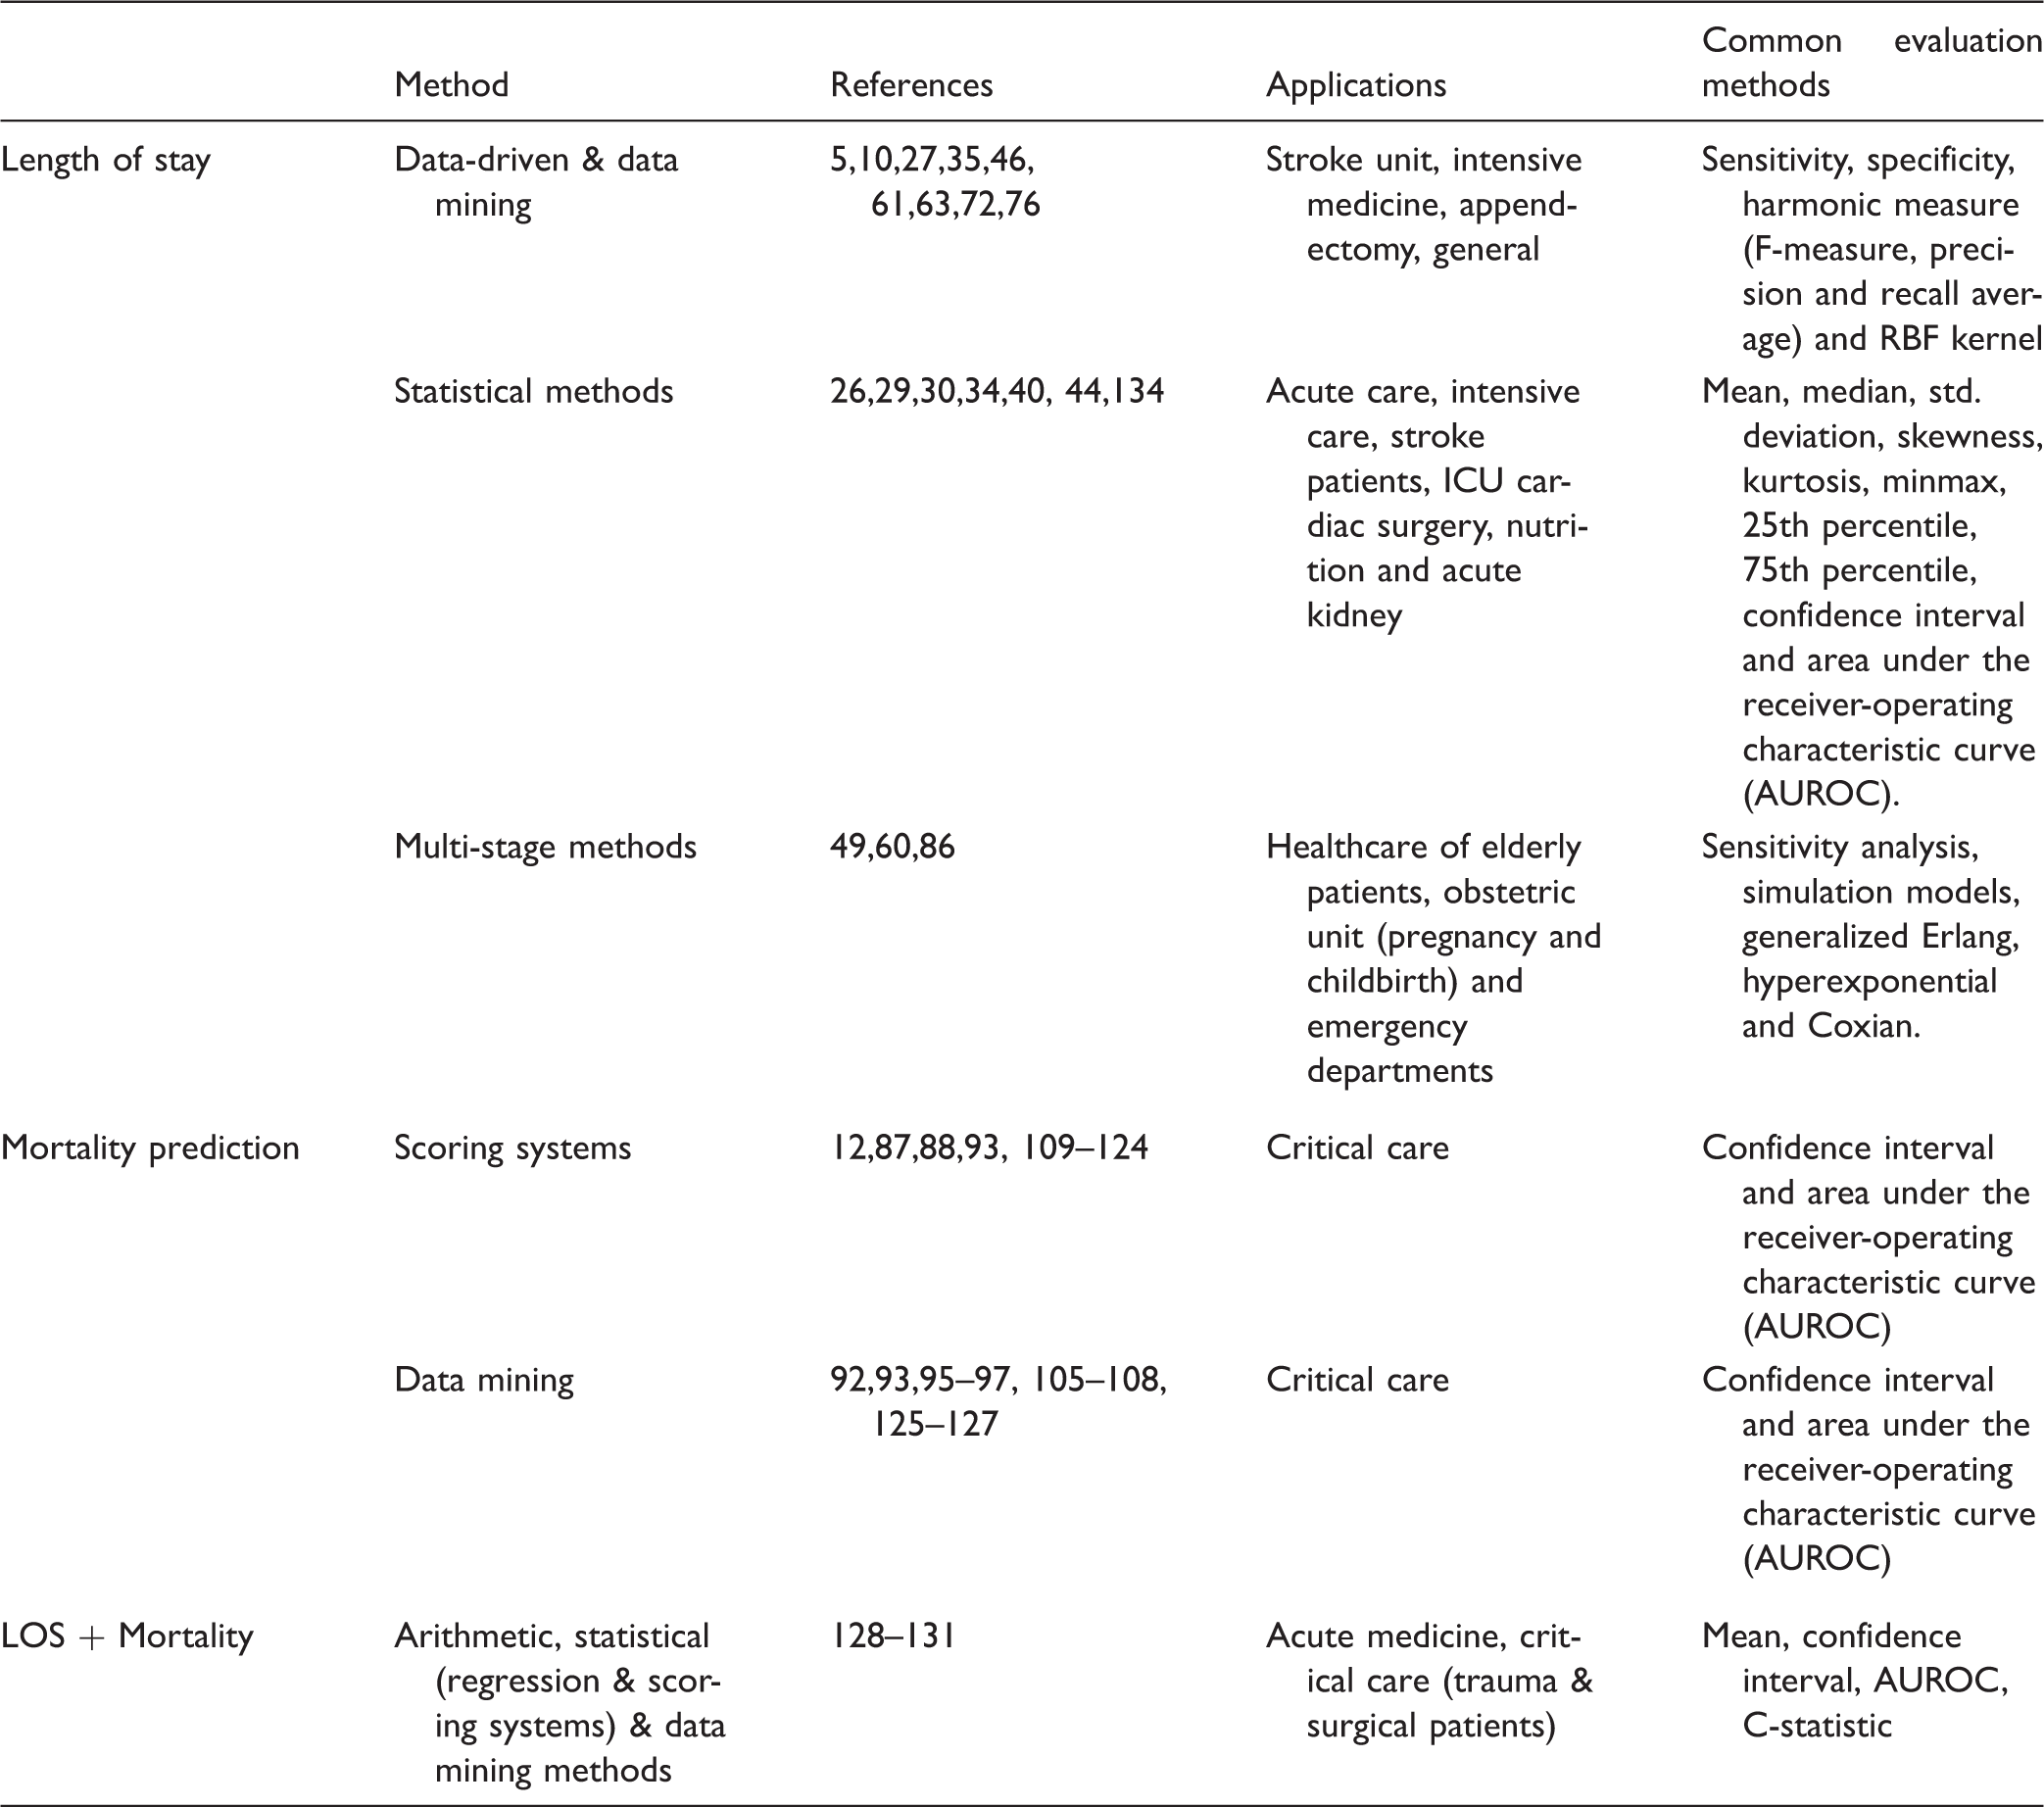
This section explores the methods used in the field of calculating and predicting patient LOS. After surveying the previous literature, LOS prediction methods were categorised into four subgroups as shown in Figure 1. A classification of the reviewed papers based on LOS prediction methods is shown in Table 1.
Classification of LOS & mortality prediction methods. A summary of research papers grouped by analytical methods for LOS and mortality prediction.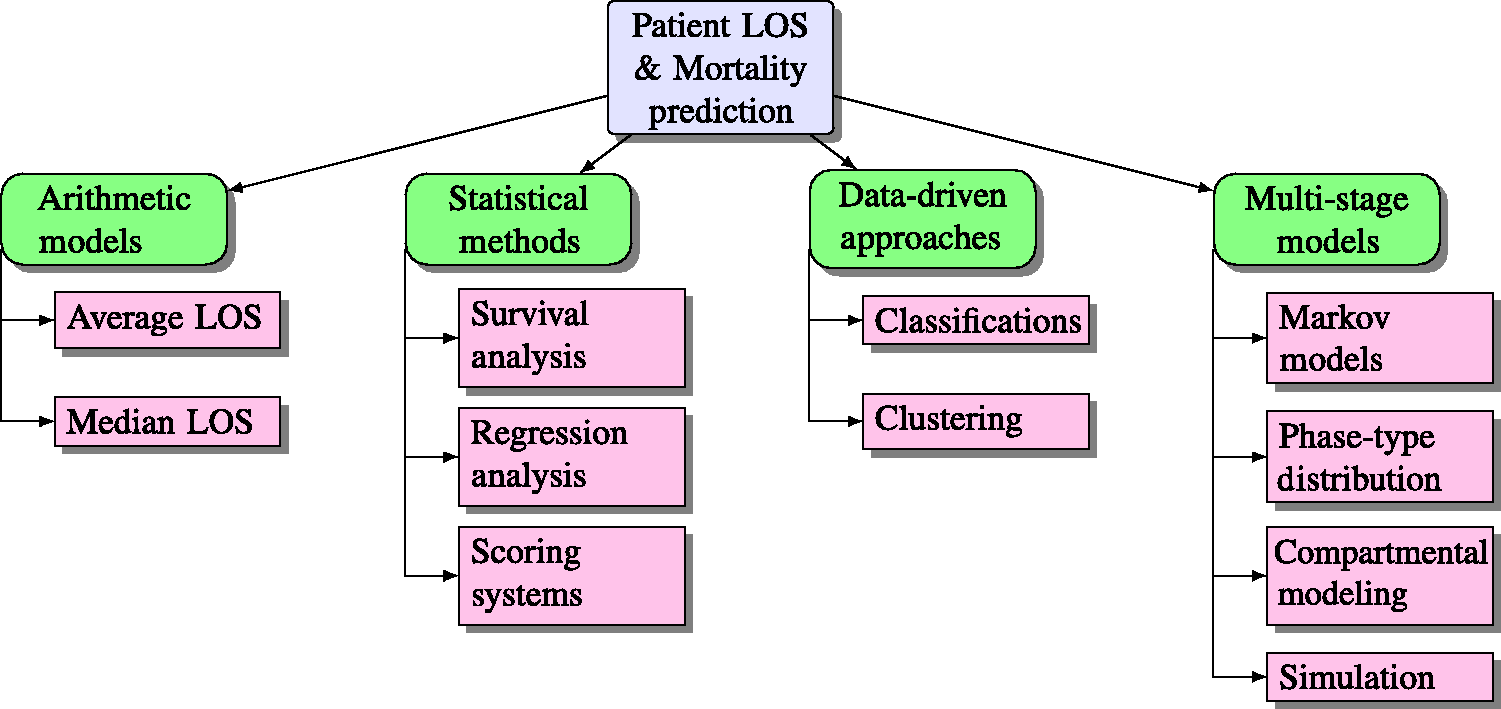
Arithmetic and statistical approaches to LOS prediction
Despite the complex nature of the metric LOS, simple arithmetic methods still exist for the calculation of LOS. 43 Arithmetic methods usually compute the average length of stay or the median as shown. However, this is a very simple way to measure the LOS as it assumes that the LOS is normally distributed, typically the LOS has an exponential distribution. Also Vasilakis et al. 2003 illustrates how average LOS can be a misleading measure; 44 the research proposes alternative statistical techniques survival analysis, on stroke patients, aging 65 years and over. Survival analysis is a branch of statistics that typically uses LOS data to study the effect of different patient attributes on survival time. 45
In addition, Figure 1 highlights a special type of statistical method which includes the analysis of covariates regression analysis. Covariates are defined in the context of LOS as the patient’s characteristics and external factors which possibly predict LOS. Within this type are found linear regression and logistic regression, which is a special case of survival models. 43 The models developed often include the patient’s diagnoses, procedures, gender and age.26,46 Moreover, Freitas et al. used regression models to examine the association of some administrative variables from inpatient episodes in public acute care hospitals in the Portuguese National Health Service with high LOS outliers. 26 The variables include year of discharge, comorbidities, age, adjacent DRG complexity (ADRG), readmission, admission and DRG type, discharge status, distance from residence to hospital and hospital type. Results show that age, type of admission and hospital type were significantly associated with high LOS outliers.
A hospital is a complex stochastic system, therefore simple deterministic approaches for planning and managing such a system is considered inadequate to provide a complete and accurate analysis;4,47,48 also, the resulting models which are mostly based on simple rules modelled with regression trees, are usually further adjusted manually according to medical knowledge, decreasing the predictive accuracy of successive models.49–52 Grubinger et al. argue that any minor change in the data of such simple models can lead to a completely different tree, although all of these trees can be statistically accurate. 10 As a result, the work presented in their research used the bootstrap-based model method bumping to build diverse regression tree models through systematic re-sampling (uniform randomness) of the data. 53 Bootstrap methods are most commonly based on the idea of combining and averaging models to reduce prediction error. Examples of such methods include bagging, 53 boosting, 54 and random forests. 55
A data-driven approach,56–59 which will be discussed thoroughly in the ‘A data-driven approach to LOS prediction’ subsection, can be used to predict which patients seem likely to experience an extended LOS by analysing survival data using decision trees (also called survival trees), artificial neural networks, ensemble methods, etc. Usually these approaches are used to predict categorical survival outcomes (dead or alive) for a given set of patient attributes, or used to measure patient length of stay above or below a certain threshold.
In contrast to the data-driven approaches listed above,56–59 Caetano et al. do not perform a classification task to LOS, 27 instead a more information pure regression approach is adopted which predicts the actual number of LOS days and not classes. The study describes 14 input covariates to the LOS target variable. Six regression techniques were tested and compared: Average prediction (AP), multiple regression (MP), decision trees (DTs), artificial neural network (ANN) ensemble, support vector machines (SVMs) and random forests (RFs). The best results were obtained by the RF model to reveal high impact of inpatient clinical process attributes, instead of the patient’s characteristics. Effective predictions can aid healthcare institutions and clinicians to improve their decisions about patient managements and resource allocations.60–63
Despite such attempts, Marshall et al. and Garg et al. argue that data-driven methods among the other statistical models fail to address the inherent uncertainty, complexity and heterogeneity in health processes.5,7 To address such issues, a more reliable way is to model patient flow as it presents the temporal dimension as well as the structural dimension of the system. 7 Numerous probabilistic models have been proposed to address the issue of LOS, namely Markov models, phase-type distributions, conditional phase-type distributions, compartmental and simulation modelling.5,46,49,60,64 Such models may be used for planning health services for both acute and chronic patients. These models will be discussed thoroughly in the ‘Markov model and phase-type distributions’, ‘Compartmental modelling’ and ‘Simulation modelling’ subsections.
A data-driven approach to LOS prediction
Whereas most previous research examines LOS numerically,65–67 several studies take a data-driven approach to LOS prediction. A data-driven approach refers to a predictive model that is based on data-mining techniques, such as classification, clustering, etc. Such techniques are used to discover useful patterns in large datasets by showing novel and interesting relationships among data variables. Data mining techniques facilitate the creation of knowledge and support clinical decision making, in what is known as medical data mining.68,69
The data-driven approach classification is used to generate early alerts with respect to a target LOS range for a specific diagnosis related group (DRG). For example, Buchman et al. predict chronicity in a surgical intensive care unit by classifying patients LOS in accordance with a recommended seven-day norm. 70 In response to the need for effective resource planning and cost containment, Mobley et al. predict the LOS of patients receiving post-coronary care over the range of 1–120 days. 66 Frye et al. use a technique to predict whether the LOS of patients suffering from burns will fall within a one-week period. 71 Cheng et al. in 2009 introduce a study that examines the LOS management of appendectomy patients by building and empirically evaluating an automatic prediction system to identify those patients whose LOS will likely exceed the recommended five-day period. 72
Hachesu et al. apply three classification algorithms namely, DT, SVMs and ANN to draw an accurate model to predict the LOS of heart patients. 61 To predict the target variable LOS 36 input variables were used. The findings demonstrated that the SVM was the best fit. There was a significant tendency for LOS to be longer in patients with lung or respiratory disorders and high blood pressure. One of the interesting findings was that most single patients (64.3%) had a LOS less than or equal to five days, whereas 41.2% of married patients had a LOS greater than 10 days. The most significant variables affecting LOS were drug categories, such as nitrates and anticoagulants as well as coronary artery disease (CAD) diagnosis. Comorbidity is also a strong predictor of prolonged LOS. Comorbidity is the presence of one or more additional diseases or disorders co-occurring with a primary disease or disorder. There was a significant tendency for LOS to be longer in patients with lung or respiratory disorders and high blood pressure. Gender was significant in predicting LOS, since men had longer LOS than women. Age played a notable role as well since analysis revealed that patients aged less than 50 and greater than or equal 80 statistically had increased mean LOS.
Rowan et al. implemented a software package demonstrating that artificial neural networks (ANNs) could be used as an effective LOS stratification instrument in postoperative cardiac patients. 73 In the work by Azari et al., 11 an approach for predicting hospital length of stay using a multi-tiered data mining approach is proposed. They form training sets, using groups of similar claims identified by k-means clustering and perform classification using 10 different classifiers. They consistently found that using clustering as a precursor to form the training set gives better prediction results as compared to non-clustering based training sets. Binning the LOS to three groups of short, medium and long stays, their method identifies patients who need aggressive or moderate early interventions to prevent prolonged stays.
Liu et al. 63 applied two classifiers: DT C4.5 & its successor R-C4.5s, naive Bayesian classifier (NBC) and its successor NBCs to a geriatric hospital dataset, called Clinics Dataset, containing 4722 patient records including patient demographic details, admission reasons, discharge details, outcome and LOS, to predict inpatient LOS for long stay patients. According to Lim et al., 74 C4.5 is one of the classifiers, which has the best combinations in terms of error rate and speed. Also, R-C4.5s combines branches with little classification contribution and thus resulted in building more robust and smaller trees. 75 In addition, NBC is robust and insensitive to missing data as stated in the work of Liu et al. 63
In addition, phase-type survival trees and mixed distribution survival trees are used to cluster stroke-related patients into clinically meaningful groups with respect to LOS where partitioning is based on covariates, such as gender, age at time of admission, primary diagnosis code, treatment outcome and discharge destination.5,46 Moreover, Kudyba et al. in 2010 utilise the method of neural networks to analyze data describing inpatient cases to examine the effect of the independent variables of patient demographics, primary payer, admission and discharge dates, physician specialty, and detailed radiology procedural variables (including the sum of radiology hours) on the dependent variable of length of stay excess per patient case for a major New Jersey based healthcare provider. 76 Also, ANNs, DTs and ensemble methods are used in developing an intelligent decision support system, INTCare, for intensive medicine in the ICU of the hospital Santo Antonio (HAS) in Porto, Portugal. 35 In addition, the bootstrap-based method bumping is used by Grubinger et al. to build diverse and more accurate regression tree models for DRG systems in Austria. 10 Eight datasets are used consisting of patient’s main diagnosis, secondary diagnoses, procedures, number of diagnoses, number of procedures, gender and age as well as patients’ LOS.
Markov model and phase-type distributions
Markov and semi-Markov chain models are models that assume sub-groups of patients are homogeneous and events occur at equally spaced intervals of time; queueing models and deterministic models of the transition of patients between states. These techniques are useful for examining patient flow in large population groups where Markov assumptions can be made. 25 Phase-type distributions describe the time to absorption of a finite Markov chain in continuous time when there is a single absorbing state and the stochastic process starts in a transient state. 43
The first probabilistic approach describes a special type of Markov model known as the Coxian phase-type distribution and its further development into the conditional phase-type distribution. The Coxian phase-type distribution, allows the representation of the continuous duration of stay of patients in hospital as a series of sequential phases, which the patients progress through until they leave the hospital completely. 77
It is possible to expand the theory of Coxian phase-type distributions to include a network of additional interrelated variables (such as patient characteristics) that may interact to influence patient LOS conditional phase-type distribution. This approach allows the incorporation of discrete and continuous variables representing causality. Marshall et al. uses conditional phase-type distribution to model the LOS of elderly patients in hospital.7,78–80 The approach illustrates data on hospital processes for a number of geriatric patients along with personal details, admissions reasons, dependency levels and destination (the causal network). The final model represents patient LOS in terms of five of the most significant patient variables in the dataset, namely patient age, gender, admission method into hospital, Barthel grade (dependency score) and destination on departure from hospital.
Compartmental modelling
The second general approach described is the compartmental model. Compartmental modelling of patient flow is a type of mathematical model used for describing the way patients are transmitted among the compartments of a healthcare system. Each compartment is assumed to be a homogeneous entity within which the entities being modelled are equivalent. For instance, in a pharmaceutical model, the compartments may represent different sections of a body within which the concentration of a drug is assumed to be uniformly equal. Another example, in a healthcare facility, the compartments may represent the different stages that patient goes through- acute, long-stay and death.
Haigeng Xie et al. present a model-based approach to extract from an administrative social care dataset, high-level length of stay patterns of residents in long-term care (LTC). 81 A continuous-time Markov model, a residents stay in both residence care (RC) and nursing care (NC) is modelled as consisting of a short-stay and a long-stay phase, was used to show the flow of residents within and between RC and NC, as well as discharge from RC and NC. The model has been extended to incorporate residents’ features, such as gender. The final model showed that gender has a significant influence on transition rates.
Irvine et al. describes the development of a two-stage continuous-time Markov model that describes the movement of patients through geriatric hospitals. 82 Patients are initially admitted to the acute state from which they transfer to the long-stay state or leave the hospital completely through discharge or death state. McClean et al. extends the stochastic Markov model presented in the work by Irvine et al. to a three-stage one and attaches different costs to each stage thus taking cost into account.82,83 Taylor et al. use a continuous time Markov model and apply it to the case of a four compartmental model, where the four stages are acute, long-stay, community and dead. 84 The model estimates the expected number of patients at any time t in each stage. Taylor et al. extend these models to contain six stages. 85 Garg et al. proposed a novel distribution, multi-absorbing state phase-type distribution, as a generalisation of the single absorbing state Coxian phase-type distribution for representing a Markov process having more than one absorbing state. 5 The approach effectively forecasts the bed requirements in a care unit considering the effect of several factors, such as patient demography – age and gender, as well as treatment outcome based on diagnosis and patient’s expected destination after discharge, which may also affect a patient’s LOS in hospital.
Simulation modelling
Simulation-based models simulate scenarios which replicate real life in an attempt to understand the complex health processes and their interactions. 5 Vasilakis et al. illustrate how the average LOS can be a misleading measure. 44 The research proposes alternative statistical techniques, such as survival analysis, the application of mixed exponential and phase-type distributions demonstrated in two dynamic models of patient flow – compartmental model (small, medium and long stay) and discrete event simulation model, introducing capacity constraints in the various stages of the model, such as bed blockage and refuse-admission rates.
Griffin et al. developed a simulation model using a path-based approach for an obstetric unit to study tradeoffs in blocking and system efficiency. 60 The model focuses on patient flow, considering patient classification, blocking effects, time dependent arrival and departure patterns and statistically supported distributions for LOS. Moreover, the study conducted by Wang et al. in the emergency department at a community hospital, Entral Baptist Hospital in Lexington, KY, uses a discrete-event simulation model to evaluate patient outcome, identify the impact of critical resources and procedures, conduct “What if” analysis for various staffing and operational scenarios and provide recommendations for hospital management. 86
Discrete event simulation models allow patients to have individual attributes and to interact with resource provision but they are more time consuming to test and run. They are particularly suitable for models of systems of patient care where the constraints on resource availability are important. They may also be used on unconstrained population models with several thousands of patients. A significant development in simulation is the facility to model entities so that they can participate in more than one activity simultaneously and interrupt each other. The credibility of any model is dependent on reliable data which are not always readily available in the British health service. 25
Applications in mortality prediction
The primary concern of any healthcare system is to relieve the patient symptoms, prevent complications and prolong the patient’s life. In order to achieve these goals, it is crucial in the ICU to provide the correct treatment and to predict clinical deterioration early enough so preventive or curative actions can be taken in time. Extensive bedside monitoring in hospital ICUs has resulted in complex data-intensive environment regarding patient physiology, which presents a rich context for clinical data analysis. The majority of mortality prediction research has focused on severity of illness scoring systems designed for risk estimation at 24 h after ICU admission or data-mining algorithms that help predict mortality. The following two subsections will illustrate the use of different scoring systems and data-mining algorithms in predicting mortality in critical care.
Scoring systems in critical care mortality prediction
A number of researchers have explored using daily severity of illness scores. In 1993, Le Gall et al. suggested that despite being too time-consuming for most ICUs, daily scores would be the most efficient way to evaluate the progression of the risk of death. 87 Rue et al. found that the mortality prediction on the current-day was the most informative – in fact, the mortality probability at admission and on previous days did not improve performance from the current days score. 88 The importance of the current-day mortality prediction that Rue et al. observed confirms Lemeshow et al.’s finding that the most important features change between the admission MPM model and the 24, 48 and 72 h MPM models. The logistic regression equation also changes between 24 h intervals to reflect an increasing probability of mortality. 89 From their observations, Lemeshow et al. make the general observation that a patient in the ICU with a “steady” clinical profile is actually getting worse. In addition, others have confirmed the usefulness of daily severity scores; Wagner et al. showed strong results looking at daily risk predictions based on the APACHE III score and several additional variables such as the primary reason for ICU admission and treatment before ICU admission. Wagner et al.’s study relied on over 17,440 patients from 40 US hospitals. 90
Data mining in critical care mortality prediction
Until today, a standard statistical method such as logistic regression used by the scoring systems has been well received by critical care professionals to predict the risk of mortality or adverse events for patients with critical illnesses or injuries admitted to an ICU. Despite warnings from many of the original researchers and several studies, 91 many caregivers have come to expect the availability of a severity score to assist them in treating individual patients. However, these predictions are not accurate enough for individual patients and no tools exist to reliably predict an individual patient’s progress on a critical care condition in a timely manner.92,93 As a result, local customised mortality prediction models could perform better as compared to the corresponding current standard severity scoring system. The study conducted by Celi et al. 94 revealed better results for all three subsets of patients: Patients with acute kidney injury (AUC = 0.875 for ANN, vs. SAPS, AUC = 0.642), patients with subarachnoid hemorrhage (AUC = 0.958 for BN, vs. SAPS, AUC = 0.84) and elderly patients undergoing open heart surgery (AUC = 0.94 for ANN, vs. EuroSCORE, AUC = 0.648). Moreover, studies performed in some research concluded that more flexible nonparametric approaches based on data mining techniques, such as ANN, SVMs and DTs, might perform at least as well, if not better, than standard logistic regression in ICU mortality prediction.92,93,95–104 Also the use of untransformed explanatory variables resulted in better results than those transformed using scores/weights. 93
In 1996, Dybowski et al., 95 reported a significantly improved area under the receiver-operating characteristic curve (AUROC) using artificial neural networks as compared to standard logistic regression. Also research in the work by Nimgaonkar and Sudarshan reported better performance of ANN over APACHE III. 105 However, other research found that logistic regression and neural networks performed similarly for ICU mortality prediction.96,106,107 Such conflicting results on the performance of different prediction tools reveal that no single algorithm invariably outperforms all others; it depends on the underlying population being tested, the set of explanatory variables available and the outcome of interest. Contradicting results were reported for other techniques as well. For instance, in 2011 Ribas et al. showed that the use of SVMs resulted in increased prediction accuracy as compared to the APACHE II score. 97 Likewise, the study conducted by Kim et al. 92 compared the predictive accuracy of ANN, SVM and DT derived from the University of Kentucky Hospital’s ICU patients’ data with the APACHE III scoring system. Results showed that the best performing model is the Clementine’s C5.0 algorithm (DT) followed by SVM, APACHE III and ANN.
As mentioned earlier, there is no single algorithm that outperforms others; it depends on the population of interest, the variables measured and the outcome being tested. However, some models reveal strengths over others in certain aspects. For example, the major advantage for the use of DTs over other models lies in its descriptive modelling as it explains hidden clinical implications unlike ANNs which lacks logic between input and output nodes. From another perspective, DT, RF, ANN, Bayesian networks and kernel methods such as SVM can handle large size data samples and integrate background knowledge into analysis. 108
Methods to mortality prediction
This section explores the methods used in predicting patient mortality in critical care. After surveying the previous literature, critical care mortality prediction methods were categorised into two subgroups as shown in Figure 1. A classification of the reviewed papers based on mortality prediction methods is shown in Table 1.
Scoring systems for mortality prediction
Scoring systems can be divided into two categories, those that assess disease severity on admission and use it to predict outcome, for example, acute physiology and chronic health evaluation (APACHE), 109 simplified acute physiology score (SAPS), 87 mortality probability model (MPM), 110 and those scores that assess the presence and severity of organ dysfunction, for example, sequential organ failure assessment (SOFA). 111 The SOFA score is limited to six organs by looking at respiration, coagulation, liver, cardiovascular, central nervous system, and renal measurements. For each organ, the score provides an assessment of derangement between 0 (normal) and 4 (highly deranged).
Several works in the literature have discussed and compared mortality prediction models in intensive care that rely on a panel of experts or statistical models, namely logistic regression.12,87,109,110,112–115 Scoring systems, such as APACHE and SAPS assess disease severity on admission and use it to predict outcome.87,109 The objective of these models is to compare groups of patients and characterise disease severity from patient demographics and physiological variables obtained within the first 24 hours after ICU admission. However, despite their simplicity it is claimed that these models are not reliable enough for prediction of individual patients since they provide a value that can be averaged for a group of patients. 116 To this day, SAPS II and APACHE II remain the most widely used scores in clinical practice despite attempts for their modification,12,87,93,109,115 specifically tailored for other populations, such as France, Southern Europe and Mediterranean countries, and to Central and Western Europe.117–120
In 1985, the original model of the APACHE scoring system (1981) was revised and simplified to create APACHE II, 121 now the worlds most widely used severity of illness score. 12 The score relies on a panel of experts for variable selection and weights. In APACHE II, there are just 12 physiological variables, compared to 34 in the original score. The effects of age and chronic health status are incorporated directly into the model, weighted according to their relative impact, to give a single score with a maximum of 71. The worst value recorded during the first 24 h of a patients admission to the ICU is used for each physiological variable. The score is not recalculated during the stay; it is by definition an admission score. If a patient is discharged from the ICU and readmitted, a new APACHE II score is calculated. However, many researchers have validated the use of severity of illness scores in settings that deviate from their original design. Alternative settings have included populations such as coronary care patients or subarachnoid hemorrhage patients or days subsequent to the initial 24 h after admission.88,122–124 APACHE III was developed in 1991 and in 2002/2003 APACHE IV was developed, which provides length of stay prediction equations.12,117 A more detailed comparison of the current scoring systems is available in the work by Vincent and Singer. 12
Like the APACHE scores, SAPS was calculated from the worst values obtained during the first 24 h of ICU admission. In 1993, Le Gall et al. used logistic regression analysis to develop SAPS II, which includes 17 variables: 12 physiological variables, age, type of admission and three variables related to underlying disease. 87 The SAPS II score was validated using data from consecutive admissions to 137 ICUs in 12 countries 87 . Research by Le Gall et al. introduced an expanded SAPS II by adding six admission variables: Age, gender, length of pre-ICU hospital stay, patient location before ICU, clinical category and whether drug overdose was present. 118 Results show that the expanded SAPS II performed better than the original and a customised SAPS II, with an AUROC (area under the receiver operating characteristic curve) of 0.879. A study conducted by Gilani et al., 115 showed that the prognostic accuracy of APACHE II was excellent for (AUC: 0.828) score and acceptable for APACHE III (AUC: 0.782) and SAPS II (AUC: 0.778) scores. According to the clincial review conducted by Vincent et al., 12 the different types of scores should be seen as complementary, rather than competitive and mutually exclusive.
Data mining techniques for mortality prediction
Various authors have advocated the use of machine learning techniques for predicting ICU mortality over the use of logistic regression methods. Research by Dybowski et al. and Nimgaonkar and Sudarshan have reported better performance of ANNs over logistic regression.95,105 However, other research found that logistic regression and neural networks performed similarly for ICU mortality prediction.96,106,107 Others found that DTs and SVMs performed better.92,97–127 In 2011, Ribas et al. showed that the use of SVMs resulted in increased prediction accuracy as compared to the APACHE II score. 97 Likewise, the study conducted in the work by Kim et al. compared the predictive accuracy of ANN, SVM and DT derived from the University of Kentucky Hospital’s ICU patients’ data with the APACHE III scoring system. 92 Results showed that the best performing model is the Clementine’s C5.0 algorithm (DT) followed by SVM, APACHE III and ANN. These results confirm earlier findings in work by Delen et al., 126 which also reported that C5.0 was the best predictor with the highest accuracy of 93.6% in predicting breast cancer survivability. In addition, Crawford et al. concluded that a decision tree used in their study provided a clinically acceptable mining result in predicting susceptibility of prostate carcinoma patients at low risk for lymph node spread. 127 On the other hand, Ramon et al. reported that the AUCs of DT based algorithms (DT learning, 65%; first order RFs, 81%) yielded smaller areas compared to those of naive Bayesian networks (AUC, 85%) and tree-augmented naive Bayesian networks (AUC, 82%) in their study on a small dataset containing 1548 mechanically ventilated ICU patients. 102 Similarly Pirracchio et al. reported that Bayesian additive regression trees (BARTs) is the best candidate when using transformed variables, while RFs outperformed all other candidates when using untransformed variables. 93 Other authors achieved improved mortality prediction using a method based on SVMs. 125
Such conflicting results on the performance of different prediction tools reveal that no single algorithm invariably outperforms all others; it depends on the population of interest, the variables measured and the outcome being tested. However, some models reveal strengths over others in certain aspects. For example, the major advantage for the use of DTs over other models lies in its descriptive modelling as it explains hidden clinical implications unlike ANNs which lacks logic between input and output nodes. From another perspective, DT, RF, ANN, Bayesian networks and kernel methods such as SVM can handle large size data samples and integrate background knowledge into analysis. 108
Applications in concurrent prediction of LOS and mortality
There are several works in the literature that handle both LOS and mortality prediction concurrently. The prediction models include arithmetic models, such as the mean and median; statistical models, such as regression analysis and data-driven models, such as Bayesian Network. The following are some examples of applications that attempt to concurrently predict patient LOS and mortality.
The work by Peterson et al. aims to assess the impact of the introduction of an early warning scoring system (SEWS) on physiological observations and patient outcomes in acute admissions at the point of entry to care. 128 The admission of the early warning score correlated both with in-hospital mortality (P < 0.001) and length of stay (P = 0.001). Moreover, Clark et al. developed a method for predicting concurrently both hospital survival and LOS for seriously ill patients from three trauma centres in Maine, with particular attention to the competing risks of death or discharge alive as determinants of LOS. 129 Poisson regression was used to develop a model for each type of terminal event, with risk factors on admission contributing proportionately to the subsequent rates for each outcome in each interval. Mean LOS and cumulative survival were calculated from a combination of the resulting piecewise exponential models. 129 Similarly, risk stratification indices (RSIs) for length of stay and mortality endpoints were derived from aggregate risk associated with individual diagnostic and procedure codes. Results showed that the RSI is a broadly applicable and robust system for assessing hospital LOS and mortality for groups of surgical patients based solely on administrative data. 130
Cai et al. built a Bayesian network model to estimate the probability of a hospitalised patient being “at home” in the hospital, or dead for each of the next seven days. 131 Electronic health records from 32,634 patients admitted to a Sydney metropolitan hospital via the emergency department from July 2008 through December 2011 were used. The model achieved an average daily accuracy of 80% and AUROC of 0.82. The models predictive ability was highest within 24 h from prediction (AUROC = 0.83) and decreased slightly with time. Death was the most predictable outcome with a daily average accuracy of 93% and AUROC of 0.84. 131
Measuring the performance of mortality and LOS prediction models
Mortality prediction is considered a binary classification problem where a classifier attempts to identify whether a patient will live or die. Evaluating classifier performance shows how well a method improves classification. Traditionally classification accuracy is used to measure classifier performance. The classification accuracy gives a good idea of classifier performance when the dataset is balanced, however when the dataset suffers from âclass imbalance (i.e the number of instances belonging to one class outnumbers that of any other class(es)) some problems emerge. For example, in a binary classification problem, if the majority class outnumbers the minority class 9:1, and all instances were classified as the majority class, the classifier would have an accuracy of 90%, despite 0% of the minority class being classified correctly. In a binary dataset, the classification accuracy shows the number of correctly classified minority instances (true positives), incorrectly classified minority instances (false positives), correctly classified majority instances (true negatives) and incorrectly classified majority instances (false negatives) as follows


There are several quantitative methods for measuring the performance of the different LOS prediction models. Measuring the performance of the statistical methods for LOS prediction include several approaches, such as the mean, median, standard deviation, kurtosis, min-max, confidence and AUROC are the most commonly used in literature.26,29,30,34,40,44,134 As for the data-driven and data mining methods for LOS prediction, there are several evaluation approaches in literature, such as sensitivity, specificity, F-measure or the harmonic mean of precision and recall.5,10,27,35,46,61,63,72,76 On the other hand, sensitivity analysis, simulation models, generalised Erlang, hyper-exponential and Coxian models are the most widely used in measuring the performance of multi-stage models for LOS prediction.49,60,86
Conclusion
This paper has presented a comprehensive review of the methods and applications of LOS and mortality prediction in acute medicine and critical care.
An introduction to LOS theory and mortality prediction and the main drivers behind the interest in such research was given in the opening section. In addition, several applications for LOS and mortality prediction were demonstrated both in acute medicine and in the intensive care unit environment in particular, highlighting the challenges facing both physicians and information engineers today. However, only a small sample of such applications considered the prediction of both LOS and mortality concurrently. We see this as a limitation in our paper that could be enhanced in future work. An analysis of the various LOS and mortality prediction methods were presented and compared. Moreover, the paper provides a classification for some state-of-the-art literature based on each paper’s analytical method utilised to predict LOS and mortality. The four main categories include:
arithmetic methods; statistical methods; data-driven methods; multi-stage methods.
The classification presents a brief summary of the analytical method, dataset and the evaluation method utilised. Given that LOS and mortality are relatively complex matrices as they are influenced by various external uncontrollable factors, there is no one good-for-all technique that serves its prediction. At present, in most cases several algorithms are tested, tweaked based on some domain knowledge or some performance criteria to enhance the accuracy of prediction. This is considered another limitation as there is no one reliable technique for prediction; it all depends on the situation at hand. However, it is clear that much research remains to be done, especially that the physiological and laboratory datasets in both acute medicine and the critical care environment are relatively large and well-structured in commercial and non-commercial databases.
Footnotes
Declaration of conflicting interests
The author(s) declared no potential conflicts of interest with respect to the research, authorship, and/or publication of this article.
Funding
The author(s) received no financial support for the research, authorship, and/or publication of this article.