Abstract
The aim of this study is to conduct an intervention that tests whether a new scheduling policy designed to reduce waiting times actually will lead to a reduction in waiting times. The new scheduling policy was developed using mixed methods. Qualitative data was gathered to fully understand current planning processes, while quantitative methods were used to model and predict future waiting times. If current planning practices are continued, waiting times will only increase. Additionally, the findings show that simulation modeling can be used to predict the capacity needed for intakes (first appointment) to reduce and maintain target waiting times over time. In our study, this meant a slight increase in capacity for intakes. This new scheduling policy led to a reduction in waiting times from 65 days in 2016, to under 40 days post-intervention in 2017. Waiting times have been held under 40 days since implementation of the new policy, 2017–2020. Our study shows that setting appropriate (weekly) intake goals, will lead to maintaining acceptable levels of variation in waiting times. This theory was tested and proven to be effective.
Keywords
Introduction
The public sector is often faced with a difficult challenge, obtaining enough resources (either health personnel, space or equipment) to meet the public’s growing demands or expectations. 1 Referrals are pouring in, while organizational resources remain largely unchanged. This often results in a growing waiting list. Having a waiting list is not necessarily a bad thing. A waiting list allows an organization to better plan the utilization of its resources. 2 However, long waiting times can lead to an increase in treatment costs, length of stay and quality of care. 2 This challenge can make providing timely health care services in the public sector difficult, especially when successful treatment is dependent on timeliness. This is the case for outpatient clinics in Children and Adolescents’ Mental Health Services (CAMHS).3,4
Waiting times from referral to intake with a statistical significance of p < .001.

Providing timely access to mental health services has become an important issue for the government of Norway. 7 While the Norwegian Directorate of Health has published prioritization guidelines 8 that states maximum waiting times for assessment and treatment of different diseases, both national policy 9 and local hospital strategies10,11 set a higher standard for timeliness for children receiving mental health services. These strategies push for a need to reduce waiting times from referral to intake (first appointment). Additionally, local hospitals have been encouraged by the government to think new or differently about the way they organize and deliver their services. 9 The national guidelines provide a minimum standard that all CAMHS centers nationally are required to comply with. However, there are several reasons why CAMHS centers should be motivated to provide care above the minimum standard: (1) when successful treatment for children is dependent on timely access, (2) given local challenges (e.g. growing numbers of referrals in highly populated cities leading to longer waiting times and larger queues), and (3) undesired work environment for the specialists are all factors that are motivating St. Olavs hospital to set their waiting time target under 40 days, on average, for CAMHS. It is important to note that actual deadlines vary based on the severity of each patient’s mental condition. However, on average, a patient should receive their intake within the new standard, under 40 days.
In an attempt to think new differently about health care services, St. Olavs hospital established a collaboration with the Department of Industrial Economics and Technology Management (IETM), at the Norwegian University of Science and Technology. IETM has expertise in a wide range of managerial research areas such as operations research, operations management, change management, innovation, and entrepreneurship.
Given the attempt to think new or differently, St. Olavs hospital and IETM have chosen to conduct an interdisciplinary study, combining clinical knowledge with operations research, to explore strategies for reducing waiting times from referral to intake for outpatients in CAMHS. Operations research is a field that deals with managerial problems in organizations, and provides tools based on mathematical modelling and computational methods to analyze and offer solutions to these problems. 12 One of the most important tools of operations research is computer simulation. 13
There are prior studies that explore strategies or theories that may reduce waiting times, such as centralizing the point of intake, same-day appointments, benchmarking, system-level factors, and monitoring of patients on the waiting lists.3,14–16 However, “to what extent these or other strategies actually reduce waiting times is largely unknown”. 3
(1) a weekly schedule with reserved time for intake of new patients; (2) an operational patient booking rule specifying how to use the reserved time for intake; and (3) a computer simulation tool.
In the following, (1) and (2) are referred to as the new scheduling policy. The computer simulation tool is used to specify the amount of time reserved for intakes in the new scheduling policy, as well as illustrating the effect it will have on the waiting times. The intervention proved to reduce waiting times below 40 days (see Table 1). Following the table, we will describe in detail the elements of the intervention new policy and how the results were achieved.
Theoretical background
Timely access
Public mental health institutions have been struggling to meet their demands. 1 Referrals rates are growing faster than the resources they are given, resulting in lengthy delays for patients in need of health services.1,17 This is especially problematic for children and adolescents receiving mental health services, where timeliness is a critical factor to successfully treating the mental health issue(s).3,4 Waiting times for children receiving these services can have detrimental effects. Prior research has shown that long waiting times for children receiving mental health services can exacerbate emotional distress, occupational/social dysfunction, victimization, and danger to self/others both at home, at school, and amongst their community.3,18 Additionally, long wait times can increase the risk of decompensation and suicide. 17
Operations research and computer simulation applied to health services
Operations research is a scientific area that deals with managerial problems in organizations. By managerial problems, we mean decision problems about how to conduct and coordinate the activities within an organization. 12 The field relies on representing the problems by mathematical models that are analyzed using computational methods. The aim of the analysis is to give decision support and provide solutions that can be implemented in the organization. Operations research has been applied in different sectors ranging from manufacturing and transportation to health care. 12
A key tool to analyze decision problems is computer simulation. In computer simulation, one creates, in software, a simulation model that imitates the operation of a process or system over time. 13 An important application of computer simulation is the study and modelling of systems consisting of one or more queues. Here, queues should not necessarily be read literally, but rather as an abstract representation of people (or objects) waiting for service. Thus, the simulation model can be a computerized representation of a real-world hospital process or system, such as the process of admitting new patients in an outpatient clinic, or all the processes in an outpatient clinic. 19 By having a simulation model of the process or system under study, one can analyze and quantify what impact a new policy/intervention has on the process or system. Hence, computer simulation might be used to test the effect of a new policy before implementing changes in the organization. Note that, in “simple” processes and systems, the impact of a new policy can be quantified using simple calculations. The value of using computer simulation arises when the systems are complex, for instance when the system is changing over time, and uncertain parameters play a prominent role in the system. In healthcare systems like hospitals uncertain parameters might be durations of appointments or surgeries and the number of patient arrivals per time unit.
The amount of research done on health care by using operations research and computer simulation has been rapidly increasing. 20 However, it is argued that health care planning and control lags behind planning and control in manufacturing. 21 By analyzing existing planning and control concepts and frameworks, they found that the importance of connecting long term strategic decisions (e.g. the staffing level of an outpatient clinic) and short-term operational decisions (e.g. when and to which doctor to schedule patient N.N.) through tactical decisions are often overlooked. Instead, many managers are inclined to firefight operational problems. In the case of outpatient clinics, the management might set strategic goals on the waiting time (e.g. a target on the average waiting time), and based on these goals they decide the staffing level. In the daily operations, when new referrals are received and prioritized by a specialist, secretaries will look for available time in the calendars of the clinicians and book patients for their first appointments. However, even if the clinical staff is originally dimensioned to achieve the goals on the waiting time, there might not be enough available time in the calendars to see new patients at the right time. Hence, the strategic goals are not accomplished. In between the long-term strategic decisions and the short-term operational decisions, one can make tactical decision that facilitate operational decision making. One way of doing this can be to create a monthly or weekly tactical schedule that organizes and prioritizes the clinicians’ time between different tasks, e.g. by reserving the right amount of time for new patients each week.
One of the prominent managerial problems when assessing and treating patients is how to schedule the appointments in the treatment plan of the patient. By scheduling, the study refers to the process of deciding the time of an appointment and allocating the necessary resources for performing the appointment at the decided time. By scheduling policy, the study refers to the rule used to guide this process. In general, there are two means of reducing the waiting times in a queuing system: (1) one can introduce more resources to speed up the service at single queues (remove bottlenecks); (2) one can change the organization of the queuing system to reduce unnecessary waiting. The study will explore both of these issues, however the focus and consequently the simulation in this study will be primarily on (2) how one can change the organization of the queuing system to reduce unnecessary waiting. Put in other words, given the resources one has, how can we use them differently or more effectively to meet our desired effect (waiting time under 40 days).
Proposition 1 (P1): Current scheduling policies (before the intervention) are inadequate for operationalizing reductions in waiting times.
Proposition 2 (P2): Operations research and computer simulation will have a positive effect for the CAMHS provider’s new scheduling policy (the intervention) that has set a target waiting time for under 40 days.
Methodology
Multiple methods were used to strengthen the quality of the data and data analysis in this study.22,23 Multiple methods have grown in popularity for a number of reasons; they combine the strengths of both qualitative and quantitative methods, 23 are necessary to address complex issues,22,24 and provide more insight and an expanded understanding of the research issues.22,24,25 Some researchers have gone as far as to claim that multiple methods should be viewed as the real gold standard for studying phenomena.24,26 For the aforementioned reasons, it was essential to our study to infuse our quantitative data and data analysis with qualitative data.
Study design
St. Olavs hospital CAMHS contacted the Regional Center for Healthcare Improvement (RSHU) to help them reduce their waiting times, from referral to intake. RSHU is an interdisciplinary unit within the hospital that provides: decision-making support, implementation of standard patientcare (pathways), effective use of resources by assisting with activity and staffing analysis, and improving coordination for all hospital activities. RSHU has a wide range of expertise from nurses and doctors to mathematicians and operations research experts.
St. Olavs hospital CAMHSs has three outpatient centers that deliver mental health services to children and adolescents up to 18 years old. It was agreed upon that RSHU would use their interdisciplinary background to gather both qualitative and quantitative data from all three centers. Additionally, RSHU would analyze data for CAMHS, in an attempt to shed new light on different ways they may be able to reduce their waiting list that was continually growing. CAMHS leaders at St. Olavs hospital believed this interdisciplinary approach may help them see their own data from a new perspective, which may allow them to reduce their waiting list. The project was first initiated on 21 June 2017, results and recommendations presented on 13 September 2017, and conclusions and evaluations were conducted in February 2018.
The study was conducted in the fashion of operations research,
12
as illustrated through the four, potentially iterative, phases in Figure 1. In the first phase, the researchers work closely together with the key personnel, in our case managers and clinicians at St. Olavs hospital CAMHS, to understand and define the problem to be studied. To do this, both qualitative and quantitative data is required, in addition to some initial analysis of this data. The data collection is discussed in more detail in the following subsections. Illustration of the phases of the study.
In the second phase, the model that is used to analyze the problem under study is developed. First conceptually, and then through mathematics and logic. The model is then implemented in software, and procedures to analyze and derive solutions from the model is established. In our case the model is a discrete-event simulation model, which is described in more detail below. The next phase includes both testing the model to detect possible errors, but also that the model provides a sufficiently good representation of the problem in order to provide valid results. Moreover, the results of the model are analyzed to provide a solution to the problem under study. This phase is done in collaboration with the key personnel previously mentioned. The involvement of key personnel is important to validate the model, and it’s important that these personnel gain insight into the results when the proposed solution are to be implemented.
Finally, in the implementation phase, the proposed solution is implemented. It is often required that the researchers guide the initial part of the phase, with instructions on how to implement the solution. Otherwise, this phase is usually run by the managers in problem-owning organization. As a final note, the last three phases can all result in a need to go back to either of the previous phases to redo previous choices, e.g. change the problem definition, model formulation, and perform new tests.
Qualitative data
Qualitative data was also gathered in our study, in an attempt to strengthen the quality of the quantitative data.22,24,26 Qualitative data was gathered to better understanding the patient pathway and the data that was being analyzed. Before any simulation techniques were utilized, the researchers observed each contact that health care personnel had with the patient from referral to intake, to ensure that the data being analyzed was fully understood and was being analyzed correctly.22,24 The importance of utilizing both qualitative and quantitative data cannot be overlooked, especially when the recommendation will eventually need to be implemented into health care services. For this study to work, both the researchers and practitioners need to trust the data being analyzed. This means that when we analyze the data with a theoretical lens, the practitioners must agree or believe that the data accurately reflects their practice. Additionally, the quality of data can vary in specialized care given the fact that most data is entered in manually for each patient by each specialist (e.g. data can be entered in wrong, classified differently by different specialists, registered twice, or we may think one variable is intake, while specialists call intake by a different name in practice). To better understanding the data we would be analyzing, our research team observed the following meetings: 1. Orientation meeting with all CAMHS managers. 2. Prioritizing referrals meeting. 3. Interview. 4. Observed an intake meeting between health personnel and a patient. 5. Met with the secretaries to learn more about scheduling and organizing of appointments. 6. Observed each specialty team meeting. 7. Meeting with receptionist who plans and organizes follow-up meetings. 8. Conclusion, presenting findings and recommendations from our analysis.
Qualitative research interviews and observations were used in gathering data for this research question. 27 The interviews and observations were held at the interviewees’ place of employment and we used a semi-structured interview guide for the interviews. 27 We were interested in what are current planning practices for CAMHS from referral to intake (first consultation with the patient). Each interview generally ran 1 h in length. There were at least two researchers at each qualitative meeting to assure that each researcher could discuss, analyze and interpret the data relating to the patient pathway with another researcher. This assured that the data being analyzed and simulated was the correctly registered data from the clinicians’ perspective. It is recommended to have several researchers review the qualitative data that has been gathered in relation to research interpretations for quality assurance.28–30 Obtaining other perspectives of the same qualitative data helps validate that the interpretations were accurate.29,30 Each interview begun with an introduction of the participants in the interview, an introduction of the purpose for the interview/observation, a general overview of the main theme to be discussed, and confirmation that they understood that their response would be anonymous. Each interview was conducted with two goals in mind; what are current planning practices for the CAMHS unit, and how can these processes be improved. The interviews were not recorded due to the sensitive nature of data collected. Hospital employees have a nondisclosure agreement in our employment regarding disclosing sensitive health information. As the interviews were not recorded, they were not transcribed.
Quantitative data
Quantitative data was necessary for our data analysis. In addition to a qualitative understanding of how the CAMHSs operate, a precondition to imploring simulation techniques is to obtain numbers on the patient demand and the activity levels. Our study gathered anonymous data of the patient referrals between 2012 and 2016, and the contacts between health personnel and the patients from the CAMHS database from 2013 to 2017. By analyzing, the following graphs could be plotted: (a) how many referrals the CAMHS center received, (b) waiting times associated with each referral and (c) how many intake consultations were conducted. This illustrated each centers demand and capacity. After this data was obtained, simulation models for each of the three centers were constructed.
Current planning practice
Before we explore the new scheduling policy, it is necessary to understand the current planning practices. Figure 2 illustrates the patient pathway from prioritization to diagnostic assessment for CAMHS patients at St. Olavs hospital. First, a patient must visit their family-care physician (GP), the GP will then determine if a referral to a specialist should be requested. If a GP determines that a patient should be examined by a specialist, a referral is received by the hospital from a primary care provider. The hospital must decide if the patient has a right to care and how quickly they should receive these services (see ‘Prioritization’ in Figure 2). If a patient does not meet the criteria for specialist care, the patient/GP will receive a rejection notice or discharge. If the patient had a right to care, they would be notified about the time of their intake (first consultation). After the intake, the clinicians discuss the patient case at the interdisciplinary team meeting, where a diagnostic plan is outlined consisting of a number of consultations and tests. Eventually, the diagnostic evaluation is concluded at the diagnostic assessment meeting. After a patient receives an assessment, a treatment plan or phase will follow. Treatment will continue until the patient is discharged. If a treatment is unsuccessful, clinicians may reevaluate the diagnostic plan, which will start the process over again for the patient (see ‘Diagnostic plan’ in Figure 2). This study focuses on the process from prioritization to intake (see Figure 2). Illustration of the patient pathway from prioritization to diagnostic assessment for CAMHS patients at St. Olavs hospital.
Based on our observations and discussions with key personnel at CAMHS, we found that they organized the intake at a fixed time (Wednesday 9.00 a.m.) every week, which was implemented by reserving this time for intake in the calendars of the clinicians several months in advance. The content and duration of the intake consultation was standardized. The current scheduling policy (before the intervention) for the intake was designed to schedule intakes towards the deadline imposed by the maximum waiting time set in the prioritization guidelines of the Norwegian Directorate of Health. The prioritization guidelines specify the minimum standard, in our case the maximum waiting time, all CAMHS centers in Norway are required to comply with. Some patients wait 1 week, while others wait up to 12 weeks. In general, the maximum waiting time was larger than 40 days
8
(see Table 1). Hence, when scheduling the intake of a new patient, the scheduling policy consists of the following steps: (1) Find the maximum waiting time and the imposed deadline by using the prioritization guidelines. (2) Check the calendars of the clinicians with the required competence to assess the patient and find a free clinician at the reserved intake time (Wednesday 9.00 a.m.) as close to the deadline as possible, without exceeding the maximum waiting time. (3) If a free clinician is found, schedule the patient to this clinician at the free intake time. Otherwise, schedule the intake outside of reserved intake time as close to the deadline as possible, without exceeding the maximum waiting time.
The scheduling of the remaining consultations and test of the diagnostic plan was performed by the responsible clinician, and typically performed by scheduling the next consult at the end of each consultation. However, given St. Olavs hospital’s new waiting time standard of 40 days, current planning practices aren’t adequate, leading to waiting times of 65 days. When scheduling towards the deadlines, the only way waiting times can be reduced is by changing the national maximum waiting times. However, suggesting changes to the latter were outside the scope of this study. Therefore, St. Olavs hospital has determined that new planning policies must be developed and implemented.
New scheduling policy
By using techniques from operations research, a new scheduling policy emerged for scheduling intake consultations. The core idea behind the new policy, is that it tries to schedule intakes as early as possible, instead of towards the deadline. Similar to the current planning practice, time slots for intake are reserved in the calendars of the clinicians, but to ensure waiting times are within the target of 40 days, an appropriate number of intake slots must be reserved every week. This number is predicted based on historical data on the number of patient referrals. Thereafter, one schedules the predicted number of weekly intake slots in the calendars of the clinicians, before knowing which patients to schedule. When new patient referrals are to be scheduled for intake, the patients are scheduled to the first available slot of the desired clinician. Note that, in the current planning practice it was not decided upfront the number of intakes to perform each week; instead, this was first known a few weeks in advance when the referrals with given deadlines were revealed and scheduled for intake. In the new scheduling policy this decision is important, and if made wrong, then the waiting times could rise.
Together with the key personnel it was suggested that the weekly number of intake slots should be quite stable over time but be reduced in the middle of the summer and in select other holiday periods. Thus, the new scheduling policy was not only designed to reduce waiting time, but also promote a more balanced workload for the clinic and clinicians over time. To take into account periods of lower activity in the prediction on the number of intake slots, a simulation model to capture the dynamic effects was developed. The simulation model, which is described next, was utilized to estimate how the waiting times would develop over time when implementing a future schedule for intake slots.
Finally, the scheduling of the intake slots to the clinicians can be done according to the manager’s preference, under the condition that the total number of intakes among all clinicians each week is in accordance with the overall schedule. If a clinician should have less patient load (e.g. new employees having lower activity levels, or employees with more administrative duties) this can be adjusted for by scheduling relatively more intake slots to other clinicians.
Simulation model
The operationalization of the new scheduling policy is analyzed in a computer simulation of the clinic, with the aim to evaluate and illustrate, for clinicians and managers, the effect the new scheduling policy would have on the development of waiting times, measured in days. The computer simulation is limited to the intake process, that is, from the reception of the referral, through the process of scheduling the patient, until a clinician has conducted the intake consult. Hence, the model does not encompass the full diagnostic evaluation of the patient.
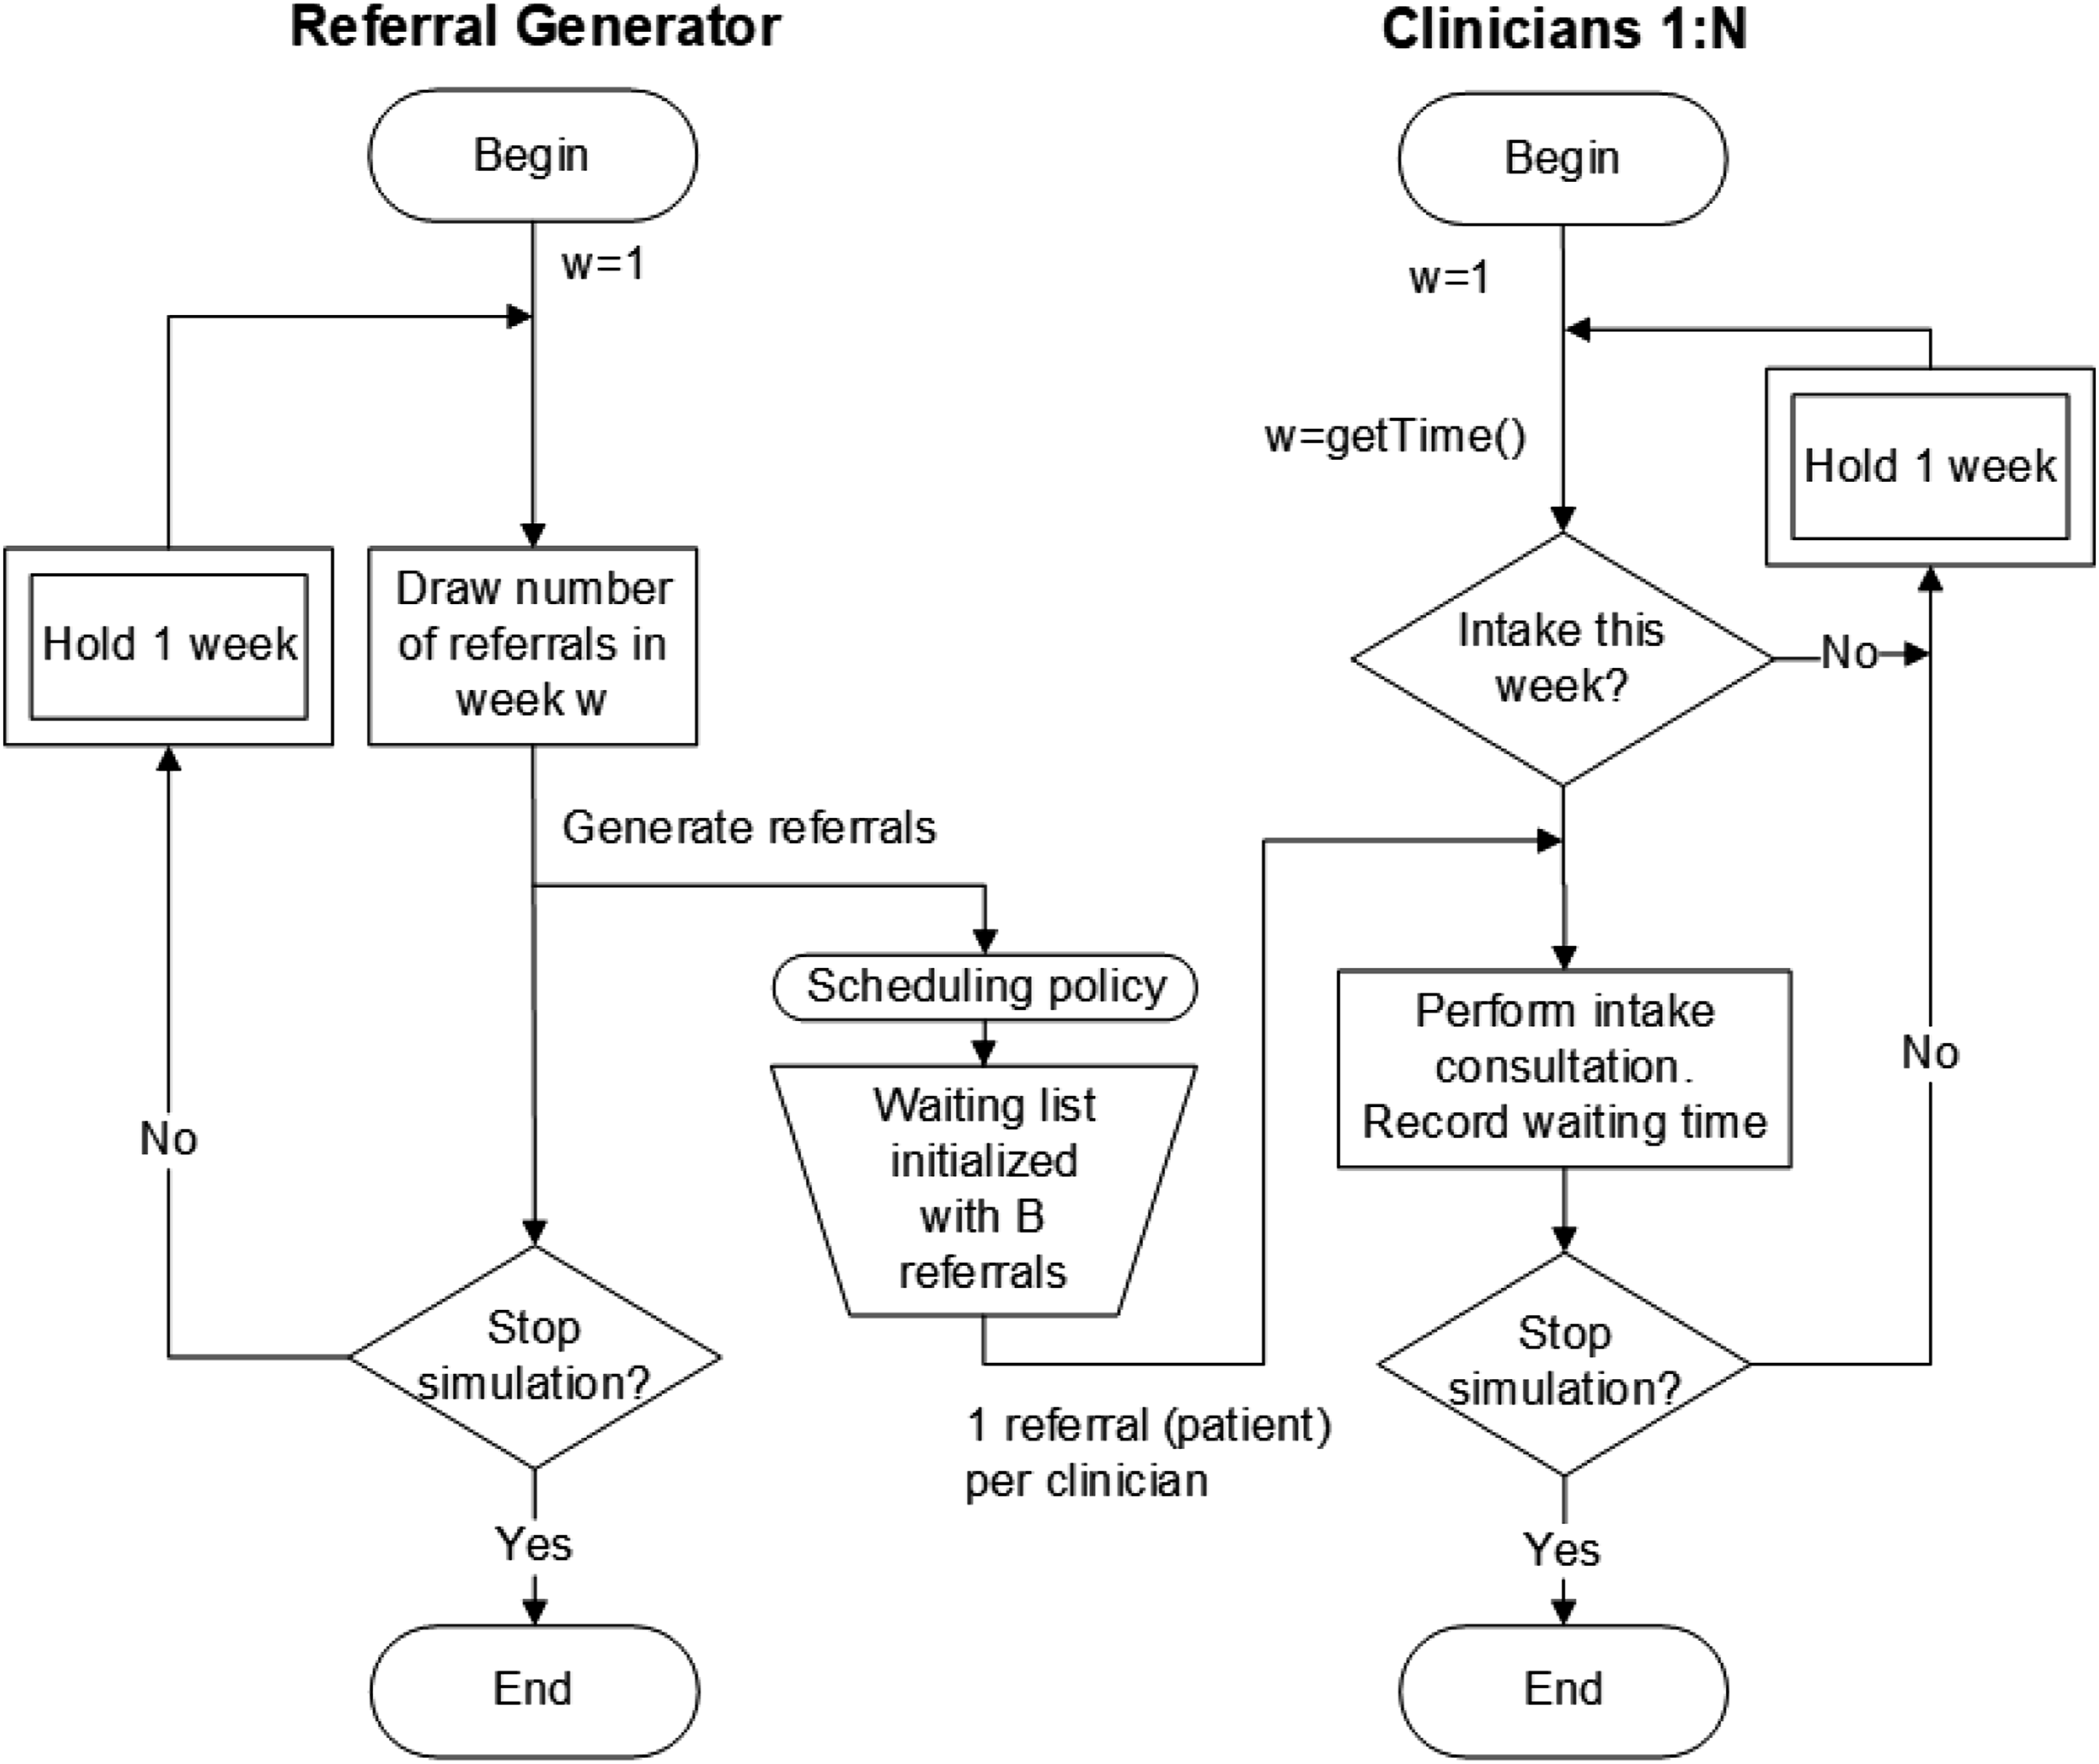
The clinic is modelled as a queuing system, illustrated in Figure 3, where referrals arrive and are put on a waiting list using a scheduling policy. The waiting list can be considered a calendar where referrals, corresponding to individual patients, are ordered according to some criteria. At regular time intervals the clinicians see patients in intake consultations, and the referral are then removed from the waiting list. We let the number of referrals arriving each week follow a Poisson distribution with a mean rate that vary in different weeks. This is done to mimic the seasonal patterns found in reality. The mean arrival rates are set based on historical arrival dates of referrals between 2012 and 2016. Moreover, there is a number N of clinicians that potentially can perform intakes, where we allow each clinician to do at most one intake each week at fixed weekly time. Note that, the clinicians are modelled as anonymous and interchangeable so that having N/2 clinicians performing two intakes every week would give the same results. The availability of clinicians is reduced during the summer vacation period and other holiday periods throughout the year. Furthermore, we include some unforeseen events: patients not showing up for their intake, and unplanned unavailability of clinicians, which have consequences on the actual number of intakes each week. However, since the duration of the intake consultation was standardized, the service times are modelled as fixed. When running the simulation experiments, we start out with a number of patients already on the waiting list. Technical details along with an activity diagram of the simulation model can be found in Figure A1. The assumptions and logic of the model was discussed with key personnel from CAMHS to validate that it represented the intake process sufficiently, and so that the waiting times resulting from the model could be trusted. Overview of the elements in the simulation model.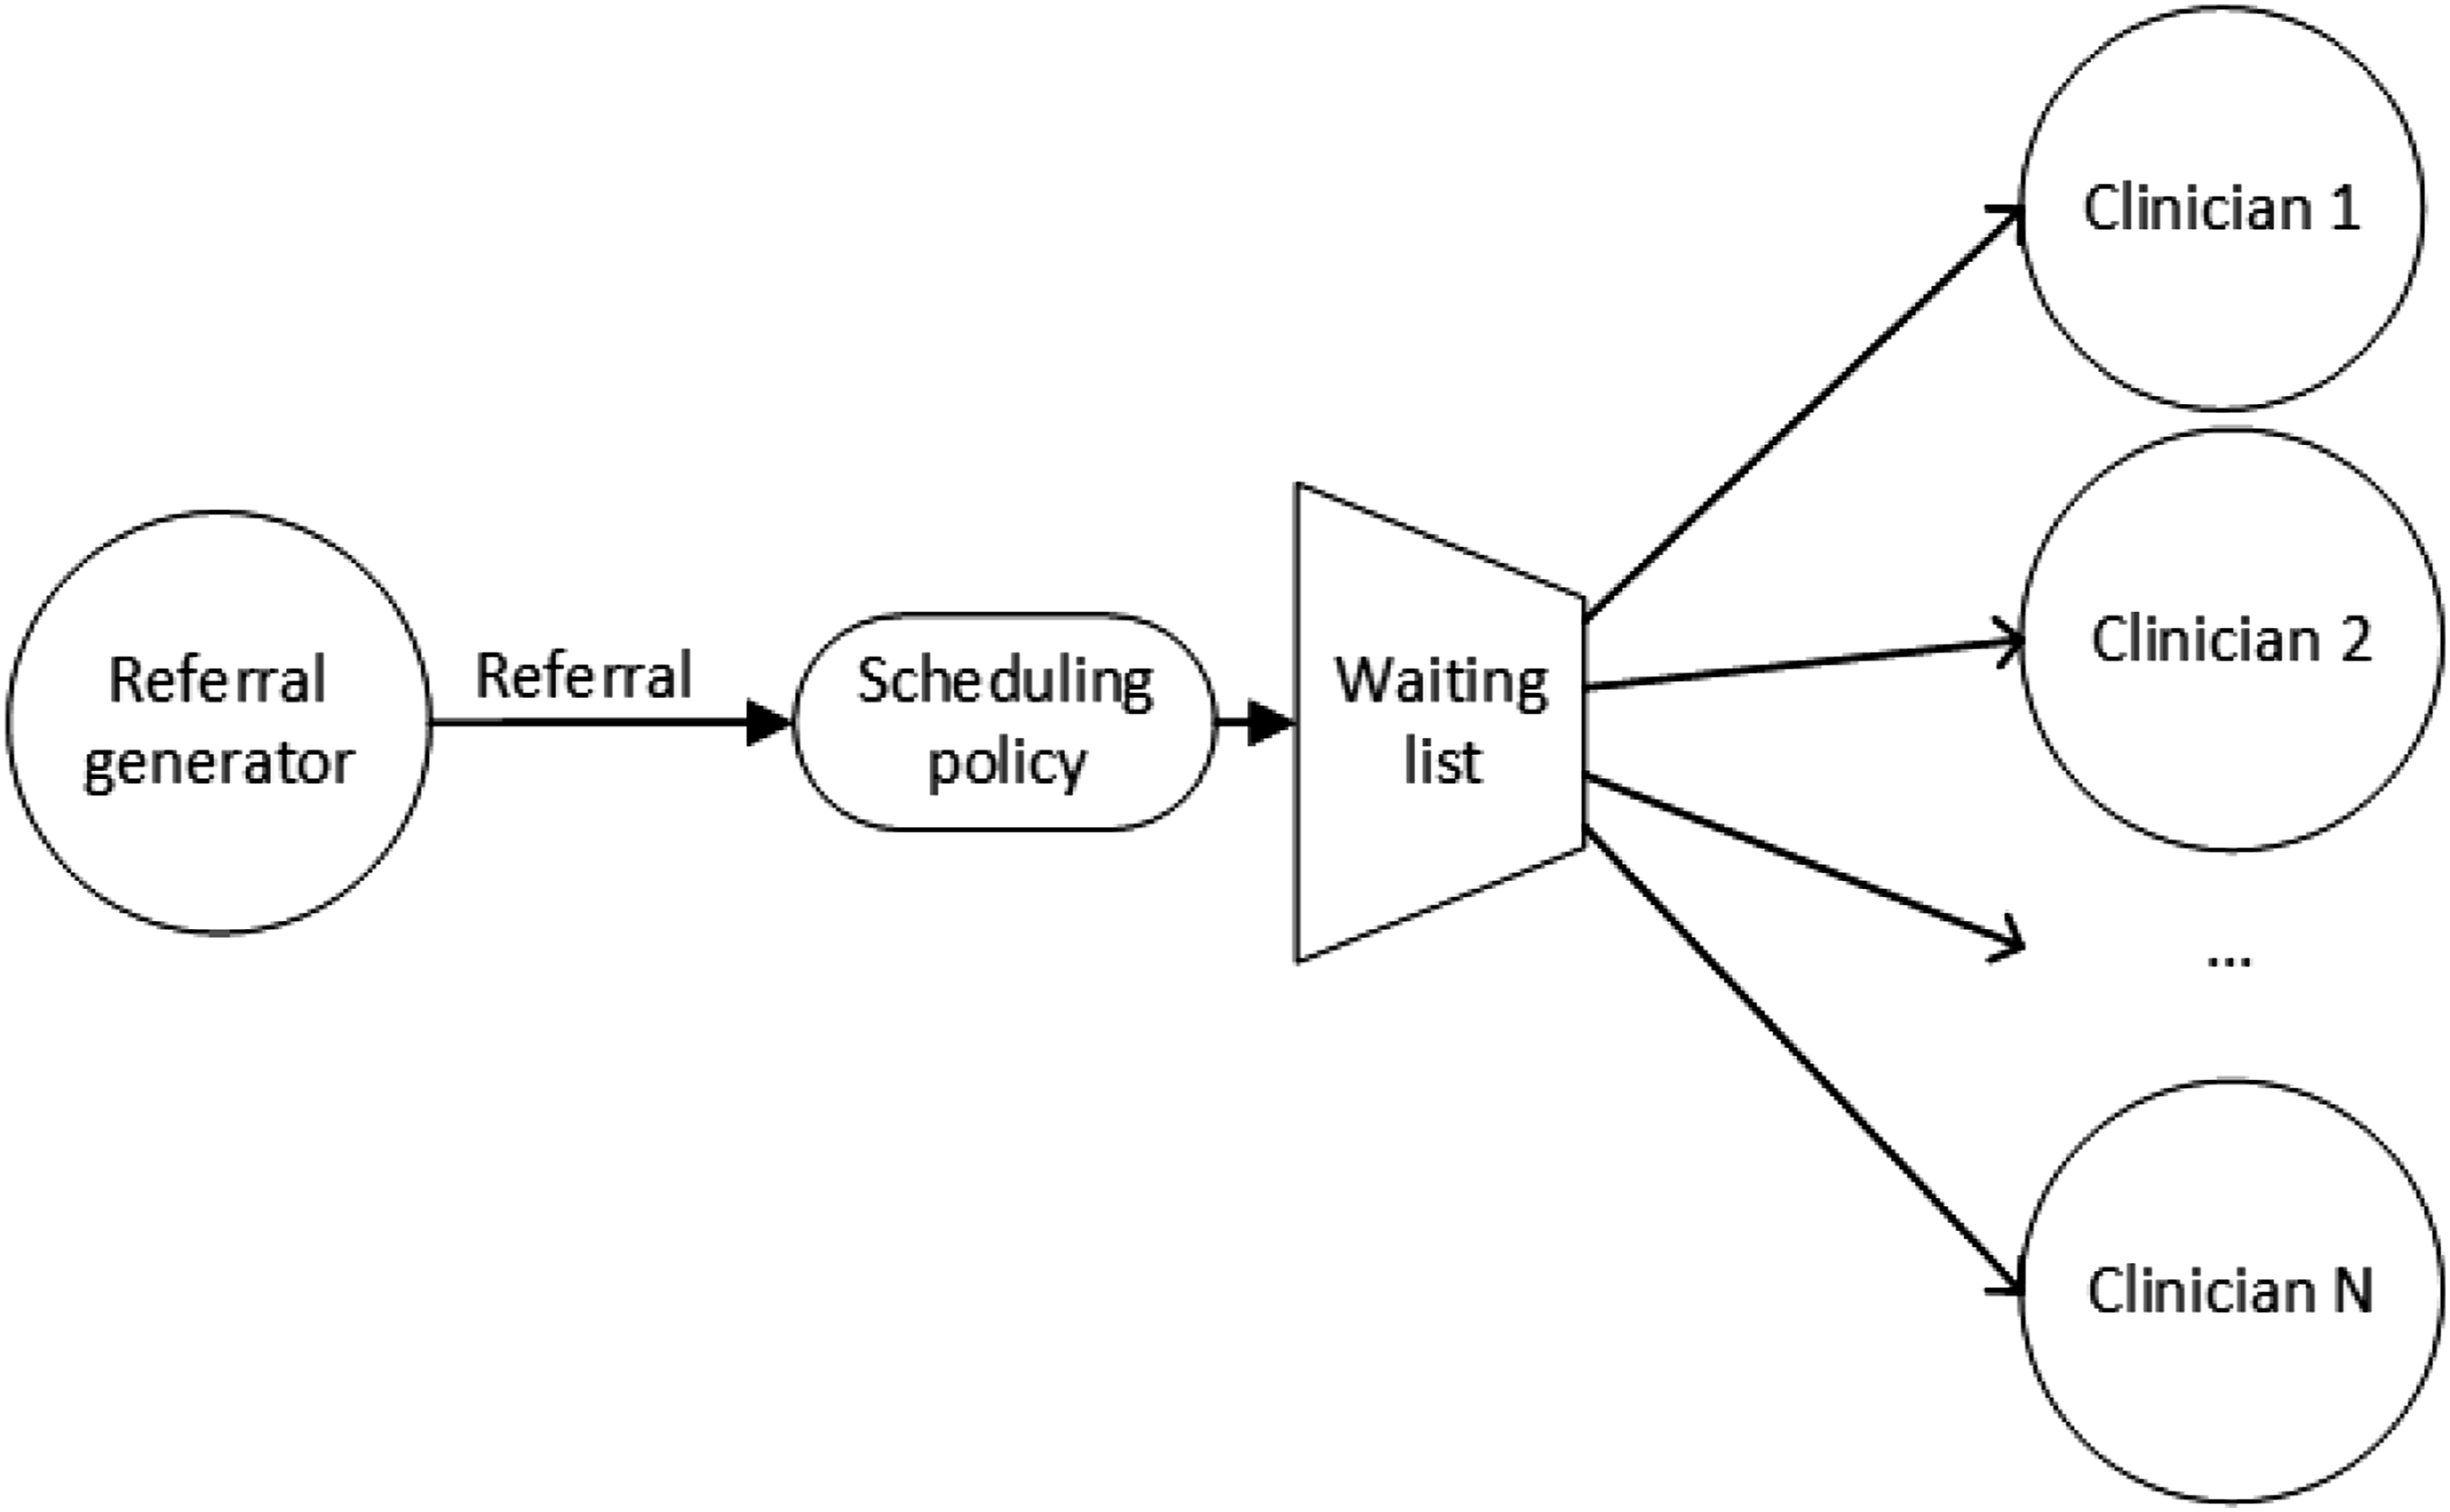
Statistical analysis
We gathered the average waiting times from each CAMHS center in two data sets: before and after the intervention. The data was gathered from the same sample group (or CAMHS center). The difference in the two data sets is merely the change in planning policy implemented (the intervention). Based on the quantitative data that was gathered, the sample size, and the aim of this study, a t-test is conducted to determine the statistical significance between the waiting times, before and after the intervention. Given our sample consists of matched pairs of similar units, our study implored a correlated (paired) t-test. A paired t-test may be appropriate when the same group is being tested repeatedly (e.g. before and after an intervention).
Results
In this section, we discuss the results for one of the three CAMHS centers included in the project. The results for the other centers have similar characteristics and similar outcomes.
Preliminary results
Figures 4 and 5 illustrate the impact that the current scheduling policy has on waiting times. Figure 4 shows that CAMHS plans their intake based on the governmental deadline given, often 4, 8, 10, and 12 weeks. As stated in the methods section, intake was organized at a fixed time (Wednesday 9.00 a.m.) every week. This meant that there could be a variation of 1–7 days from the governmental deadline. In Figure 4, our studied identified five patterned peaks in waiting times which corresponded with given governmental deadlines: 30 days (4 weeks), 40 days (5 weeks), 54 days (8 weeks), 68 days (10 weeks) and 83 days (12 weeks). Waiting time distribution, number of referrals with given waiting time. Variation in activity-levels, weekly referrals and intake.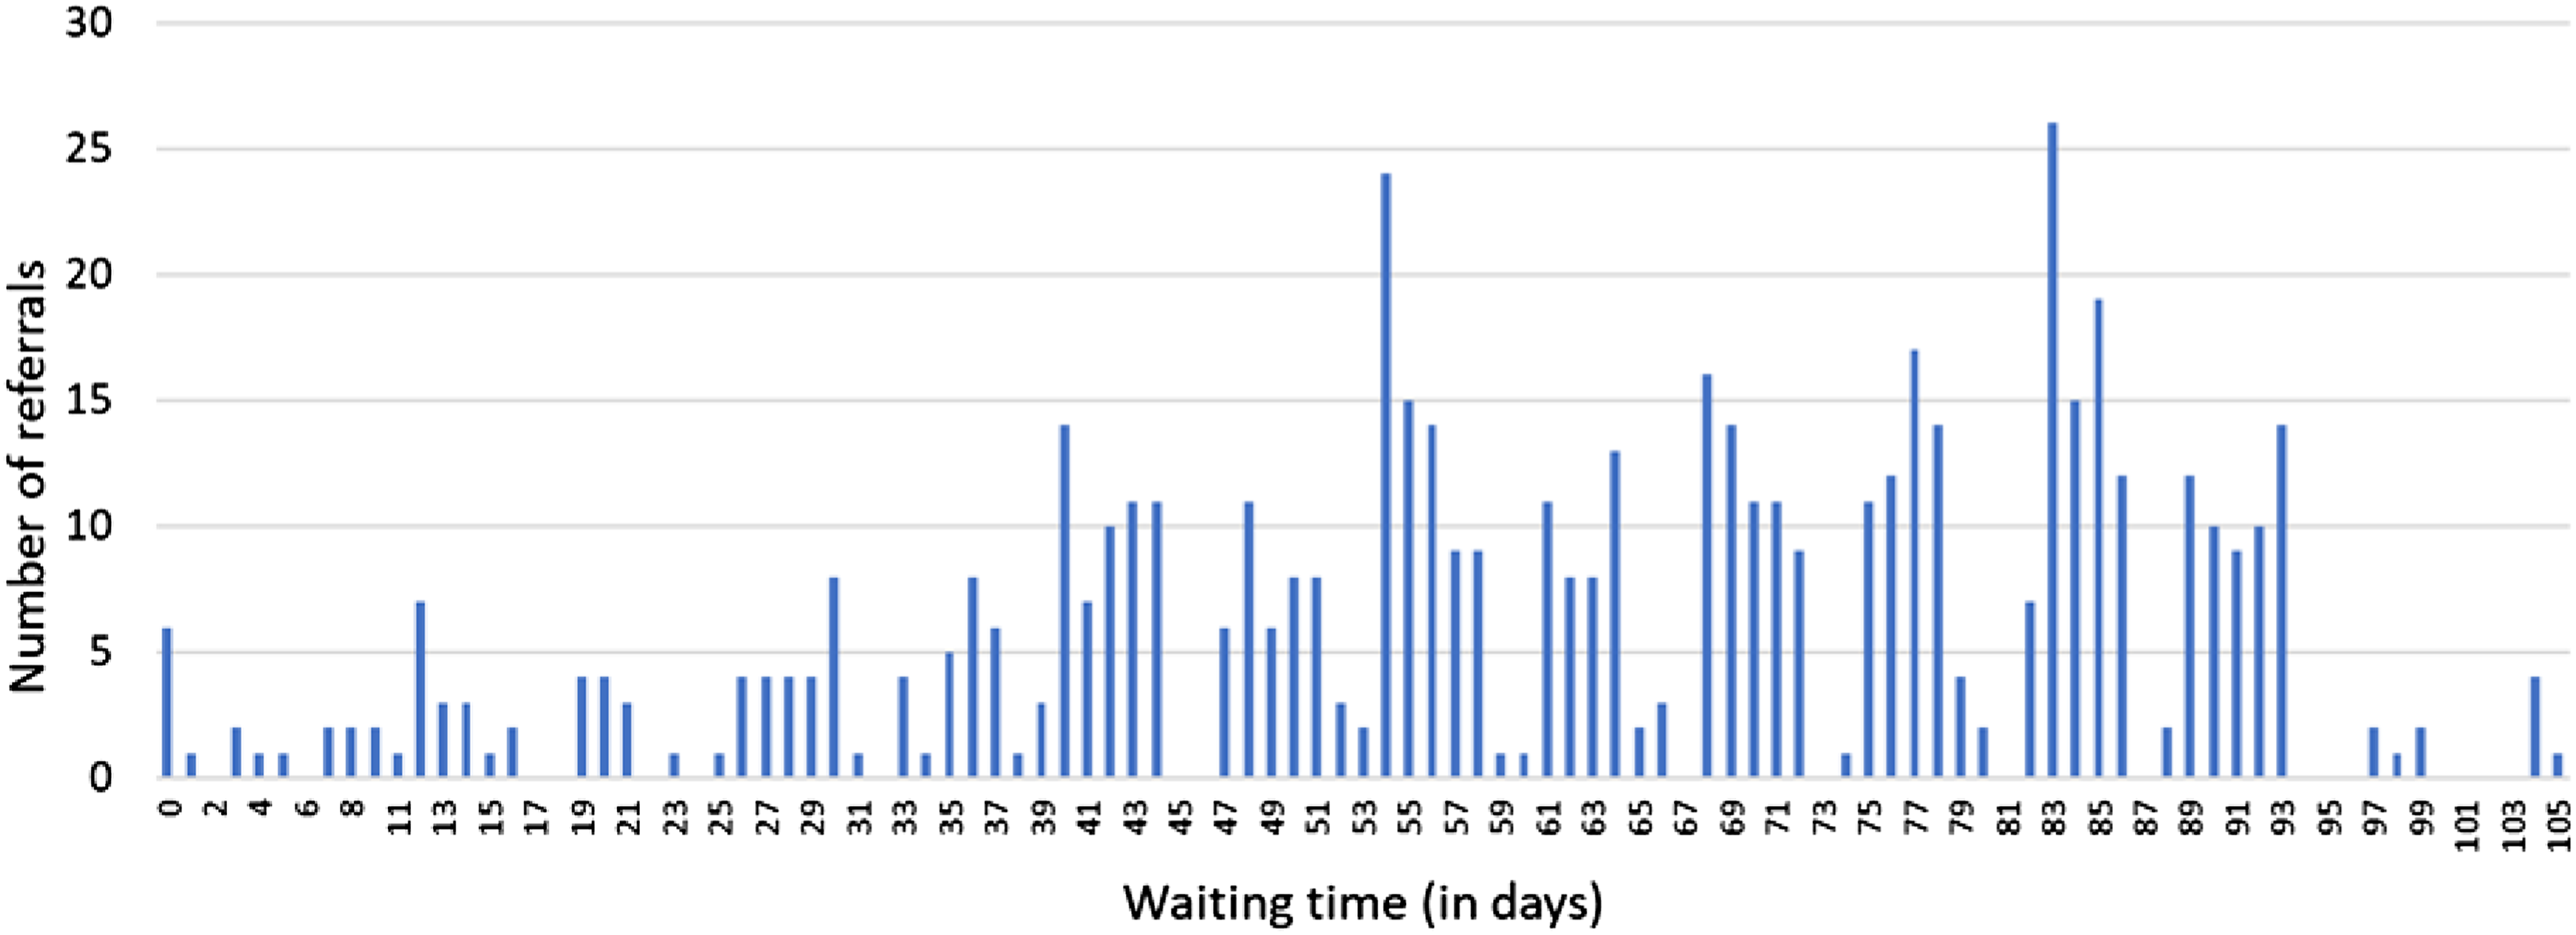
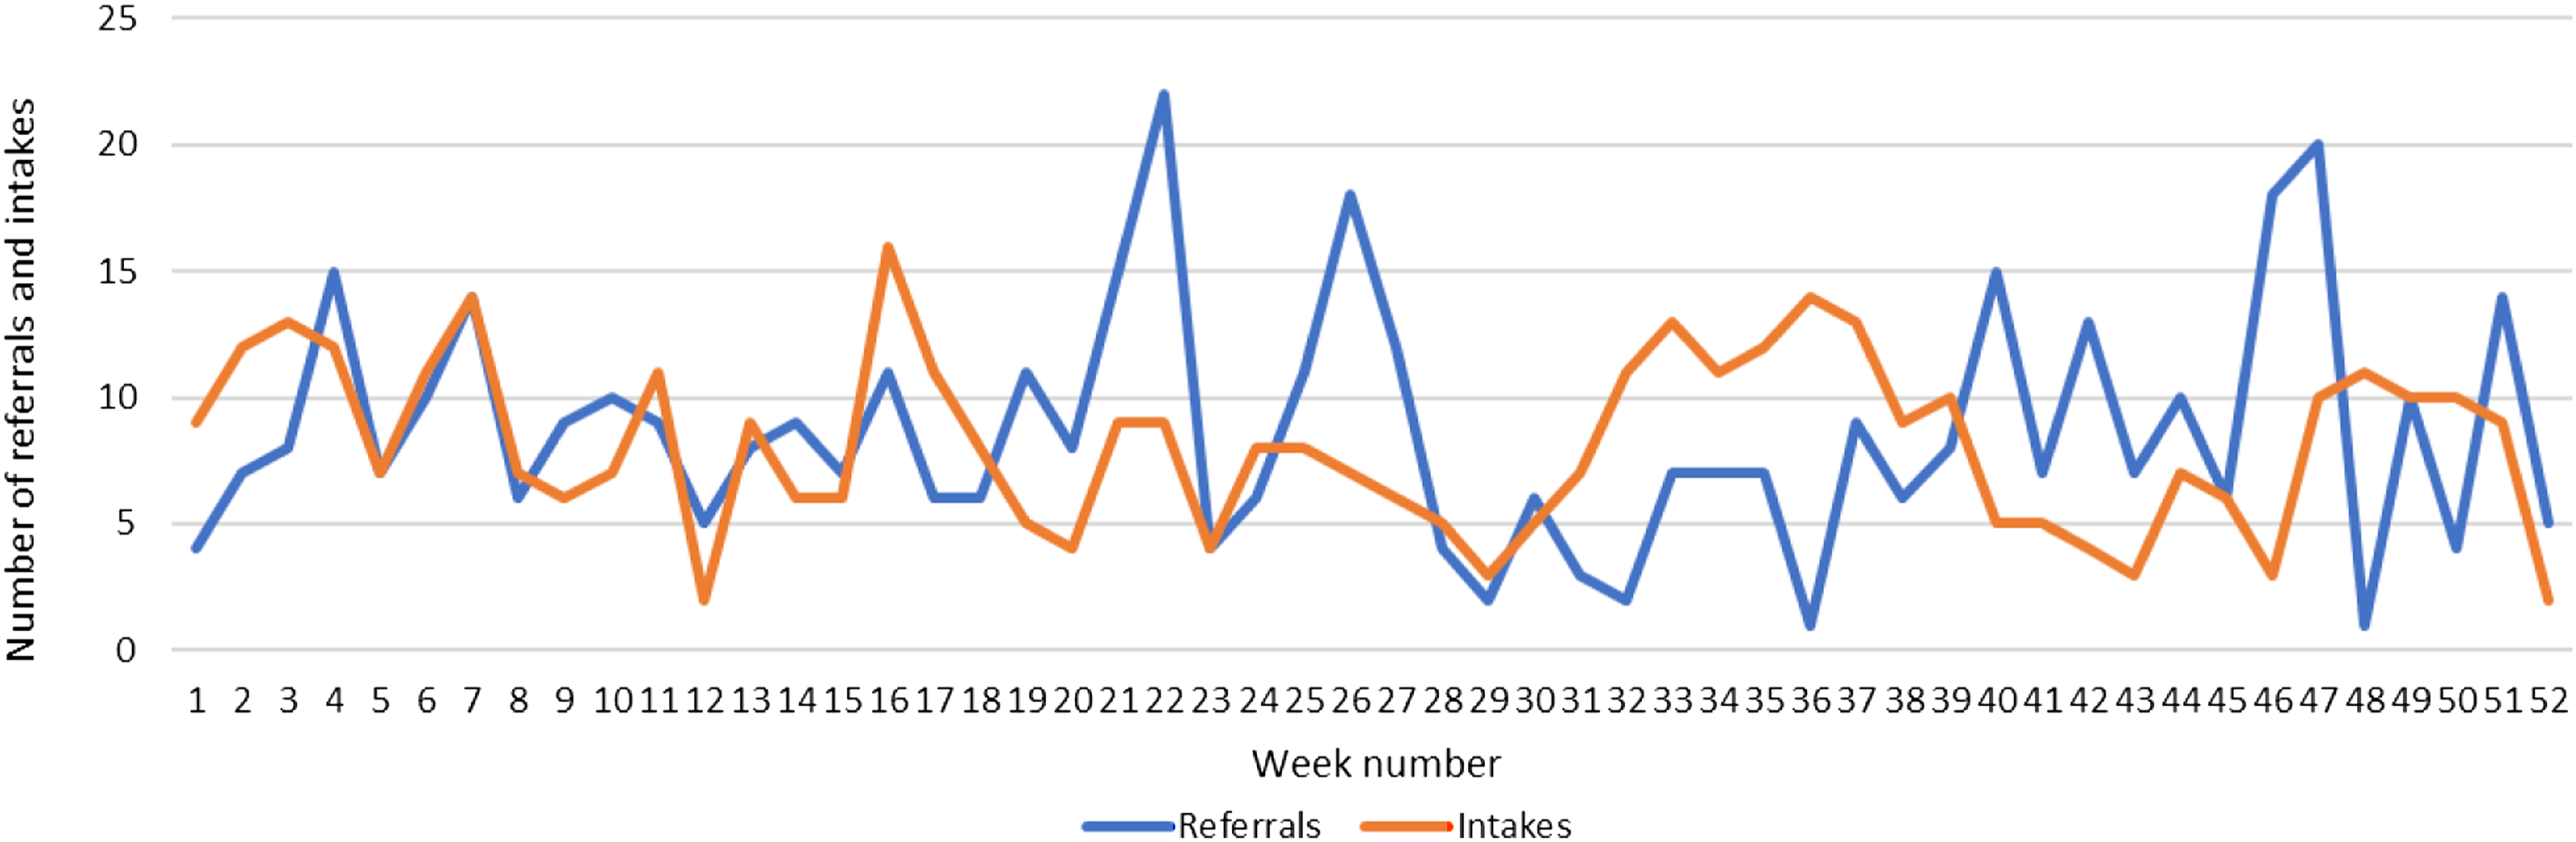
Figure 5 shows that the number of referrals and intake per week varies considerably. Referrals represent uncontrollable variation; as high as 22 referrals in week 22, and as few as one in week 36. Intake represents controllable variation; as high as 16 in week 16, and as few as two in week 12 and 51. In the referral data (years 2012 through 2016), a seasonal pattern is found that indicate a rise before the summer and before the end of the year, while there are generally low referral rates during the summer holidays. We can spot a similar trend in Figure 5. This scheduling policy has resulted in undesired waiting times, greater than 40 days (see Table 1, before intervention).
Results from computer simulations of new scheduling policy
Setup of scenarios.

Figure 6 shows the simulated development of the waiting times for the scenario A1, B1 and C1 that represents the status quo with respect to the referral rates. It is seen that if this CAMHS center changes the scheduling policy, but maintains current intake capacity (Scenario A1), the waiting times are predicted to grow over the next 3 years. Furthermore, Figure 6 shows that if this CAMHS center, in addition to implementing the new scheduling policy, makes a slight increase in their weekly intake as indicated in Scenario B1, their waiting times will decrease. The simulations also show that Scenario B1 will provide waiting times under the target of 40 days, also during summer vacation periods with the lowest capacity. A further increase in intake capacity, represented by Scenario C1 will decrease the waiting times even further. While the actual number of performed intakes will be same in Scenarios B1 and C1, Scenario C1 will likely lead to situations where the intake slots remain unused since there are no new patients on the waiting list to schedule. Hence, Scenario C1 should be seen as more costly compared to B1. Waiting times for Scenarios A1, B1 and C1, simulated over 3 years.
Figure 7 shows details of the number of referrals and intakes through a year in one simulation of Scenario B1. Comparing with Figure 5, we can see that while the weekly number of referrals varies through the year in the simulation, the new scheduling policy leads to a more balanced number of weekly intakes. The holiday weeks can be spotted with having only five intakes. The remaining weeks vary between 8 and 10 according to the modelled randomness in intake capacity. Figures 5 and 7 indicate that the current planning practice is causing unnecessary variation in the clinical activity compared to the new scheduling policy. Thus, we can see that the new scheduling policy ensures both reduced waiting time and a more balanced workload for the clinic. Weekly number of referrals and intakes from a simulation of Scenario B1.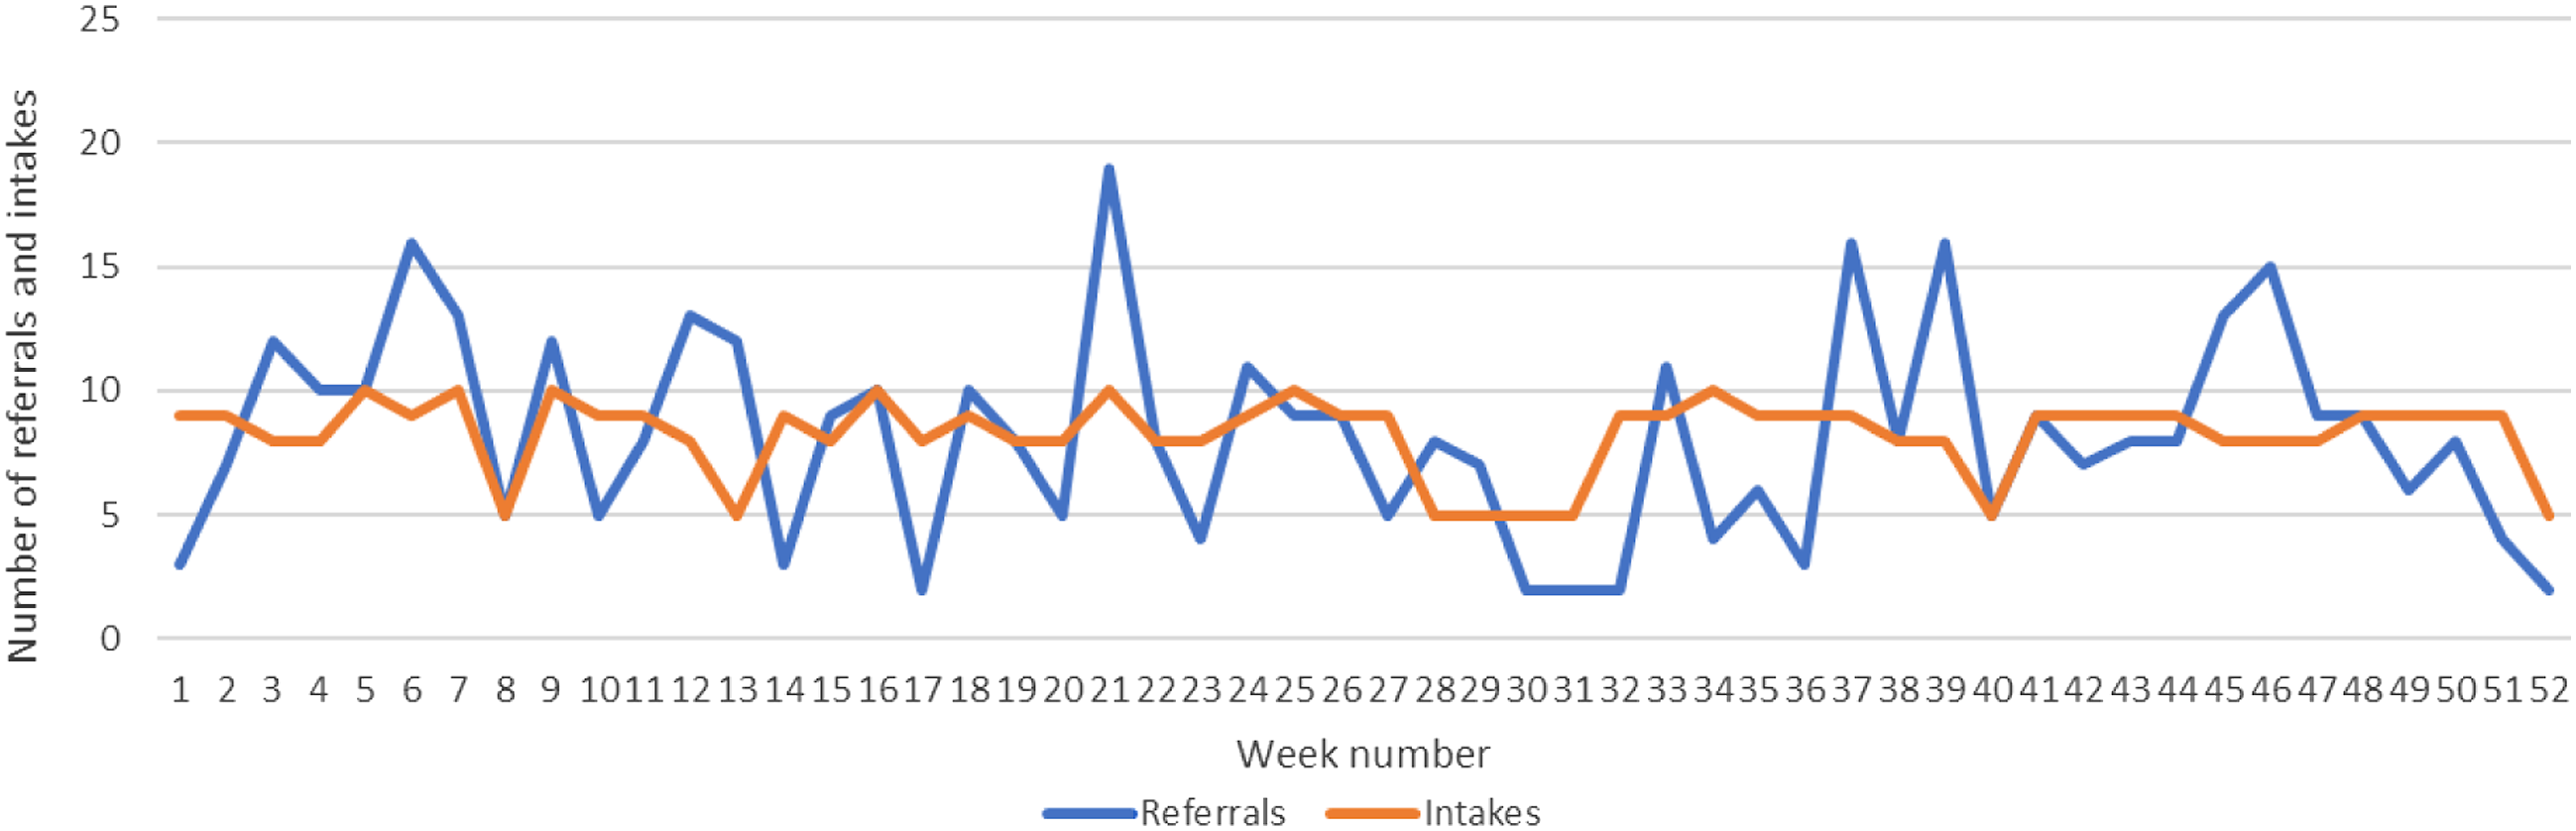
Figure 8 presents the simulated waiting times for the scenarios with a 20% increase in referral rates. Here, we can see that the waiting times in both Scenario A2 and B2 are predicted to grow quite extensively over the next 3 years. Hence, the capacity reserved for intake in these scenarios is to little. However, looking at the simulated waiting times in Scenario C2, we can observe that the capacity seems to be enough to provide waiting times under 40 days. Waiting times for Scenarios A2, B2 and C2, simulated over 3 years.
The correlated (paired) t-test, based on waiting times in Table 1, resulted in statistical significance p = < 0.00,136, meaning p < 0.001.
Discussion
An overview of the tested propositions.

Operational research and computer simulation can be used to predict the impact that current activity levels will have on future waiting times (see Figures 6 and 8), and lead to an actual reduction in waiting times (see Table 1), affirming P2 in Table 3. Managers and clinicians in the CAMHS centers found simulation techniques to be a very useful tool when determining the most appropriate action that should be enacted, given a list of different ideas. The simulation techniques were used to test several different scenarios to determine the most appropriate action to be taken. Managers and clinicians found this tool to be useful in predicting the effect each action or idea had on waiting times for both the short-term, long-term, and in specific periods of the year (summer vacation and holiday periods) prior to any actual resources being used. Figure 6 shows that if this CAMHS center continues working at their current activity level, then their waiting list will only grow, leading to longer waiting times (Figure 6, Scenario A1). However, if this CAMHS center implements the new scheduling policy, and slightly increases their weekly intake to obtain Scenario B1, then this will reduce their waiting list, and consequently their waiting time annually, taking into account seasonal variation. This proposition (P2 in Table 3) was tested and confirmed by the CAMHS center. After implementing the intervention into organizational practice, waiting times reduced considerably (see Table 1, after intervention).
Today, many clinical managers are left guessing each week or month how their current activity levels (or referrals) and capacity will impact their current and future waiting times. This is especially problematic for managers that experience seasonal variation (e.g. increases in referrals before summer holiday or Christmas vacation). This new scheduling policy along with the simulation model will aid clinical managers in planning and prioritizing their weekly and monthly activity, so that their waiting times are held within an acceptable range, and their workloads more balanced.
It should also be noted that the first available slot rule can also be adjusted to handle patients with different priority levels by reserving a number of intake slots per week for more urgent patients. The number of such slots to reserve every week could also be predicted based on the historical data on patient referrals, and the waiting times could be estimated using the same simulation model.
Conclusions
Prior research has explored different strategies or theories that may reduce waiting times, but these strategies have not tested actual impacts on waiting times. Our intervention study does just that, it shows evidence-based results that new planning policies, in our case with the assistance from computer simulation, aid clinical managers in setting appropriate intake goals (weekly/monthly activity-levels), which will lead to acceptable levels of waiting times. The new scheduling policy has reduced St. Olavs hospital’s waiting times from up to 65 days in 2016, to under 40 days. These waiting times did result in statistical significance (p < 0.001), and the waiting times have been held under 40 days since implementation of the new policy, 2017–2020 (see Table 1).
Our findings are important, especially for CAHMS where (a) successful treatment is dependent on timeliness and (b) these areas of healthcare services often struggle with growing waiting times. Hopefully, this study will encourage other health care institutions dependent on timeliness to explore the use of simulation models in setting appropriate intake goals.
Limitations
Our study focuses on a new method used for analyzing clinical data, simulation modelling. This method was important to emphasize as it sheds light onto the utilization of clinical data. However, our study does have its limitations. The study did not investigate how or to which extent management and leadership conducted the implementation of the new planning policy. Through the qualitative data gathering process our study had several organizational observations: a need for change (waiting times were growing larger), that clinicians had been struggling with high workloads, and that leadership at several levels were involved (directors at the hospital, clinical leaders and middle managers). It was clear to us that leadership, both upper and middle managers, played an important role in involving the entire organization in the change. However, this study did not have implementation measures in place to confirm or deny any propositions regarding the impact of organizational conditions on the waiting times.
Future research
A limitation of this study was that the theory was tested at one department, it seems the model could be used at many out-patient care clinics. We believe that future studies should test this model or theory in other clinical contexts (outside of CAMHS) to determine if this can be a hospital-wide policy for several outpatient clinics.
Additionally, this study was limited to merely intake or inflow. It’s important that when an organization is changing and improving workflow, both aspects of inflow and outflow are considered. In our study, outflow was considered and monitored, but the contribution to theory and practice was in changed scheduling policy for referrals (inflow). When future studies further test this theory, it’s important that they consider both inflow and outflow (or discharging patients).
Footnotes
Acknowledgements
We would like to thank the personnel at St. Olavs hospital CAMHS, and in particular the Head of the Department, Anne Bjørg Nyseter, for good collaboration throughout the project. We are grateful for the comments and suggestions made by the anonymous reviewers, which helped us to improve the paper.
Declaration of conflicting interests
The author(s) declared no potential conflicts of interest with respect to the research, authorship, and/or publication of this article.
Funding
The author(s) received no financial support for the research, authorship, and/or publication of this article.

Technical details on the simulation model
Activity diagram of the simulation model.