



Abstract
Maintaining the quality and reliability of electricity transmission lines is central to effective energy governance. However, transmission line siting is often a contentious policy decision since permitting and constructing lines may involve private and public property, residents and communities, and localized and national concerns. Yet, policy conflict in transmission siting across cases and over time has remained largely understudied. This article derives and tests hypotheses about policy conflict in the context of transmission lines completed or constructed between 2017 and 2018 in the United States. In exploring the full population of transmission lines, we find that a majority exhibit relatively low and moderate levels of conflict and attention rather than high levels. We further examine a subset of six of these cases that represent a range of conflict and attention intensity. We describe variation in the diversity of actors and frames, advocacy coalitions, and the volume of discourse associated with transmission line siting over time. As problems related to energy governance have become more complex, energy siting disputes are likely to remain a fruitful area for research on policy conflict.
Keywords
Introduction
Energy sources, such as wind, solar, and natural gas, necessitate linear infrastructure—electricity transmission lines and gas pipelines—to reach consumers. Despite extensive investment in electricity transmission infrastructure over the past decade, 1 the U.S. still requires new or expanded transmission facilities to meet increasing electricity demand and maintain a reliable power supply (Goggin et al., 2021; U.S. Energy Information Administration [EIA], 2018). As we discuss in more detail later, transmission lines have both positive and negative impacts that form the basis for conflicts over whether, where, and how to site the lines.
Past research has examined several factors associated with stakeholders’ opposition to transmission projects, such as Not-in-My-Backyard (NIMBY) concerns (Komendantova and Battaglini, 2016), a high level of place attachment (Devine-Wright, 2013), inadequate regulatory frameworks (Steinbach, 2013), insufficient public engagement (Knudsen et al., 2015), and a lack of communication with residential customers (Lineweber, 2011). 2 However, most of these findings are derived from case studies – excluding opinion poll studies of general beliefs and perceptions about siting – and focus on cases that exhibit high conflict and attract the most attention (see Devine-Wright, 2013; Knudsen et al., 2015). The literature has tended to overlook cases that have low to moderate conflict and attract little attention. Such sampling approaches tend to skew and limit our knowledge about policy conflict more broadly.
Sampling approaches that focus on cases with higher levels of policy conflict are not unique to the literature on transmission lines or energy infrastructure siting. Much of our knowledge of policy conflict more broadly is skewed toward cases of higher conflict intensity, thus limiting our empirical and theoretical knowledge about policy conflict (Weible and Heikkila, 2017). This article begins to rectify this gap and advance the policy conflict literature by exploring cases of transmission line siting that vary from low to high conflict and attention. Another contribution of the article is developing tools for comparing and contrasting policy conflict.
We measure the full variation in conflict and attention across a population of 125 cases. From a purposive sample of six cases representing different conflict and attention levels, we explore the associated characteristics of policy conflict. We first ask: What is the distribution of conflict and attention intensity across cases of transmission line siting? To answer this question, we analyze indicators of conflict and attention from news and social media across the full population of transmission lines. From our purposive sample, we use news media coding and interviews to answer our second question: How do policy conflict characteristics—namely, the actors and their frames, coalitions, and discourse—vary across these cases?
Theoretical arguments
Policy conflict occurs when two or more policy actors express disagreement over a policy decision and engage in behaviors to influence the outcome of that decision (Weible and Heikkila, 2017). Policy conflict interweaves through all aspects of politics and policy decisions made by government actors (Choi, 2020) and has both positive and negative implications for society (Verloo, 2015). In some cases, policy conflict escalates between actors with divergent positions and gets resolved through compromise or tolerance of opponents’ claims. In other cases, policy conflict persists to the point of prolonged gridlock and stasis.
Policy conflict has recently re-emerged as a focal phenomenon, rather than being relegated to the background of public policy and administration research. Schattschneider (1960) argued that, in contested policy issues, policy actors wanting to change the status quo will expand the scope of the conflict by appealing to others and broadening the themes of the debate. Schattschneider’s work has informed contemporary policy theories that address policy conflict, notably the Advocacy Coalition Framework (Sabatier, 1988) and the Punctuated Equilibrium Theory (Baumgartner and Jones, 1993). 3 However, attention to comparing and contrasting policy conflict across cases of varying intensities has only recently emerged as a gap worth filling, as argued in the Policy Conflict Framework (Weible and Heikkila, 2017). Wolf and Van Dooren (2017, 2018) are also part of the re-emergence of this concept with their focus on the dynamics of policy conflict and the iterative effect of evidence and emotions in conflict escalation.
While few empirical studies have focused on making policy conflict amenable to comparison across cases and topical policy areas, this article contributes to the literature on policy conflict by exploring policy conflict characteristics across cases that vary in conflict intensity levels. Instead of examining the variation of policy conflict intensity in a single case (as in Heikkila and Weible, 2017), this article examines the distribution of policy conflict intensity for an entire population of transmission line siting cases. We first explore the distribution of conflict and attention around the cases through publicly available media sources. Within that distribution, we analyze characteristics of cases that vary in their level of conflict and attention. Conflict intensity can be assessed by the magnitude of disagreements among involved actors. Attention intensity can be assessed by the level of awareness that policy actors (based on social media or other online content generation) and bystanders (based on the level of news media coverage) have of the case.
The analysis is guided by the following set of hypotheses. We expect the distribution of conflict and attention intensity across transmission line siting cases to be skewed toward lower levels of intensity. We base this expectation on several rationales from the policy literature. First, conflict demands resources, forcing policy actors to pick their battles, which heightens the intensities of some situations over others (Hupe and Hill, 2016). Second, policy actors may concurrently agree to keep the most contentious issues off the agenda to keep the peace and maintain cooperation (Evans, 2007). Third, some issues may simply be less controversial. For instance, when only a single, dominant coalition exists in a policy subsystem, this can reflect the fact that there is substantial agreement around the policy issues in that subsystem (Jenkins-Smith et al., 2017). In addition, many decisions are not zero-sum games and compromise is possible, while others have diffuse impacts that obfuscate the threats from burdens and costs that can drive conflict (Katz, 2018; Quirk, 1989). Finally, certain discourse arenas, such as news media, play an active role in elevating or minimizing some debates and frames in the public sphere (Callaghan and Schnell, 2010). Given these rationales, we posit Hypothesis 1: Across a population of policy decisions, there will be a skewed distribution of conflict and attention intensities, with most cases exhibiting low intensities, some cases exhibiting moderate intensities, and few exhibiting high intensities.
We expect cases with high conflict and attention intensities to be associated with greater participation by the actors involved. This expansion corresponds with extensive social and news media attention to increase visibility and the allocation of more resources toward political strategies to mobilize supporters and influence decisions (Schattschneider, 1957, 1960). As a result, the frames used by actors in conflict become the vehicle by which privatized (or individual) claims become – or attempt to become – socialized within a collective society (Schön and Rein, 1994). This conflict process, with an increasing number of actors and their use of diverse frames to legitimize particular perspectives, is reinforced as other actors try to de-legitimize such frames and dampen their impact (Durnová et al., 2016). In doing so, actors with divergent policy positions or who perceive there to be risks or benefits from a project will compete in debates, using frames to represent these conflicting viewpoints. Thus, we posit Hypothesis 2: Policy decisions with high conflict and attention intensities will be associated with more actors and more frames.
As the intensity of policy conflict increases, policy actors tend to choose sides. Schattschneider (1960) described this tendency to choose sides in policy conflict as the mobilization of bias. A more contemporary description argues that in high conflict situations, policy actors will likely form and maintain coalitions moored to different values and positions related to the issue at hand (Jenkins-Smith et al., 2017). Indeed, the formation and maintenance of advocacy coalitions have been well established and confirmed across numerous political systems (Weible et al., 2020). There is also increasing evidence that advocacy coalitions are not just found in high conflict situations. Even in less salient or less collaborative environments, advocacy coalitions are present, although the number of coalition actors, the degree of divergence in positions, and polarization of networks might be smaller than in high conflict situations (Weible, 2008). The underlying logic that advocacy coalitions will manifest with different intensities in shaping (and being shaped by) policy conflict builds from the notion that all policy-related phenomena involve politics and to some extent disagreement. In low conflict situations, for example, advocacy coalitions might be small or mostly dormant, but we still expect to find evidence of advocacy coalitions. Thus, we posit Hypothesis 3: Cases with higher conflict and attention intensities will be associated with more pronounced advocacy coalitions, but that such coalitions will still be evident in lower intensity cases.
The policy conflict literature acknowledges the dynamics of conflict, such as flaring up and lying low (Schattschneider, 1957; Weible and Heikkila, 2017; Wolf and Van Dooren, 2017, 2018). Such shifts can be fueled by relatively acute changes in circumstances (e.g., changes in socioeconomic status, the emergence of new ideas) or the accumulated buildup of chronic tension that eventually crosses a threshold and results in quick shifts in attention (Baumgartner and Jones, 1993; Sabatier, 1988). Thus, at times, conflict intensity could be low or moderate, and at other times, it could escalate to high intensity. We do not expect all policy conflicts to have the same life cycle of conflict expansion or contraction. Some might become intensely conflictual immediately, while others do so gradually or not at all. Likewise, we expect that the intensity of the conflict will show impermanence as some sides win or lose, resources are allocated differently, and some issues attract more attention than others. Thus, we posit Hypothesis 4: Within any single case, the characteristics of policy conflict will fluctuate over time.
Research context: Siting authority for transmission lines
Transmission lines create a wide range of environmental, economic, and social impacts that confer both benefits and risks. Investments in transmission capacity increase opportunities for using renewable power supplies, which can reduce CO2 emissions (MacDonald et al., 2016). Transmission lines generate jobs and local revenue through property taxes, lease payments for rights-of-way on public land, and taxes on construction-related activities (Lantz and Tegen, 2011). However, transmission lines impose adverse effects on residents and local communities whose properties are intersected by transmission line routes, such as land-use constraints, aesthetic concerns, and property value depreciation (Wuebben, 2017). Occasionally, eminent domain is used to establish easements when property owners object to right-of-way agreements with utilities (Coleman and Klass, 2019). Permanent or long-term habitat changes resulting from construction can also negatively impact animals, fish, and vegetation (Richardson et al., 2017). Moreover, high voltage power lines may threaten human health, such as the increased risk of childhood leukemia (Amoon et al., 2018).
In the U.S., unlike interstate natural gas pipelines that are under the authority of the Federal Energy Regulatory Commission (FERC), decisions related to the siting of transmission lines are largely left to state governments (U.S. Congressional Research Service, 2020). However, given the frequent involvement of multiple impacted jurisdictions and the interest groups therein, many types of actors have the opportunity to influence transmission line siting. For example, depending on government funding or the level of impact on federal lands and natural resources, certain authorizations may be required from federal agencies (e.g., Clean Water Act § 401 water quality certification). Additionally, before allowing construction to proceed, decision-making authorities often provide public notices, comment periods, or legislative briefings for the public. These opportunities allow citizens, civil society organizations, and business interest groups to raise concerns about or express support for projects. Diverse coalitions also mobilize the broader public in the engagement with siting decisions. Nonprofits often use risk-based claims, and the industry often uses financial return-based claims during public mobilization (Spence, 2019).
In the siting processes, many regulatory and decision-making entities can be involved. Under certain circumstances, § 216 of the Federal Power Act grants the federal government decision-making power over transmission lines, referred to as “backstop” authority (Energy Policy Act of 2005). In situations where state governments have withheld permit approval for more than one year for publicly necessary transmission lines, the U.S. Department of Energy and FERC can grant a federal permit by designating National Interest Electric Transmission Corridors. Regional Transmission Organizations (RTOs) and Independent System Operators (ISOs) also play a role in determining whether and where to construct transmission lines (Rossi, 2009). RTOs and ISOs operate the transmission grid on a regional basis and work with utilities to design new lines as needed. When planning transmission line routes, these decision-making actors consider a breadth of factors, including a community’s need for reliable electricity, proximity to residences, future renewable energy demand, and potential impacts to cultural and natural resources.
Methods
We used three approaches to data collection. First, we estimated the conflict and attention intensity of each case in our population of 125 transmission lines using an original proxy scale (herein the “conflict-attention intensity” scale) that stemmed from multiple sources. Second, a purposive sample of six cases was identified, representing cases of low, moderate, and high levels of conflict and attention intensity. We measured policy conflict characteristics across these six cases by coding policy actors’ statements in newspaper articles covering the cases. Our coded data of statements from news media allowed us to identify the framing, coalitions, and temporal dynamics of these six cases. Third, we complemented the media data in the six cases with a set of semi-structured, in-depth interviews with policy actors who participated in these policy debates.
Method 1. Measuring the distribution of conflict-attention intensity for a population
We identified a population of transmission line projects in the U.S. using the North American Electric Reliability Corporation’s (NERC) Electricity Supply and Demand database. This database offers the most comprehensive list of transmission lines in the U.S. (NERC, 2018). We compiled every transmission line project greater than 10 miles in length that was recorded as “completed” or “under construction” over two years (2017-2018). 4 There were 125 such projects.
As conflict intensity is a latent and ambiguous concept that is difficult to measure directly for a large number of cases, we developed an original proxy scale of conflict-attention intensity. This 13-point scale (0-12) reduces potential biases from using a single source measure and distinguishes two related concepts of conflict and attention. We separate these concepts in our scale to acknowledge that, though we are primarily interested in conflict, the level of attention given to any particular project is likely related to the level of conflict observed. Six points are possible from attention scoring, and the other six points are possible from conflict scoring. We derived these scores from searches of news media coverage, social media (Facebook and Twitter), and Google. We used both formal names and colloquial names as project search terms.
The first three attention points came from news media coverage of each project through NewsBank and Nexis Uni. We gathered the total number of articles for each project and the range of years that each project was covered by news media, from the first reported date for each project to the end of March 2019. Relative to the population of 125 projects, those whose average number of yearly articles was in the lowest third received one attention point, those in the second third received two attention points, and those in the top third received three attention points. Projects that had no news media coverage were scored as zero. The next three attention points came from Facebook, Twitter, and Google Trends. Using the same search terms as above, we looked for any mention of the project on these platforms. Points on each of these three sources were assigned as one point if the project was mentioned on the platform, or zero if not mentioned. Any given project could receive a total of three points if it was mentioned on all three platforms. Similarly, six conflict points came from Facebook, Twitter, and Google Search, scored as two points for each platform if conflict was discussed on any of the platforms (for up to six possible points), or zero if conflict related to a particular project was not discussed. We used Boolean operators to narrow down the search to only those that may indicate conflict. 5 We did not code conflict in news media because the news media, as curated content, may be biased toward coverage of conflict.
The conflict and attention scale gives equal weight to conflict and attention. It also ensures that no project can be classified with low conflict intensity based on a lack of media coverage alone, since a maximum of six conflict points are possible if there is evidence of conflict on social media and Google searches. We measured the extent of each project’s coverage in these sources, with scores ranging from 0 (no conflict-attention) to 12 (highest conflict-attention), to test Hypothesis 1.
Figure 1 visualizes the spatial distribution of conflict-attention intensity across transmission line projects by tracking every county name along each transmission route. It covers 310 counties where 125 projects were built or being built. The location of transmission lines was a selection criterion that informed the choice of distinct cases from the population.
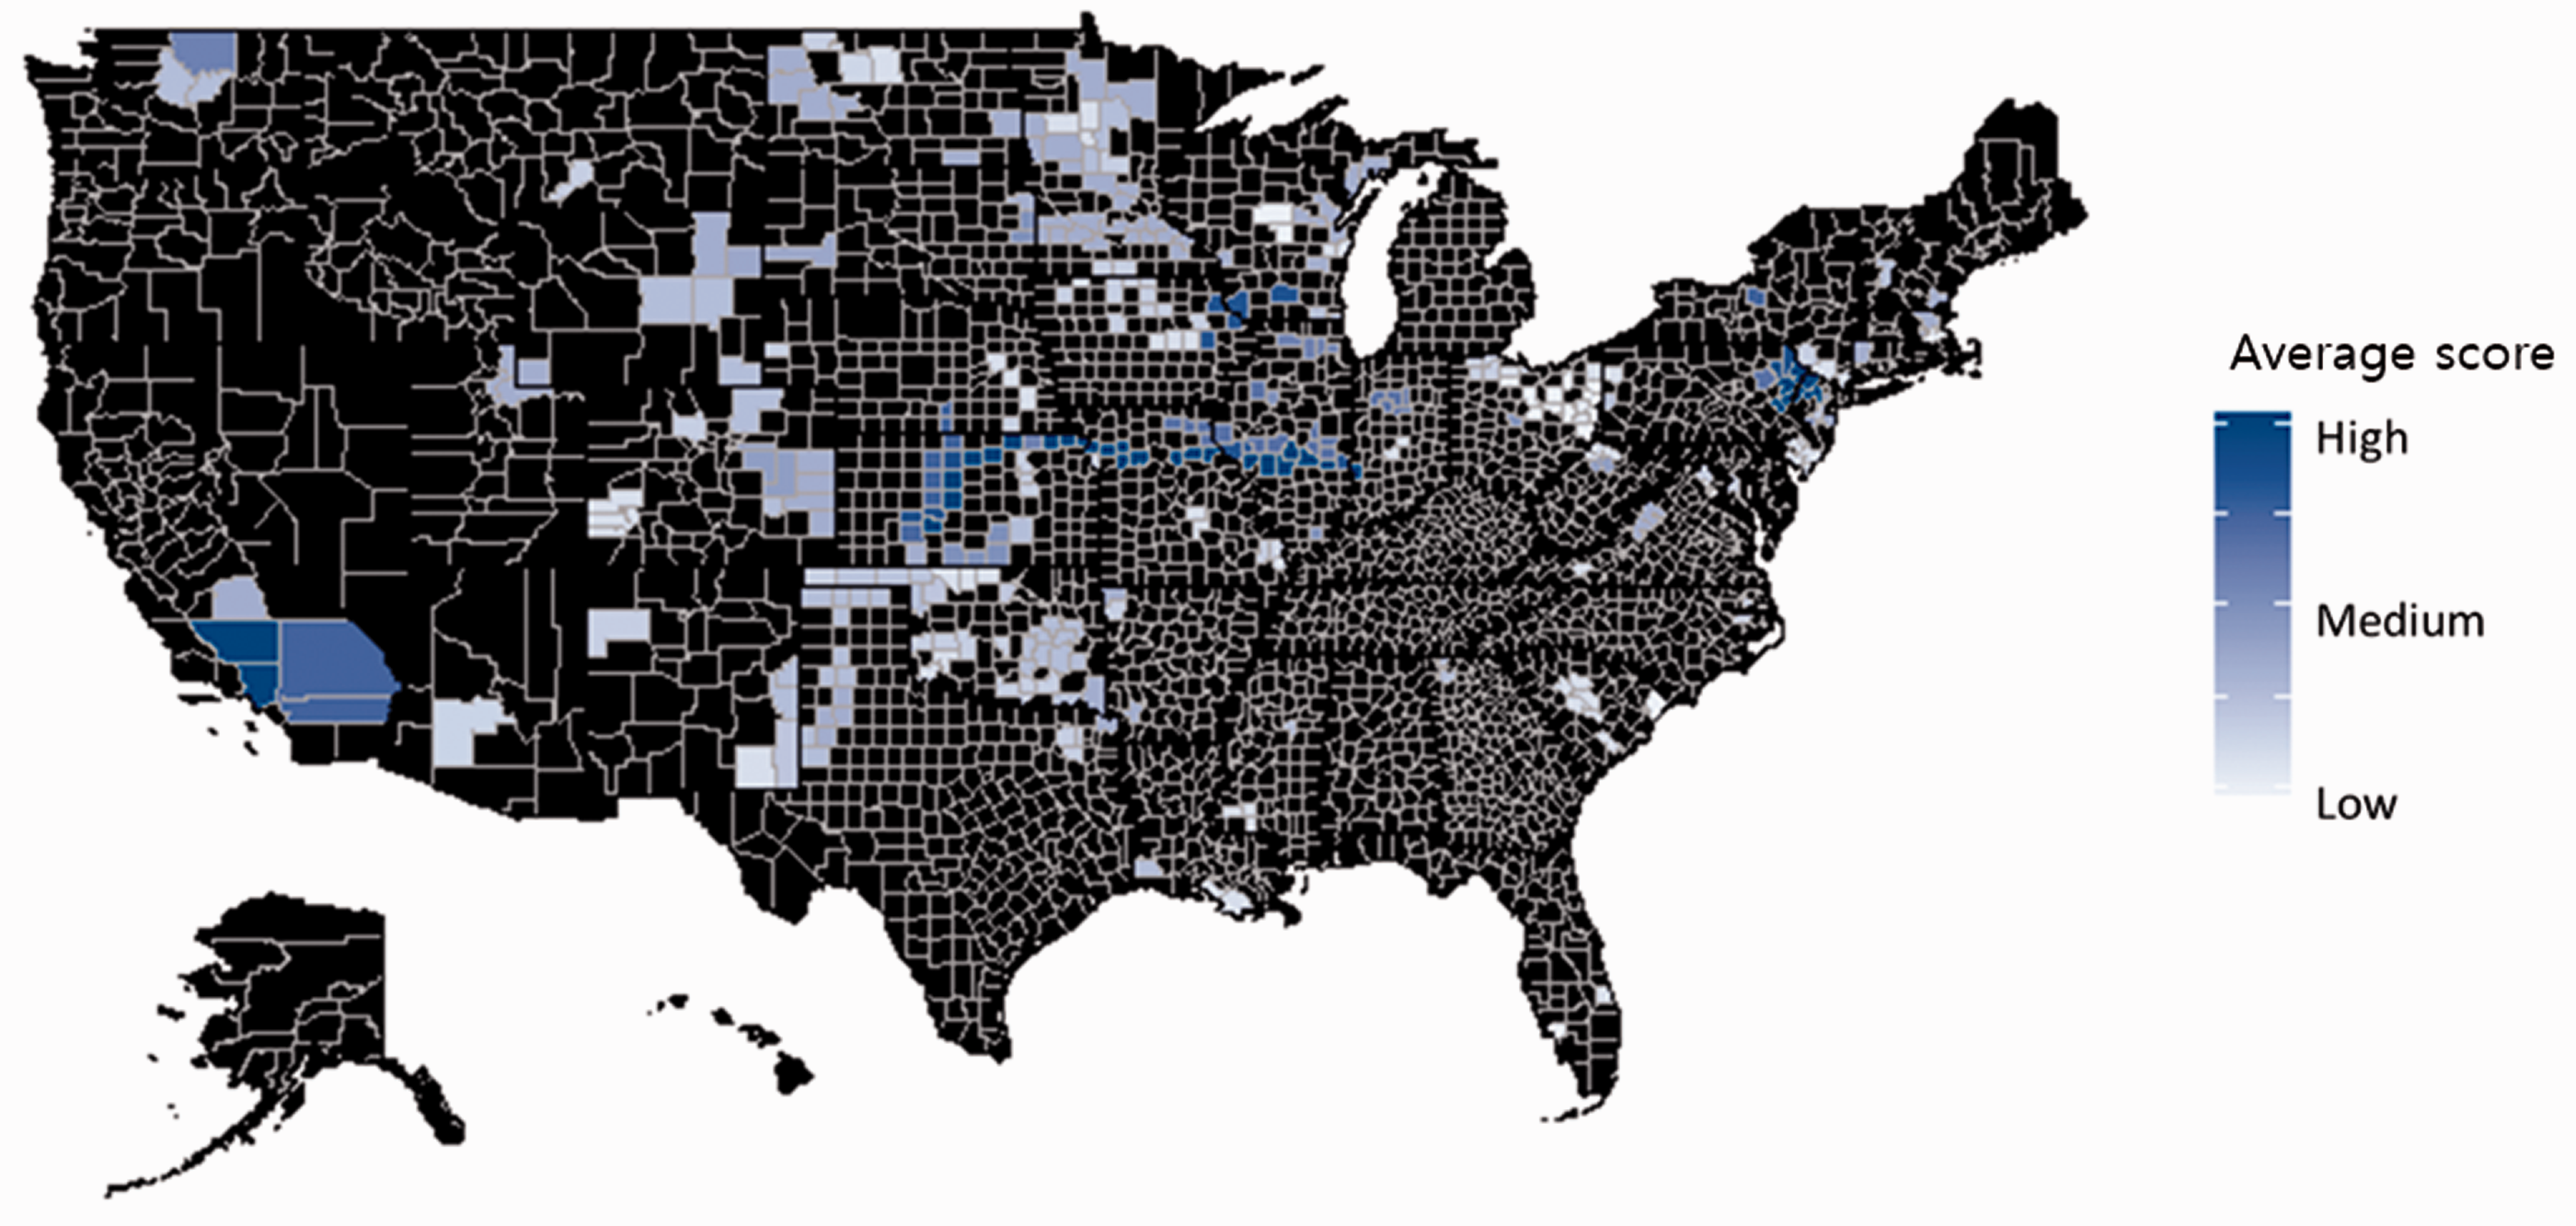
Average conflict-attention intensity score by county.
Method 2. Measuring policy conflict characteristics across a sample of cases
To develop measures of policy conflict characteristics identified in Hypotheses 2, 3, and 4, we selected six cases that differ in conflict-attention intensity and location but are similar in size. As shown in Table 1, the six cases are Badger-Coulee Transmission Line, Tehachapi Renewable Transmission Project (both high conflict-attention intensity), Grand Prairie Gateway Project, Greentown-Reynolds Electric Systems Improvement Project (both medium conflict-attention intensity), Antelope Valley Station-Neset Transmission Project, and Hitchland-Woodward Transmission Line (both low conflict-attention intensity). Appendix A provides details of these six cases.
Overview of six transmission line cases.

To test Hypotheses 2 through 4, we collected data on pro- and anti-transmission line statements and frames for each case. We gathered the data from news media coverage of the projects over the full life cycle before April 1, 2019, using NewsBank and Nexis Uni. The news media data allowed us to identify policy actors, their policy positions on a project siting, and how they perceived and emphasized their policy positions through framing. This source was also valuable for collecting data over long periods of time on each case and applying the same data collection procedure across different cases. We coded the news media using Discourse Network Analyzer (DNA), which is a program that plots the network matrices of actors linked by shared concepts based on statements in the raw texts. After three rounds of pilot coding, we developed the DNA coding protocol on transmission lines (see Appendix B). Frames were adopted from a previous study of pipeline siting conflicts by You et al. (2020). Although this approach is helpful for understanding phenomena across contexts, it has limitations, including the loss of richness. 6
Coding protocols were strictly followed to ensure coding accuracy and consistency. An inter-coder reliability test was performed on 20 percent of the coding. Each coder independently coded the same set of news articles and compared results. Greater than 80 percent agreement of coding results was achieved, and remaining coding discrepancies were resolved through coder discussion. A data set containing 559 statements from 223 news articles was produced (see Table 2).
Coded information for case comparison.

We used the output from the raw data to create a measure of the coalitions in the cases. To do so, we employed the congruence network method specified by Leifeld (2013), which identifies the congruence of policy beliefs among actors. This congruence was measured according to actor agreement or disagreement on frames in statements. When we assessed the congruence between actors’ perspectives in each debate, we defined each perspective as a unique combination of frames used and pro- or anti-transmission line sentiment. We calculated a normalized congruence score between each pair of actors in a debate from these coded data, which corrects potential bias that might arise from some actors making more statements than others. This calculation is the number of matching perspectives that two actors used divided by both actors’ total number of perspectives. The normalized congruence score, which lies between zero and one, provides the edge weight between these two actor nodes in the actor congruence map.
Method 3. Interviews
After we received institutional review board approval for this study, we conducted seven interviews across three projects, each project representing a different conflict-attention intensity. Interview questions were related to a project’s context and the nature of conflict in siting debates (see Appendix C). Interviewees were industry actors, regulatory agencies, local government representatives, and nonprofit members. Initial interviewees were selected from the pool of actors named in news media, intending to capture the full range of policy preferences. Additional interviewees were identified using a snowball sampling technique, which resulted in 28 potential interviewees. We made up to three attempts to contact each potential interviewee, and seven ultimately agreed to be interviewed. Interviews were conducted via phone, and each lasted between 45 and 90 minutes.
Results
Distribution of conflict-attention intensity (Hypothesis 1)
We expected the distribution of conflict-attention intensity in a population to skew toward low or medium intensity, with relatively few cases of high intensity. Figure 2 confirms this hypothesis, showing a higher relative proportion of cases to be of low conflict-attention intensity. 7 The majority of all cases, or 81.6%, were classified as low conflict-attention intensity. Medium conflict-attention intensity cases were the next largest category, comprising 12.8% of all projects. Just 5.6% of projects were classified as high conflict-attention intensity.

Number of projects by conflict-attention intensity score.
Table 3 numerically displays Figure 2. The distribution of conflict-attention intensity has a positive skew to the right, and the Shapiro-Wilk normality test shows that our data significantly deviate from a normal distribution.
Descriptive statistics of conflict-attention intensity.

***p < .001.
Interviews broadly support the conflict-attention intensity scores and suggest nuances associated with different intensity levels. For instance, in a case of medium conflict-attention intensity, an interviewee from a regulatory body indicated that although there had been some conflict with landowners, the utility made compromises to address landowner concerns. This supports conceptualizations that situations of low or moderate policy conflicts equate, in part, with a willingness to compromise (Weible and Heikkila, 2017). Similarly, interviews from one of the cases with a low conflict-attention score indicated that there had been relatively little conflict in the siting process. Two different interviewees raised the only instance of notable conflict within this case about a historic site. However, the landowner of the site did not see any threats from the line being built, and the utility, state historical society, and federal agencies determined that the transmission line would not pose a significant threat to the site, and the issue was resolved without further conflict expansion. The actors who initially raised concerns about the historic site did not respond to interview requests.
These qualitative data suggest that one feature of low and moderate conflict intensity cases, when compared to high conflict intensity cases, is that when instances of conflict arise, they do not persist for extended periods nor expand sufficiently to include more actors. In contrast, interviewees who had participated in a high conflict-attention intensity project (TRTP) described a complex array of issues that persisted and flared over time. For instance, after several electric towers had been placed in a community, community members encouraged elected officials and other well-known individuals to visit the project and see how conspicuous the towers were, thus actively expanding the conflict. This ultimately led to having an underground portion of the transmission line. Another interviewee who also discussed this conflict indicated that more affluent communities had more opportunities to elevate conflicts and receive concessions. A neighboring, less affluent community did not get the portion of the transmission line traversing their community buried.
Diversity of actors and frames in high conflict-attention intensity cases (Hypothesis 2)
We expected that cases with higher conflict and attention intensities would be associated with a greater diversity of actors and frames. Figure 3 depicts the framing and number of statements as well as the number of actors, across the six selected cases, confirming this hypothesis. 8 The size of the box indicates the number of statements, and the percentage refers to the proportion of statements within a project (percentages add to 100 in a project). The numbers in parentheses are the number of actors with either a pro-transmission sentiment or anti-transmission sentiment. There is a positive association between a higher number of statements and the level of conflict-attention intensity. Regarding the percentage of anti-transmission sentiment, the first three projects have above 70%, while the other three projects have less than about 40%. Furthermore, in high conflict-attention intensity cases, transmission framing is more likely to be directly used in the anti-transmission argumentation (anti-transmission line sentiment %: Badger 30%, TRTP 23%). By contrast, in low conflict-attention intensity cases, transmission framing is more likely to be directly used in the pro-transmission argumentation (pro-transmission line sentiment %: Antelope 31%, Hitchland 55%).

Frames used within each case.
Table 4 indicates the diversity of actors by project and by actors’ sentiment toward transmission lines. As an indicator of diversity, actors’ organizational affiliations were categorized into one of the following six types: federal and state governments (Federal/State gov.), local governments (Local gov.), electric utilities or transmission companies (Industry), other for-profit entities (For-profit), nonprofit entities (Nonprofit), or the public (Public). 9 There is a positive association between the diversity of actors’ organizational affiliations and the level of conflict-attention intensity.
Proportion of actors within each case and sentiment.

Interview data also supported our findings for Hypothesis 2. Interviewees from high and medium conflict-attention intensity cases discussed a broader range of actor types when asked to describe who had been involved in the siting debate than did interviewees discussing a low conflict-attention intensity case. For example, interviewees from TRTP described a wide range of actor types, such as nonprofits and local governments, as being central to the siting debate. By contrast, interviewees from AVS described federal agencies and the industry as being central to the siting debate, with the participation of other actor types, such as townships and tribal governments, being more limited. Interestingly, while our news media coding did not indicate public actors involved in the AVS siting debate, all three interviewees said that there was public actor involvement through public hearing processes. According to the interviews, public actor participation for the AVS siting debate was largely non-contentious.
Varied manifestation of advocacy coalitions (Hypothesis 3)
We expected to find advocacy coalitions with varied manifestations dependent on the level of conflict-attention intensity. As illustrated in Figure 4, actors who made the most statements have the largest nodes, and actors who made the fewest statements have the smallest nodes. A thicker line indicates that two actors have nearly identical perspectives, while a thinner line means that they may share one perspective but diverge on other identified perspectives. From Figure 4, we find evidence of advocacy coalitions across levels of conflict and attention, confirming Hypothesis 3. In high conflict-attention intensity cases, two distinct coalitions are present. Actors in the anti-transmission line coalition made statements with an anti-transmission line sentiment. Actors in the pro-transmission coalition made statements with a pro-transmission line sentiment. In Prairie, a medium conflict-attention intensity case, one actor made both pro- and anti-transmission line statements. The pro-coalition is small in this case, while the anti-coalition is larger and more complex, with different combinations of perspectives used. By comparison, the Greentown case, another medium conflict-attention intensity case, has fewer total actors involved, approximately equal numbers of actors on both sides of the conflict, and no actors making both pro- and anti-transmission line statements. However, in the low conflict-attention intensity cases, our evidence of coalitions is minimal with very few actors involved. 10

Normalized actor congruence maps with coalitions.
As shown in Figure 4, non-aligned actors are rare, occurring only in high and medium conflict-attention intensity cases, and they are all government actors. Non-aligned actors made both pro- and anti-transmission line statements and do not clearly align with any coalition based on congruence measures. In high and medium conflict-attention intensity cases, there are more anti-transmission line actors than pro-transmission line actors. The actors who make the most statements and use the most diverse perspectives on the pro-transmission side of the debates tend to be associated with the industry. We find more variation in actors on the anti-transmission side, while either nonprofits or local government actors make the most statements and use more diverse perspectives. Higher variation of actor types with anti-transmission line perspectives was also apparent from the interviews.
Impermanence of policy conflict characteristics (Hypothesis 4)
We expected that conflict characteristics would vary within any single case. Figure 5, aggregating data yearly, shows how the number of statements has changed over the project development trajectory. Conflict characteristics can occur at any point in the project development. This finding underscores that project development, permitting, and construction can happen on widely varying timelines. In low and medium conflict-attention intensity cases, debate or news coverage mostly died off before construction began. Figure 5 confirms the conjecture that policy conflict characteristics vary over time, supporting the dynamics of conflict (e.g., escalation or de-escalation) covered in the theoretical arguments section.

Number of statements per year.
Conclusion
The literature on policy conflict renders little insight into the variation in and characteristics of policy conflict intensity, in part because existing research tends to focus on single cases with high levels of conflict. This article provides a baseline descriptive assessment of the distribution of conflict and attention around policy decisions by examining electricity transmission line siting cases in the U.S. We develop hypotheses based on the policy conflict literature and test them using discourse data from low, medium, and high conflict-attention intensity cases.
In confirming Hypotheses 1 through 4, we show more cases of low conflict-attention intensity in the siting of transmission lines than cases of high conflict-attention intensity. Additionally, we show that higher conflict-attention intensity cases include more actors and framing debates along with more engaged advocacy coalitions. Finally, findings reveal that policy conflict characteristics ebb and flow over time and are not contingent upon any common stage of project development.
This article contributes theoretically to the policy conflict literature in two ways. First, despite a penchant to focus on high conflict intensities that reinforce an image of predominately contentious politics, we show that a majority of decisions about transmission line siting involve low conflict. This suggests that policy conflict is not necessarily ubiquitous. Yet, the proportion of low conflict cases raises new questions. Most importantly, are political voices being suppressed by the powerful and, if so, how and to what extent? While our interviews point to this possibility, further research is needed to explore its regularity. Our findings are from approved transmission projects. If we were also to study non-approved projects, we might find a different distribution of conflict-attention intensity. However, whether or not we would find more cases of conflict is speculative, given that factors other than conflict may lead to project cancelation. 11 Furthermore, how such factors as community affluence (which represents a form of power disparity in political contests) contribute to the expression of conflict deserves more investigation in future studies. 12
Second, we find a correspondence between conflict-attention intensity, the number of actors and frames, and the presence of advocacy coalitions. This confirms the parallels of Schattschneider (1960) and other policy conflict scholarship (Baumgartner and Jones, 1993; Weible et al., 2020; Wolf and Van Dooren, 2018). However, this article offers something new by comparing a population of cases rather than focusing on a single case. It thereby shifts the focus of analysis from conflict in individual cases to conflict distribution across cases that vary from low to high conflict. This shift in focus raises additional new questions. How generalizable is the distribution of policy conflict intensity for transmission line cases to other infrastructure types? What explains the distribution found in this study? The next step is to explore the role of socioeconomic and political factors (e.g., population density, income, and partisanship) over different infrastructure types to determine the shape of their distributions across low to high conflict intensity cases.
In addition, this article provides a methodological contribution to the policy conflict literature. Researchers face trade-offs when choosing observation levels and data sources. Though the decision may be contingent upon the purpose of the study and available resources, researchers need to be aware of how their case studies fit in and contribute to the overall landscape of related researched topics. As we identified, the level of observation influences findings and, hence, the ability to capture more or less precise characteristics of policy conflict. With a coarser level of granularity at the population level, we gained an understanding of the distribution of 125 cases through indicators of conflict-attention intensity. Capturing more nuanced and fine-grained characteristics of conflict, however, is feasible when examining a sample of cases by looking at the details of the discursive debate.
Supplemental Material
sj-pdf-1-ppa-10.1177_09520767211036800 - Supplemental material for Comparing policy conflict on electricity transmission line sitings
Supplemental material, sj-pdf-1-ppa-10.1177_09520767211036800 for Comparing policy conflict on electricity transmission line sitings by Jongeun You, Jill Yordy, Christopher M Weible, Kyudong Park, Tanya Heikkila and Duncan Gilchrist in Public Policy and Administration
Footnotes
Declaration of conflicting interests
The author(s) declared no potential conflicts of interest with respect to the research, authorship, and/or publication of this article.
Funding
The author(s) disclosed receipt of the following financial support for research, authorship and/or publication of this article: This research was supported by the Alfred P. Sloan Foundation under Grant 2017-9920.

Supplemental material
Supplemental material for this article is available online.
Notes
References
Supplementary Material
Please find the following supplemental material available below.
For Open Access articles published under a Creative Commons License, all supplemental material carries the same license as the article it is associated with.
For non-Open Access articles published, all supplemental material carries a non-exclusive license, and permission requests for re-use of supplemental material or any part of supplemental material shall be sent directly to the copyright owner as specified in the copyright notice associated with the article.
