
Abstract
With recent advances in nanomaterials science, the development of nanocomposites has expanded to achieve materials with enhanced and tailored properties. Among them, metal-matrix nanocomposites reinforced with ceramic nanoparticles have attracted significant attention due to their improved mechanical and physical performance. Powder metallurgy is one of the most widely used methods for fabricating such materials, in which base metal powders are blended with nanoscale reinforcements and consolidated under controlled pressure and temperature. In this study, titanium was used as the matrix material, while alumina (Al2O3) nano-powder served as the reinforcement at 0, 5, and 10 wt%. Ti-Al2O3 nanocomposites were produced using both static and dynamic compaction methods. For dynamic compaction, the samples were subjected to impact velocities of 4.42, 6.26, and 7.66 m/s. Density measurements, scanning electron microscopy (SEM) observations of the microstructure and grain boundaries, compression tests, and hardness tests were performed to evaluate the material properties. The mechanical and microstructural properties were then analyzed and compared. The results show that the highest density was obtained in the sample containing 5 wt% Al2O3 nano-powder dynamically compacted at 7.66 m/s. Microstructural observations indicate that, at constant compaction pressure, increasing the reinforcement content initially reduces porosity but increases it at higher nanoparticle concentrations. Hardness measurements under static compaction reveal that hardness increases with increasing compaction speed. Moreover, hardness increases with reinforcement addition up to 5 wt% but decreases at higher contents, a trend also observed in dynamically compacted samples. The addition of 5 wt% Al2O3 nano-powder increased the compressive strength by 56%.
Introduction
Titanium, magnesium and aluminum alloys are among the most widely used metals in these modern industries. The addition of alloying elements or reinforcing particles can significantly enhance their properties and compensate for the inherent limitations of these alloys. In particular, incorporating different weight percentages of nanoparticles into a metal matrix can improve various mechanical and physical properties depending on the intended application. The low weight of such nanocomposites is one of the main reasons for their extensive use in various industries, especially in the automotive and aerospace sectors, where weight reduction remains a key technological objective. Consequently, considerable research has been devoted to the development and characterization of these materials. Moongkhamklang et al.
1
reported that materials used in transportation, aerospace, medical, and electronic applications must exhibit a high strength-to-weight ratio, adequate fracture toughness, a high fatigue limit, and sufficient ductility. Their study indicated that titanium and aluminum alloys possess many of these desirable characteristics. However, in their pure forms these metals do not provide sufficient strength for many practical applications. Feng et al.
2
investigated the evolution of damage in titanium alloys during hot deformation processes. Seçgin and Özsert
3
applied the roller blank holder method to optimize titanium forming, demonstrating its strong potential for improving forming processes. Iyakutti et al.
4
examined phase transitions and superconductivity in titanium, while Qu et al.
5
analyzed thermal residual stresses in continuous SiC fiber-reinforced titanium matrix composites. Habibnejad-Korayem et al.
6
incorporated 0.5, 1 and 2 wt.% of alumina nano-particles into pure Mg and AZ31 magnesium alloy using a stir-casting method. Their results showed grain refinement in the cast materials and a reduction in the coefficient of thermal expansion (CTE), which improved the dimensional stability of both pure magnesium and AZ31 alloy. The coarse columnar grain structure of pure Mg gradually transformed into a fine equiaxed structure as the nanoparticle content increased to 2 wt%. SEM micrographs of the Mg-2Al2O3 composite also revealed a relatively uniform distribution of nanoparticles within the matrix. In another study, Javadi et al.
7
proposed an effective manufacturing approach for producing aluminum (Al) and magnesium (Mg) nanocomposite microparticles reinforced with densely packed titanium diboride and titanium carbide nanoparticles. Using a flux-assisted solidification process, up to 30 vol% of nanoparticles were successfully self-incorporated and uniformly dispersed within the Al and Mg microparticles.
Metal matrix composites reinforced by nano-particles represent a promising class of materials for a wide range of applications. These composites consist of a metal matrix embedded with nanoparticles whose physical and mechanical properties differ significantly from those of the matrix material. 8
Ozkaya and Canakci
9
produced the AlCuMg-B4C nanocomposites reinforced with the B4C particles using the mechanical milling followed by hot pressing. Their results showed that the hardness of the hot-pressed nanocomposites was significantly higher than that of similar materials produced by conventional powder metallurgy. The AlCuMg-10 wt% of B4C nanocomposites fabricated with milling time of 6 h exhibited the highest tensile strength of 332 MPa. Cabeza et al.
10
investigated the effect of high energy ball milling on the morphology, microstructure and properties of nano-sized TiC particle-reinforced 6005A aluminum alloy matrix composite and reported their experimental findings accordingly. Ponraj et al.
11
prepared Copper (Cu)/graphene nanosheet (GNS) composites by using the powder metallurgy technique. The microstructure and the mechanical properties were characterized using Fourier transform infrared spectroscopy (FTIR), X-ray diffraction (XRD), High resolution Scanning Electron Microscopy (SEM) and Transmission Electron Microscopy (TEM). Nassar and Nassar
12
studied the properties of aluminum matrix nanocomposites fabricated through powder metallurgy processing. Measurements of tensile strength, hardness, and density indicated that increasing the volume fraction of nanoparticles led to higher porosity and tensile strength of the composites, while the ductility of aluminum decreased.
Extensive research has demonstrated that nanocomposites produced through powder compaction offer several advantages. As reviewed by Groza, 13 nano-powders are thermodynamically unstable due to their extremely high surface-area-to-volume ratio. The tendency to reduce this excessive surface energy provides the primary driving force for the sintering process. Several review articles have addressed various aspects of titanium and its related challenges.14–16 In addition, the mechanical behavior of nanocrystalline materials has been the subject of numerous studies and comprehensive reviews.17,18
A notable distinction between nanocrystalline and coarse-grained materials lies in their high-temperature mechanical behavior. While the creep behavior of coarse-grained materials has been extensively investigated over the past four decades,19–22 nanocrystalline materials exhibit different deformation mechanisms due to their refined grain structure. Moreover, nanocomposites reinforced with nano-powders generally demonstrate enhanced hardness as well as improved tensile and compressive strengths.
Abdullah Hasan Karabacak et al. 23 prepared aluminum metal-matrix nanocomposites reinforced with SiC and B4C at different reinforcement ratios (0 –4 wt%) using the powder metallurgy method. The main objective of their study was to investigate the effects of reinforcement type and content on the machinability of metal-matrix nanocomposites using different machining processes, including wire electrical discharge machining (WEDM) and CNC milling. The surface morphology of the samples was examined before and after machining using scanning electron microscopy (SEM), while the chemical composition and phase analysis were characterized by energy-dispersive X-ray spectroscopy (EDX) and X-ray diffraction (XRD).
The surface hardness, roughness, and metal removal rate (MRR) before and after machining were evaluated to determine the effect of machining process on the samples. surfaces. According to their results, the hardness of the nanocomposites containing 4% 4 wt% B4C (195.6 HB) increased by approximately 90% compared to that of the pure Al2024 alloy (101.6 HB). However, after both machining processes, the hardness values of all nanocomposites decreased. In addition, the tensile strength values of the nanocomposites containing 2% B4C and SiC by weight are 392.8 and 377.7 MPa, respectively, while the tensile strength value of the pure Al2024 alloy is 201.7 MPa. After machining, the MRR values decreased with increasing reinforcement content, while the SR values were reduced.
Çalıgülü et al. 24 investigated the microstructures, mechanical properties, impact strength and corrosion behavior of AA2024 matrix hybrid composites reinforced with Al2O3 and SiC, produced by the powder metallurgy method Powder mixtures of AA2024/Al2O3-SiC with different reinforcement ratios were sintered at 560°C for 120 min and then compacted under a pressure of 500 MPa. The produced samples were characterized through microstructural and mechanical analyses, including microhardness, density, tensile, corrosion, and free-drop tests, supported by SEM, EDS, and XRD examinations. Their results indicated that the best tensile performance of AA2024/Al2O3-SiC hybrid composites was obtained for samples containing 2% reinforcement, while hardness increased with increasing reinforcement ratio.
Zihni Alp Çevik et al. 25 investigated AA2024-based hybrid nanocomposites reinforced with different weight percentages of SiC and B4C particles to evaluate their physical properties and machinability characteristics, including surface morphology. They compared the material removal rate (MRR) and surface roughness (SR) of the nanocomposites processed using abrasive water jet (AWJ) machining, wire electrical discharge machining (WEDM), and CNC turning. The machined surfaces produced by each method were examined and their surface quality was discussed for each hybrid nanocomposite. The results showed that the hardness increased from 101.6 BHN to 179.4 BHN when 2 wt% of B4C and SiC particles were added to the AA2024 matrix. It was also observed that the addition of 2 wt% reinforcement produced the highest porosity value of 3.36% in the nanocomposite samples. Furthermore, the experimental results indicated that the addition of reinforcement particles reduced the MRR while increasing SR. Among the investigated machining processes, AWJ machining produced the lowest MRR value of 0.0221 mm3/min for the hybrid nanocomposites.
In this study, Ti-Al2O3 nanocomposites were fabricated using static and dynamic compaction methods. Alumina nano-powder was added as a reinforcement to the titanium base metal powder, and after achieving a homogeneous powder mixture, the samples were sintered in a thermal furnace. The specimens were prepared with three different alumina contents of 0, 5, and 10 wt% and were consolidated under the 125 Mpa static pressures as well as three different dynamic compaction conditions. The effects of compaction pressure and alumina content on the mechanical properties of the fabricated samples were investigated. Hardness tests, compressive strength tests, and microstructural examinations were performed to evaluate the properties of the produced nanocomposites.
Sample preparation method
The raw materials used in this study consisted of titanium powder with a particle size of less than 45 μm and alumina (Al2O3) nano-powder with an average particle size of approximately 20 nm. The properties of the titanium powder used in this research can be found in the Appendix (Table A1). A milling process was employed to refine the titanium powder and incorporate the nano-alumina reinforcement along with a stearic-acid lubricant. A planetary ball mill was used to prepare three titanium-based powder mixtures containing 0%, 5%, and 10 wt% alumina nanoparticles. To achieve a uniform and homogeneous blend, a centrifugal mixing machine was also utilized.
Each milling chamber had a capacity of 50 g. Steel balls (at 10 times the weight of the powder) were loaded into each chamber. After adding the powders and milling media, the chamber was sealed, and argon gas was introduced to create an inert atmosphere. Once the internal air was purged, the outlet valve was closed after approximately 3 s. Milling was carried out at 300 rpm for 1 h. Scanning electron microscopy (SEM) was employed to verify the uniform distribution of nanoparticles within the titanium matrix and to observe the resulting powder morphology. Figure 1 presents SEM images of the milled titanium powder for all three nanoparticle concentrations. As shown, the powders exhibit a variety of morphologies, including spherical, needle-like, cylindrical, flake-like, and irregular particle shapes.
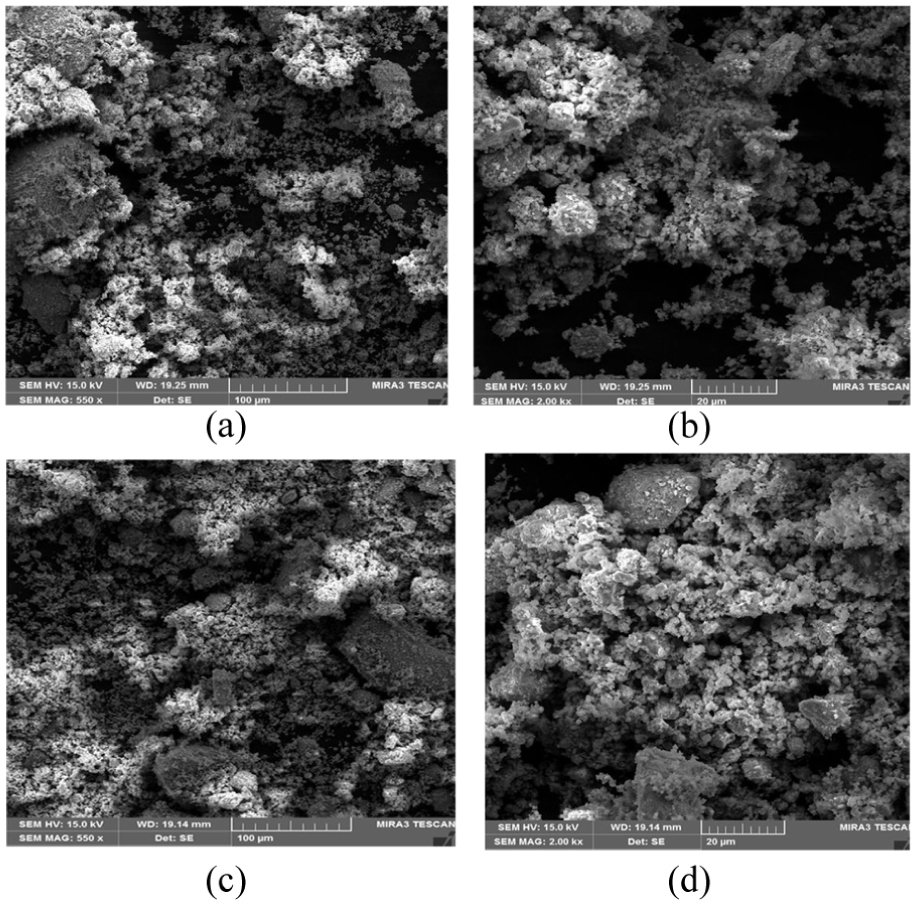
Scanning electron microscope images: (a) titanium powder with 5% alumina nano powder and a scale of 550X, (b) titanium powder with 5% alumina nano powder and scale 2000X, (c) titanium powder with 10% nano powder and scale of 550X and (d) titanium powder with 10% aluminum oxide nano powder with scale of 2000X.
After achieving a uniform and homogeneous powder mixture, the nanocomposite samples were fabricated using two consolidation methods: static compaction and dynamic compaction.
Dynamic fabrication method of samples
In the dynamic compaction method, the powder mixture is consolidated inside a die through high-energy impact loading. For this purpose, a specially designed and hardened mold was employed to withstand the intense forces generated during dynamic compression. The mold, fabricated from Ck-45 steel, is shown in Figure 2(a).
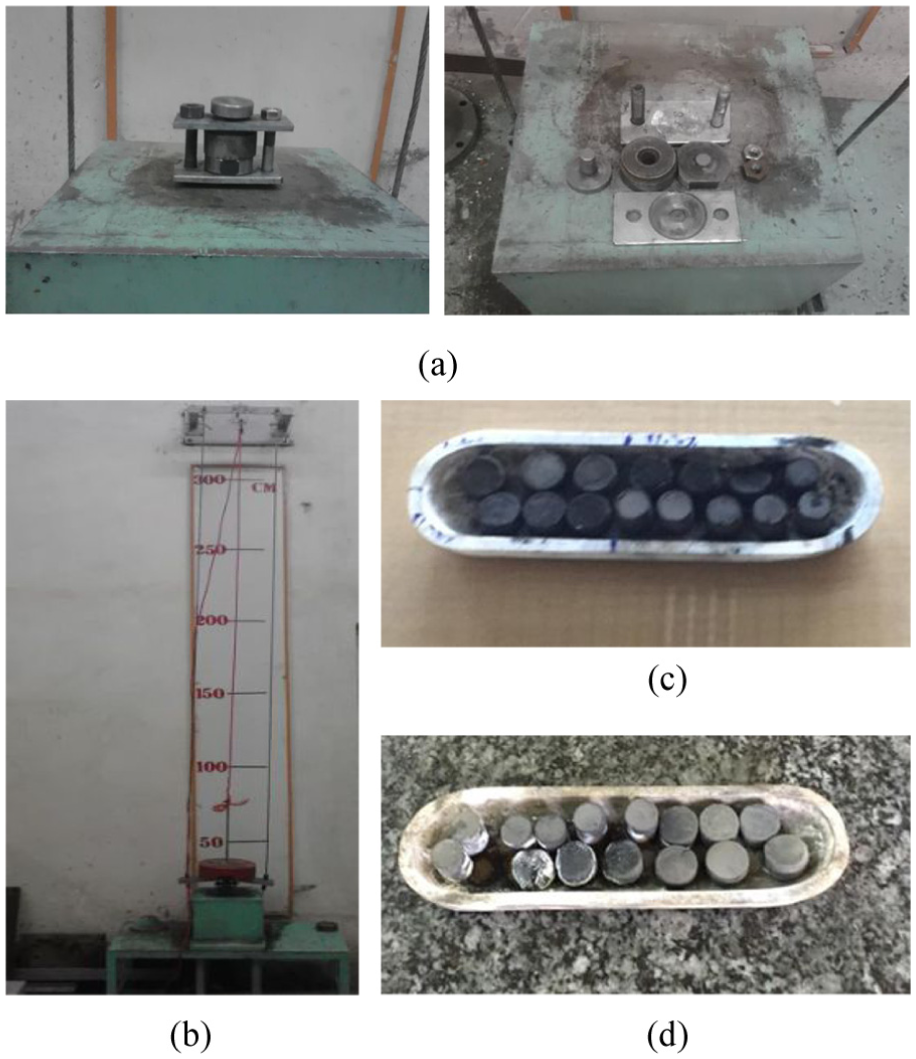
(a) The hardened mold is used for dynamic compression and the assembled and clamped mold, (b) impact testing device, samples of produced tablets, (c) before sintering and (d) after sintering.
The weight-drop method was used to generate the dynamic compaction force. In this technique, a predetermined mass is released from a specific height, creating a high-velocity impact on the mold and compressing the powder contained within it. The dynamic impact device employed for this purpose is shown in Figure 2(b). For the tests, a 25 -kg weight was dropped onto the mold from three different heights (1, 2, and 3 m) corresponding to strain rates of 2.94, 4.17, and 5.10 s−1, respectively. The compacted specimens produced by this method were cylindrical disks with a radius of 6.7 mm and a height of 14 mm. A schematic representation and the dimensional details of the dynamically fabricated samples are provided in the Appendix (Figure A1). All dynamic compaction experiments were conducted at an ambient temperature of 22°C. The schematic representation of the dynamic compression mold is also presented in the Figure 3. As illustrated, the mold assembly consists of three main components, which are shown in the corresponding figure.
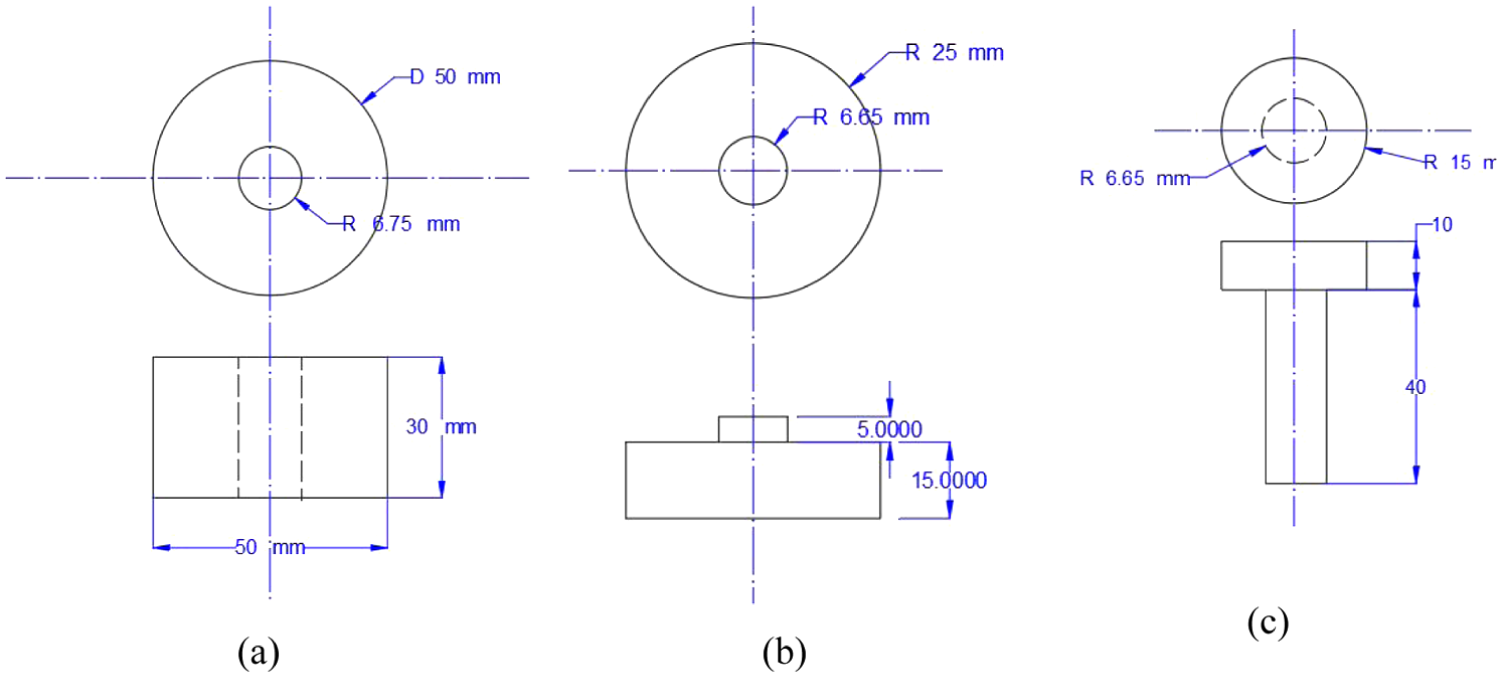
Schematic of three parts of compression mold: (a) main part, (b) the lower part of the mold and (c) mold mandrel.
As shown in Figure 3, the mold consists of three main components. The central part is the main body, which contains the cavity where the powder is placed. The lower part is positioned beneath the main body, and its protruding section fits into the cavity of the mold to prevent the powder from escaping. The upper component, known as the mandrel, is inserted into the main cavity to apply pressure during compaction.
Static method of sample fabrication
In the static compaction method, a dedicated mold was also designed and fabricated. After assembling the mold components, the inner wall of the mold, the mandrel, and the upper surface of the step were lubricated to facilitate easy removal of the sample after pressing. The prepared powder mixture was then gradually poured into the mold using a funnel.
Subsequently, a compressive load was applied to the mold mandrel using a 1-ton hydraulic press. This load generated a pressure of approximately 125 MPa on the powder samples, leading to their compaction. The schematic diagram of the static compression mold, along with its principal dimensions, is presented in the Appendix (Figure A2). After static compaction and the formation of green compacts, the samples were subjected to a sintering process to achieve a fully consolidated structure. Since sintering is typically performed at 70%–80% of the melting temperature of the base metal, and the melting point of titanium is 1665°C, the furnace temperature was set to 1200°C. To prevent oxidation during heating, argon gas was continuously introduced into the furnace to maintain an inert atmosphere. Once the samples reached the target temperature, they were held at 1200°C for 1 h. Subsequently, the furnace was allowed to cool gradually to ambient temperature under controlled conditions. After cooling to room temperature, the sintered samples were removed from the furnace. This stage produced two cylindrical specimens (radius: 5 mm; height: 12 mm) for each of the three specified reinforcement percentages, resulting in a total of six statically compacted samples. In addition, nine specimens were fabricated using the dynamic compaction method. Therefore, a total of 15 samples were prepared in this study. The furnace used for sintering is presented in Figure 4(a).
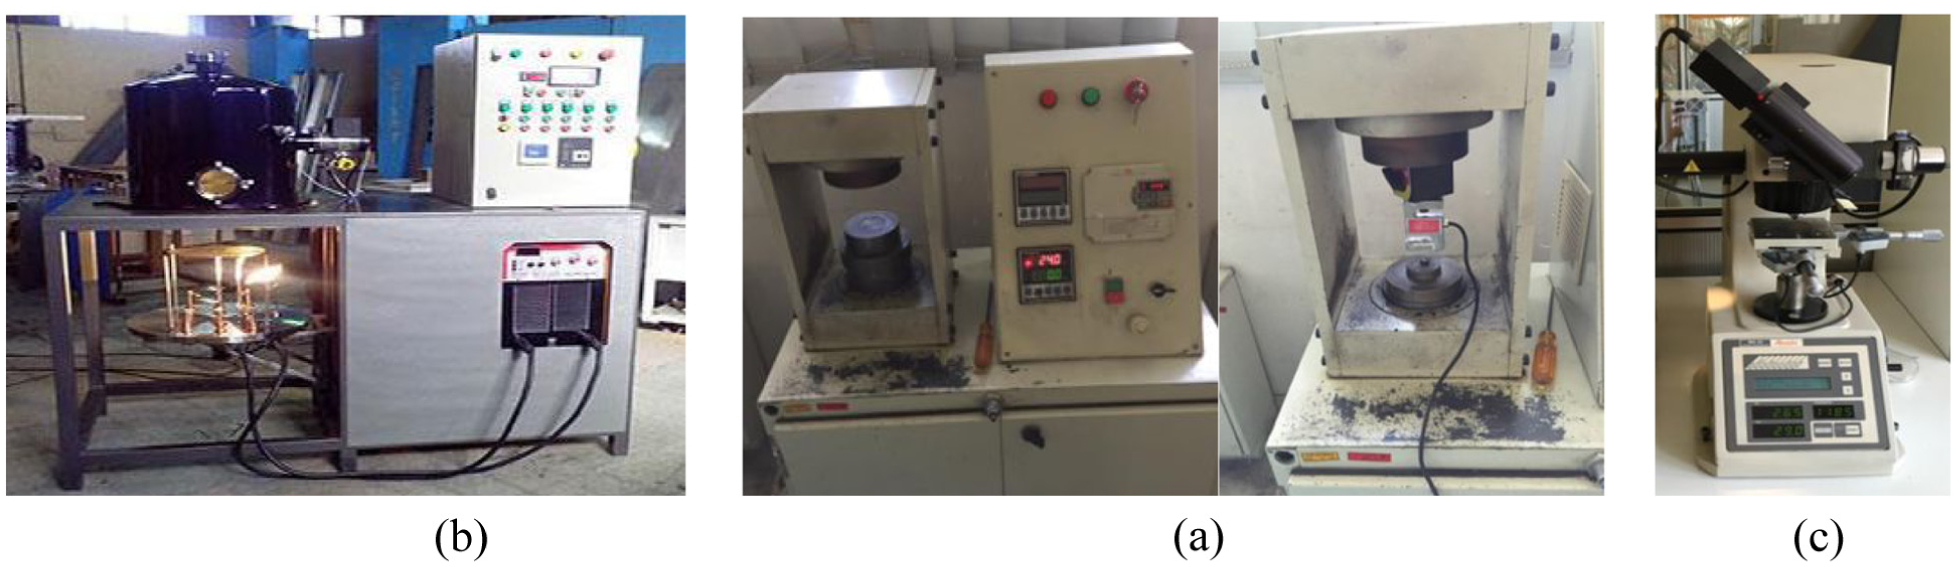
(a) Furnace used for sintering operation (argon gas furnace), (b) pressure testing device and (c) hardness testing machine.
Mechanical characterization
In this study, several experiments were carried out to evaluate the mechanical properties of the fabricated samples, including porosity, hardness, and compressive behavior. In addition, the microstructures of the specimens under different conditions were examined using scanning electron microscopy (SEM). The procedures used for these experimental evaluations are described in the following sections.
Density measurement
One of the common methods for determining density and compaction percentage is based on Archimedes’ principle, in which the immersion weight is measured to calculate the sample volume. In this study, distilled water with a purity of 99.9% was used as the immersion medium. First, a container filled with distilled water was placed on a digital balance and the scale was zeroed. Each sample was then tied with a thin wire and immersed completely in the water using a clamp. To ensure that all open pores were filled with fluid, the specimens were kept immersed in distilled water for approximately 24 h. The reading displayed on the balance during full immersion corresponds to the displaced water mass, which is equal to the sample volume. After immersion, the samples were removed and placed in a separate container. Their submerged weight was measured using a precision digital balance equipped with a hook and thin wire. The balance was zeroed with the water-filled container in place, and each specimen was suspended in the water to record its immersed weight. Subsequently, the samples were gently wiped with a soft cloth and weighed to determine their wet weight. The specimens were then dried in a heater for 1 h. After confirming complete drying, the dry weight of each sample was measured using the digital balance. Finally, the density, porosity, water absorption ratio and density percentage of the samples were calculated using the following relationships:


Determination of compressive strength
A universal compression testing machine was used to evaluate the compressive strength of the fabricated samples. The testing machine, shown in Figure 4(b), was manufactured by Santam Company (model STM-20) with a load capacity of 2 tons. The test speed was set to 50 mm/min. During the test, each sample was positioned securely between two jaws of the machine. The upper jaw then moved downward, applying a compressive load to the specimen. Throughout the test, the applied force and displacement were continuously recorded by the machine, and the corresponding force–displacement and stress–strain curves were generated.
Hardness test
In this study, the Vickers hardness method was used to determine the hardness of the fabricated samples using a digital microhardness tester. To improve measurement accuracy, hardness measurements were taken at three different locations on each compacted sample, and the average value was reported. Figure 4(c) shows the microhardness testing device used in this study. During the test, an indentation was produced on the sample surface by applying a load of 0.5 kgf. The device then automatically calculated the Vickers hardness value based on the dimensions of the indentation and displayed the result on its digital screen. The hardness measurements were performed using an Akashi MVK-G1 Digital Micro-Hardness Tester.
Discussion and experimental results
Density results
Dynamic mode
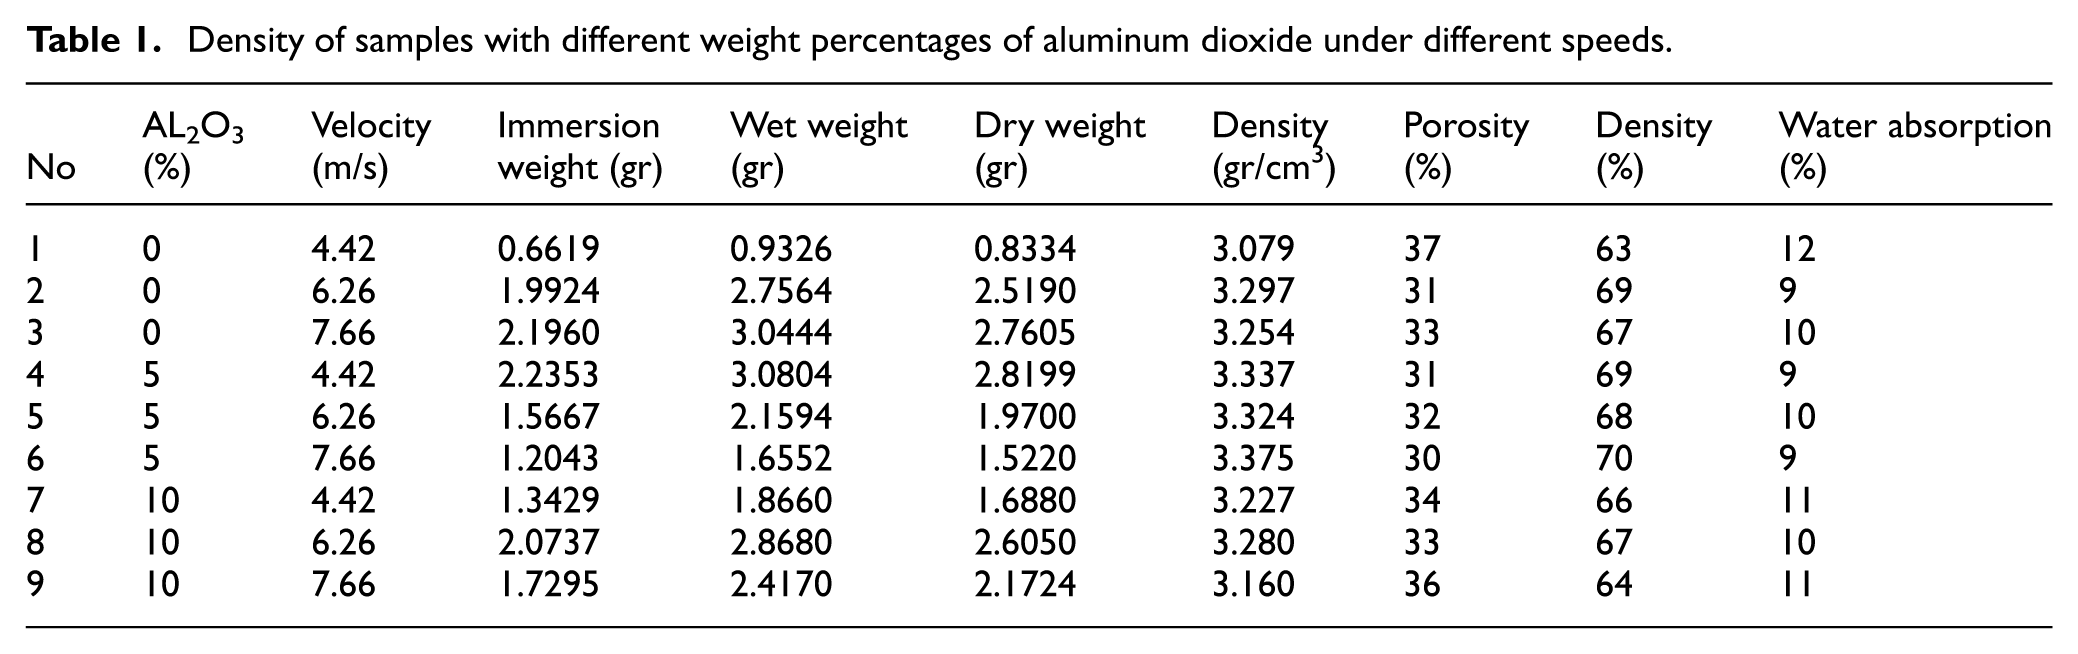
The density results of the samples compacted using the dynamic method are presented in Table 1. The corresponding density percentages are illustrated in Figure 5. Indeed, Figure 5 shows the relative density of the samples, where the vertical axis represents the relative density and the horizontal axis corresponds to the sample types.
Density of samples with different weight percentages of aluminum dioxide under different speeds.
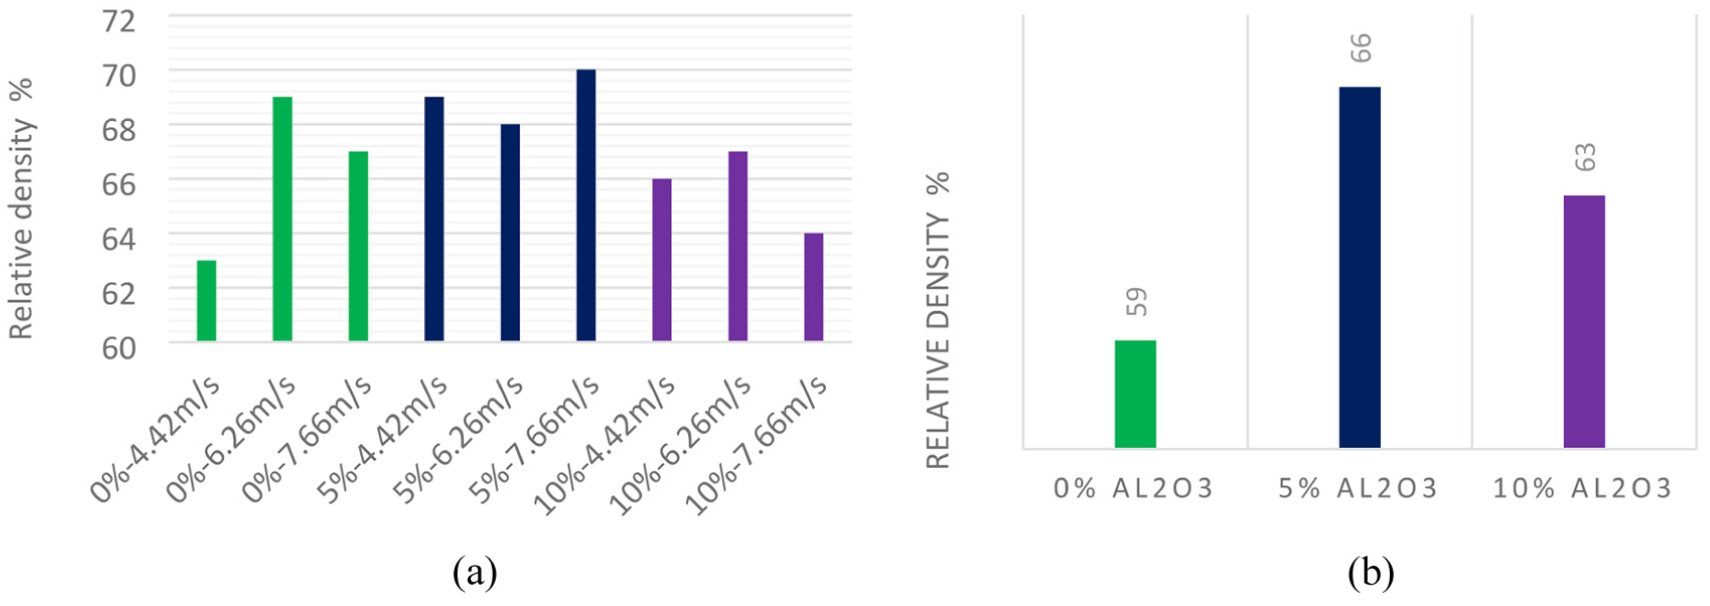
(a) Density percentages of dynamic compressed samples and (b) density percentages of statically compressed samples. relative density.
From the graphs, it can be observed that the applied compaction pressure was adequate, resulting in a satisfactory densification level close to that of the reference sample. As expected, for a constant reinforcement content, increasing the compaction pressure led to higher densification and lower porosity. It is also evident that increasing the weight percentage of the nanomaterial did not produce a significant increase in density. This may be attributed to the fact that finer particles are generally more difficult to compact. In addition, the base powder particles can bond more easily with one another, whereas the presence of nanoparticles between them may hinder the local bonding and rearrangement of the matrix particles during compaction. According to the graphs, the highest density was obtained for the sample containing 5 wt.% nano-powder compacted at a speed of 7.66 m/s, while the lowest density corresponded to the sample without reinforcement compacted at the minimum impact speed.
Static compaction
Table 2 presents the characteristics obtained from the samples compacted using the static method.
Density of statically compacted samples with weight percentage of additive.
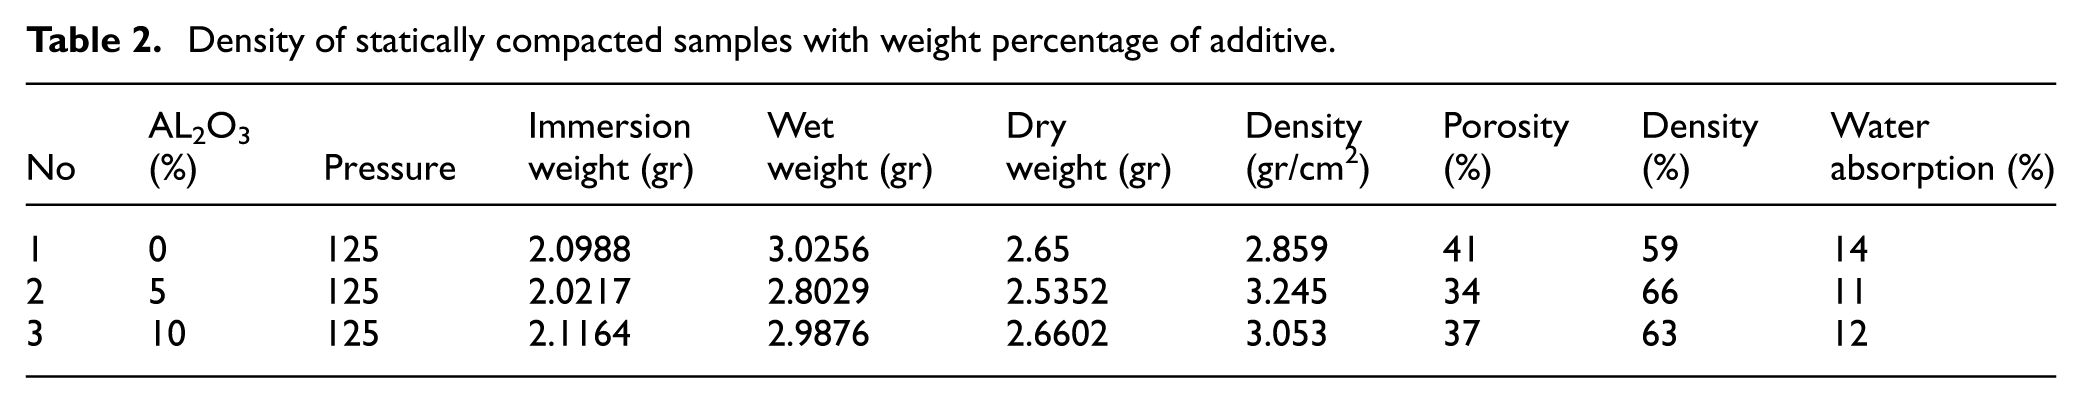
By comparing the graphs presented in Figure 5(b) and the density values listed in the corresponding tables, several important observations can be made. The results indicate that the powder mixture was properly compacted and that the obtained density values are acceptable. At a constant compaction pressure, increasing the percentage of nanomaterial initially led to an increase in density, followed by a decrease at higher reinforcement content. The reason for this behavior is similar to that explained in the dynamic compaction section. The highest density was obtained for the sample containing 5 wt.% additive, while the lowest density corresponded to the unreinforced material. Although the addition of 10 wt.% nano-powder increases the density compared with the sample without reinforcement, the increase is smaller than that observed for the 5 wt.% additive. This behavior is commonly observed in metal matrix composites, where improvements in properties occur up to an optimal reinforcement content and then decrease with further addition.
An interesting aspect of the results is the comparison between static and dynamic compaction. Figure 6 presents a comparison of the densities obtained at three different dynamic impact speeds with those achieved under static pressure for three different percentages of aluminum oxide reinforcement. In this figure, the relative density is plotted on the vertical axis, while the different sample types are shown on the horizontal axis.
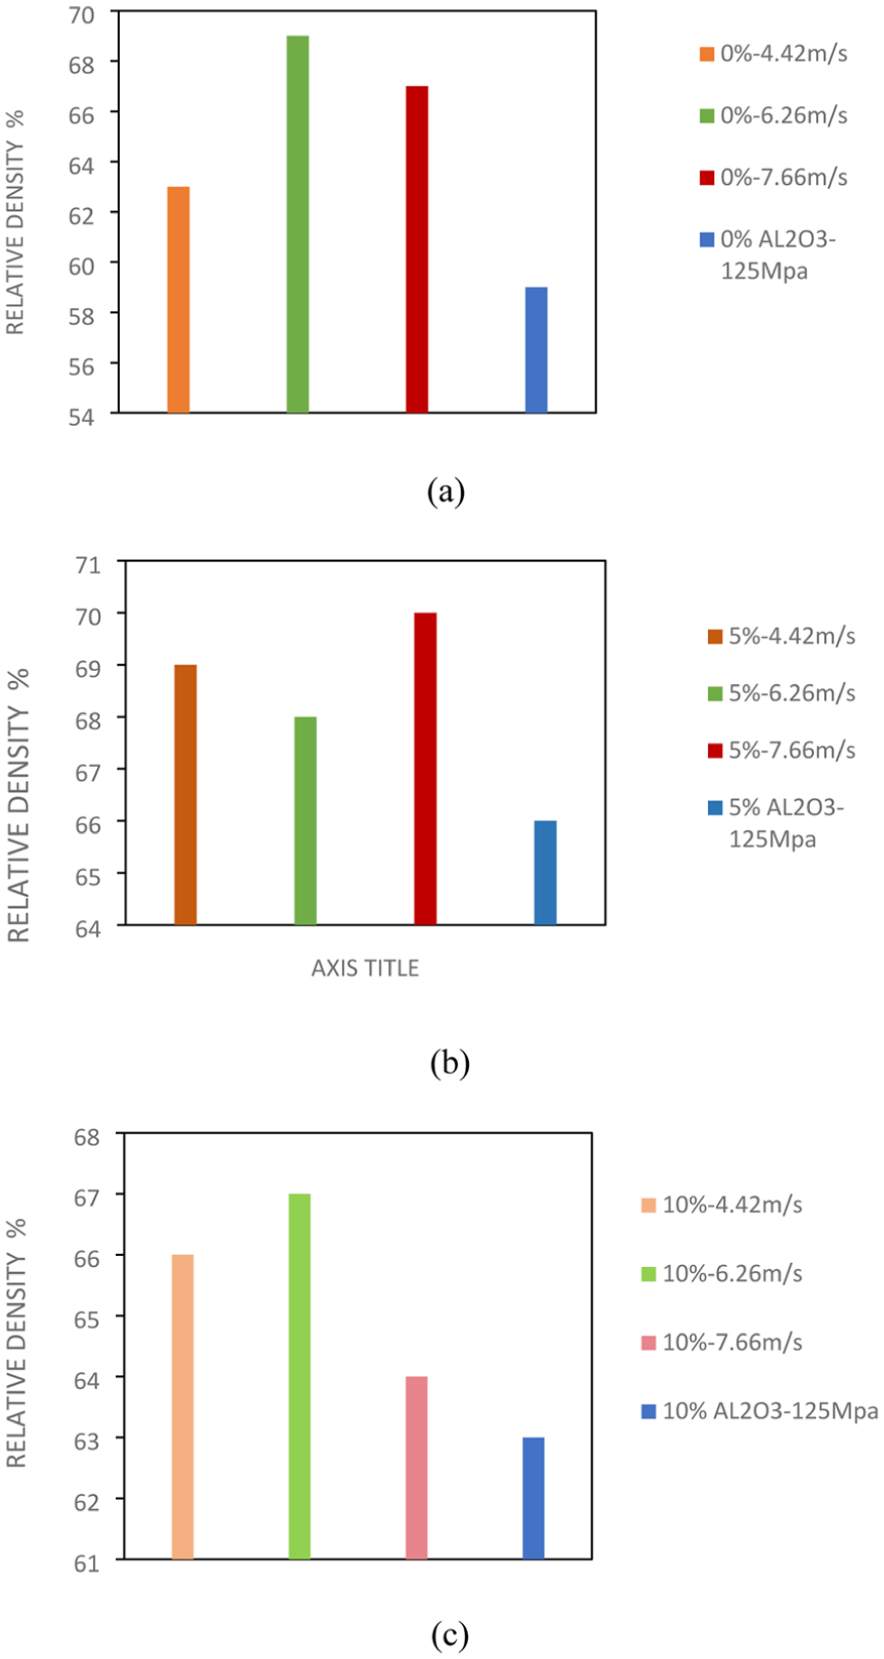
Comparison of the percentage compaction of samples at different dynamic speeds and corresponding static pressure for (a) 0%, (b) 5% and (c) 10% alumina dioxide.
The results indicate that the dynamic compaction method leads to higher density and lower porosity compared with the static compaction method. By comparing all samples produced under static and dynamic pressures, it can be observed that the highest relative density was achieved in the dynamically compacted sample containing 5 wt.% additive at an impact speed of 7.66 m/s, with a relative density of approximately 70%.
Granulation and microstructure results
Dynamic and static compression state
Figure 7 shows the microscopic image of titanium samples produced with different percentages of reinforcement of reinforcement and subjected to various dynamic compaction speeds. The images were taken at a magnification of 300×.
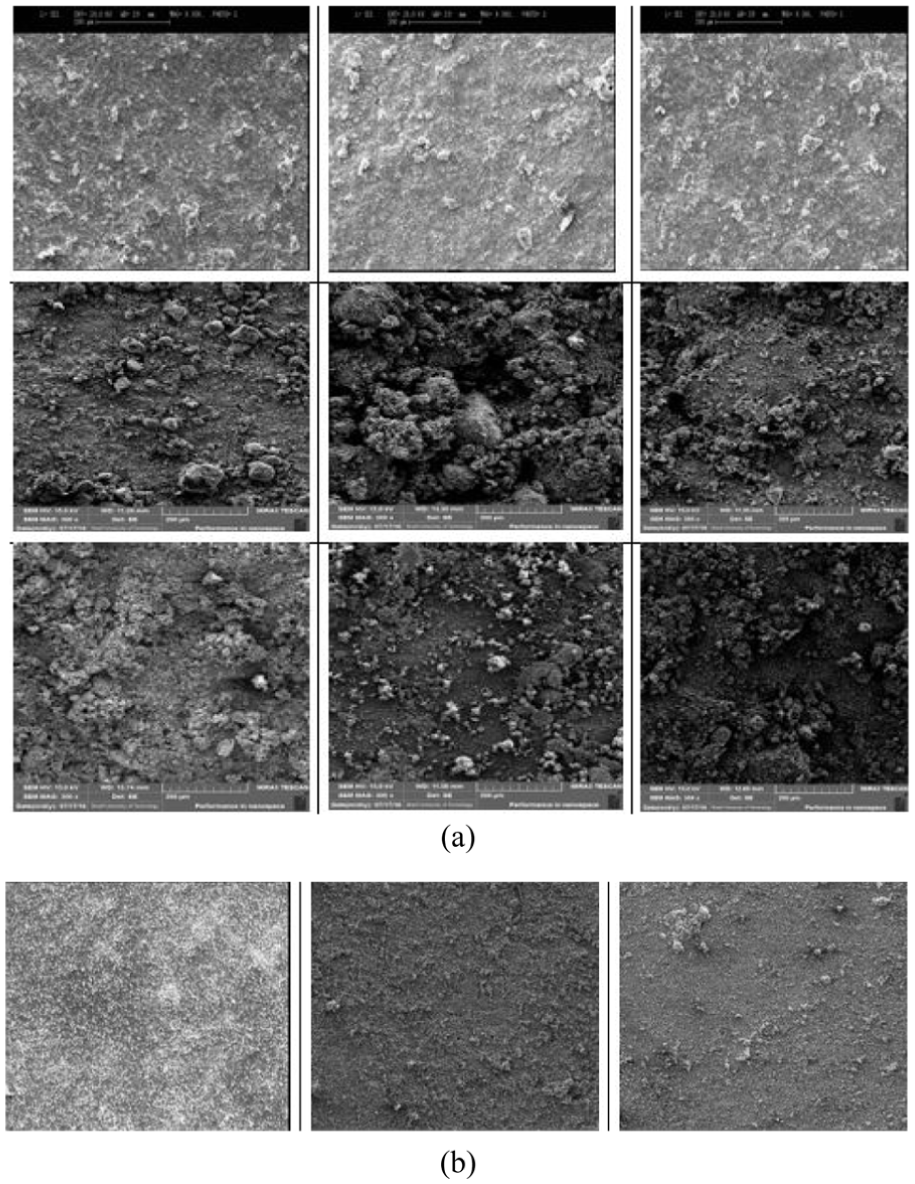
(a) Granulation and density of samples with triple additives and at different dynamic speeds (the top row corresponds to 0% additive and increasing dynamic speed from left to right. The next rows show 5% and 10% additive, respectively) all with scale of 300X and (b) grain size and density of samples with triple additives 0%, 5% and 10% from left to right respectively, with scale of 300X.
From the microstructural images, it can be observed that the overall porosity is very low and the grain boundaries are clearly distinguishable. In these images, the bright regions correspond to the nano-reinforcement particles, while the darker regions represent the titanium grains. Figure 7(b) shows the micrographs of the samples compacted under static conditions. Comparison of the static-compacted samples indicates that their grain boundaries are well defined. As the amount of additive increases under the same compaction pressure, the porosity initially decreases and then increases at higher reinforcement contents. This trend is evident from the distribution of dark, pore-like regions in the images. The addition of nano-powder fills some of these voids due to its very small particle size, resulting in a reduction of dark (empty) areas and a generally brighter microstructure. However, excessive nanoparticle content can disrupt proper packing and bonding of the matrix grains, causing porosity to increase again.
Hardness test results
The hardness test results are presented in the Appendix (Table A2). Figure 8(a) illustrates the hardness of the samples compacted using the dynamic method and the average value. In this graph, the Vickers hardness (kgf/mm2) is shown on the vertical axis, while the different sample types are represented on the horizontal axis.
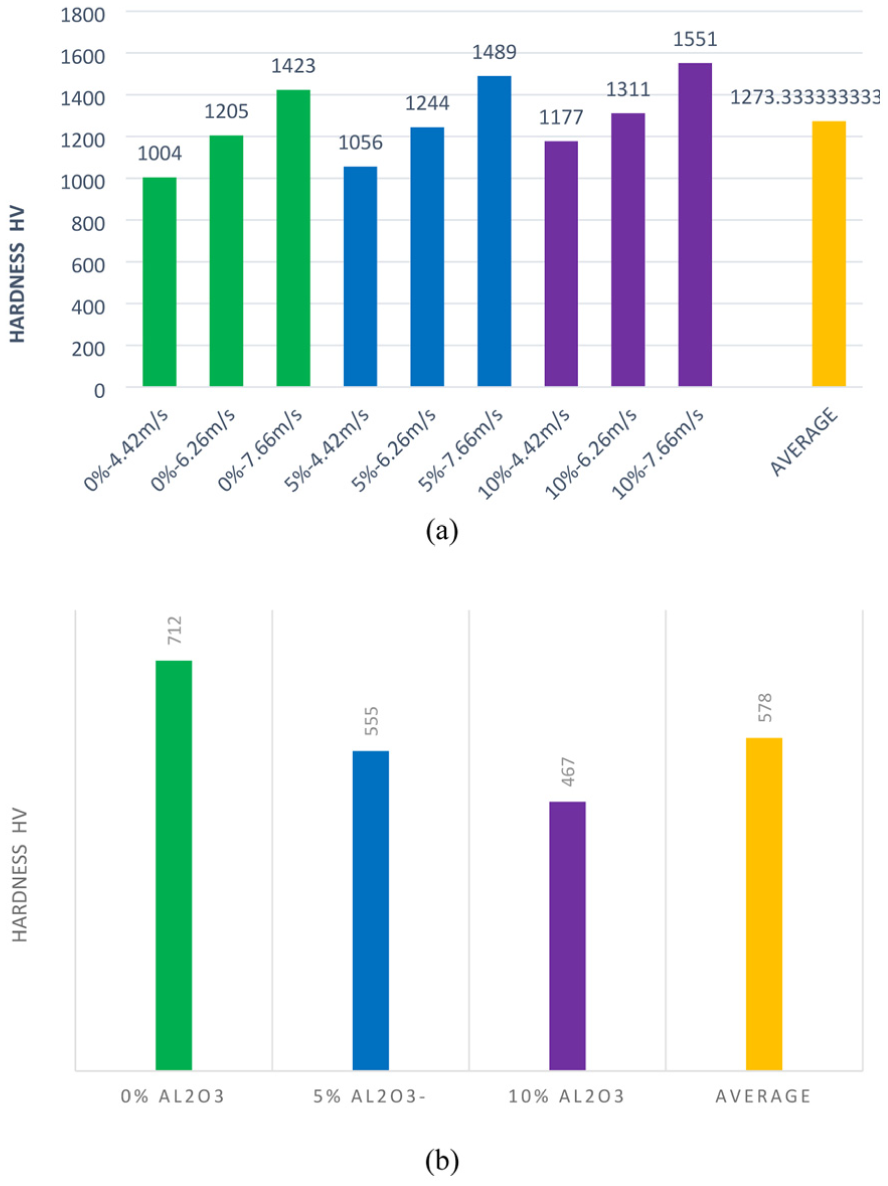
(a) Average hardness of samples obtained from dynamic compression with different weight percentages and different speeds and (b) hardness test results of statically compressed samples.
Additionally, the hardness test results for the samples compacted under static conditions are presented in the Table A3 in the Appendix. The results clearly show that the hardness increases with increasing compaction speed in the dynamic method. In addition, the hardness rises as the percentage of added nanoparticles increases. According to the data, the highest hardness value (1446 HV) was obtained for the nanocomposite sample containing 10 wt.% Al2O3 compacted at the maximum dynamic speed. In contrast, the lowest hardness value (467.5 HV) was recorded for the sample with 10 wt.% Al2O3 compacted under static conditions. The results of this experiment are presented in Figure 8(b). The findings indicate that static compaction is not suitable for increasing hardness. Furthermore, in the dynamic method, the hardness increases with increasing additive wt.%.
Pressure test
Dynamic compression
In the pressure test, the maximum collapse force of the samples was measured. The obtained results are summarized in Table A4 in the Appendix.
The corresponding results are also illustrated in Figure 9. In this diagram, the vertical axis represents the collapse force (in Newtons), while the horizontal axis shows the samples compacted at different speeds and containing various weight percentages of nano-powder.
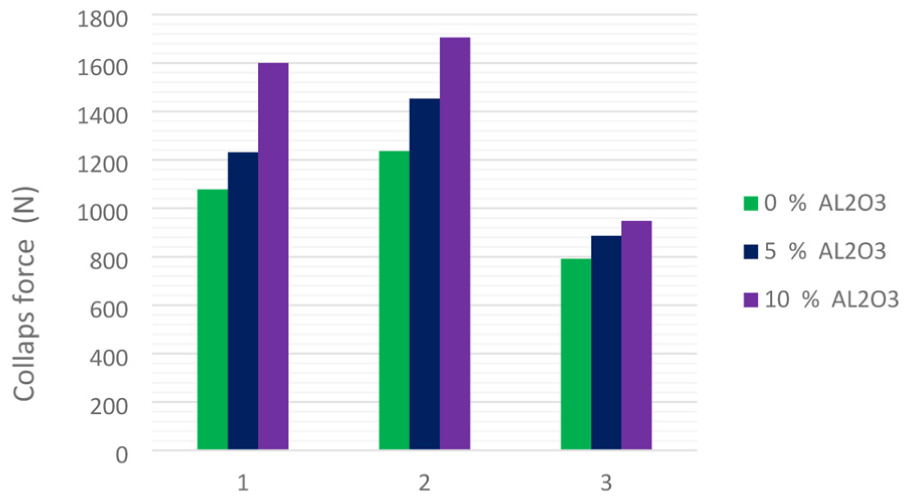
The collapse force versus dynamically Samples compressed at different speeds and different wt.%- v = 4.42, v = 6.26, and v = 7.66 m/s from left to right.
It can be observed that with increasing compaction speed, the collapse force increases, indicating an improvement in the strength of the samples. In addition, the addition of Al2O3 up to 5 wt.% leads to an increase in strength in all three cases. However, when the additive content exceeds 5 wt.%, the presence of nanomaterial results in a reduction in strength compared with pure Ti. Previous studies on metal-matrix nanocomposites reinforced with ceramic nanoparticles have also typically investigated additive contents below 4 wt.%.23,25 According to the obtained results, the sample containing 5 wt.% Al2O3 compacted at a speed of 7.66 m/s exhibited the highest strength, reaching 1717 N.
Static compression
The compressive strength of the samples produced using static pressure is illustrated in Figure A3 in the Appendix. In addition, the collapse force results for the samples compacted under static conditions are presented in Table A5 in the Appendix. In this case, it can also be observed that the compressive strength increases with the addition of nanoparticles up to 5 wt.% and then decreases with further addition. In other words, adding 10 wt.% nano-powder reduces the collapse force even compared with pure titanium. The addition of 5 wt.% nano-powder increases the compressive strength by approximately 56%, which represents a significant improvement. However, further addition of nano-powder not only fails to enhance the compressive strength but also leads to a considerable reduction. The maximum strength was obtained for the nanocomposite containing 5 wt.% additive, compacted using the dynamic method at an impact velocity of 6.26 m/s. Since the cross-sectional areas of the samples produced by the dynamic and static methods were different, it was necessary to compare their ultimate stresses. These values are presented in Figure 10(a) and (b) for all samples.
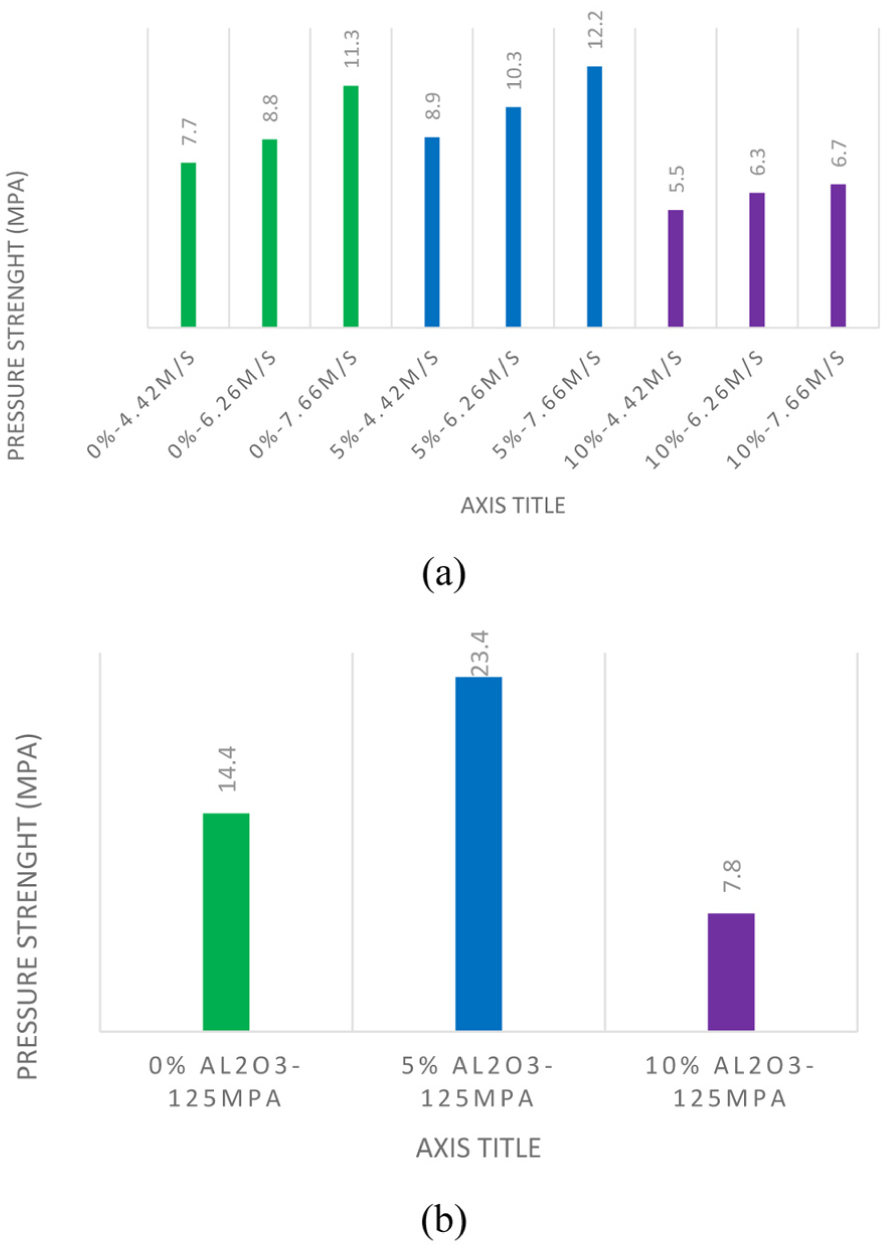
(a) The pressure strength of samples with different wt.% and speed in dynamic method and (b) the pressure strength of samples with different wt.% in dynamic method.
The results indicate that the sample containing 5 wt.% Al2O3 particles, compacted using the static method, exhibited the highest compressive strength of 23.4 MPa, representing a 62% increase compared with the sample containing 0 wt.% additive produced by the same method. Overall, the findings show that the static compression method improves the strength of the samples compared with the dynamic method.
Conclusion
The main findings of this study can be summarized as follows:
In dynamic compaction method, the density increases with increasing compaction speed. The highest density was obtained for the sample containing 5 wt.% nano-powder additive, while the lowest density corresponded to the sample without additive (0 wt.%).
The highest relative density (about 70%) was achieved for the dynamically compacted sample containing 5 wt.% additive at a compaction speed of 7.66 m/s, whereas the minimum relative density (59%) was obtained for the sample produced by the static method with 0 wt.% additive.
The dynamic compaction method produced materials with higher hardness compared with the static compaction method. In the dynamic method, hardness increased with increasing nano-powder content, whereas in the static method it decreased.
Hardness increased with increasing compaction speed. The highest hardness value (1489 HV) corresponded to the sample containing 5 wt.% nano-powder under dynamic compaction, while the lowest hardness value (467.5 HV) was observed for the sample containing 10 wt.% nano-powder produced by the static method.
The highest compressive strength (23.4 MPa) was obtained for samples produced using the static method. The lowest compressive strength was related to the sample containing 10 wt.% nano-powder at the minimum compaction speed. Overall, static compaction improved the compressive strength of the material, whereas the dynamic method enhanced hardness.
The addition of 5 wt.% nano-powder increased the compressive strength by approximately 56%.
This study demonstrates the significant influence of Al2O3 nano-powder on the mechanical properties of the titanium-based nanocomposite.
Footnotes
Appendix
Collapse force of the samples at different percentages of additives in static method.
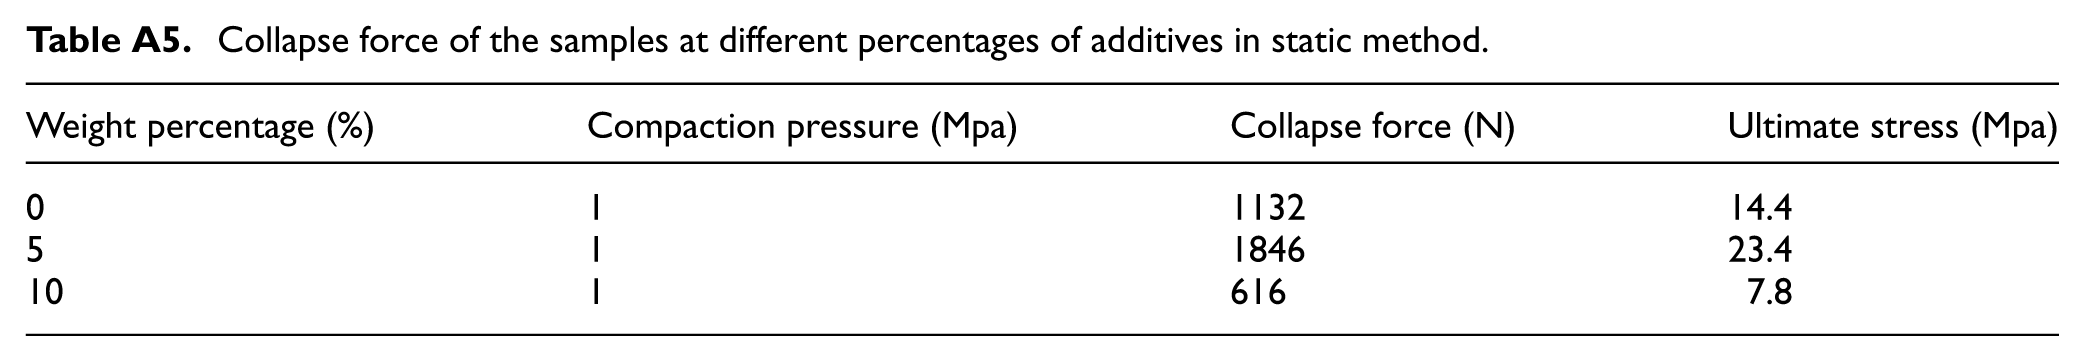
| Weight percentage (%) | Compaction pressure (Mpa) | Collapse force (N) | Ultimate stress (Mpa) |
|---|---|---|---|
| 0 | 1 | 1132 | 14.4 |
| 5 | 1 | 1846 | 23.4 |
| 10 | 1 | 616 | 7.8 |
Funding
The authors disclosed receipt of the following financial support for the research, authorship, and/or publication of this article: Open Access funding enabled and organized by Projekt DEAL.
Declaration of conflicting interests
The authors declared no potential conflicts of interest with respect to the research, authorship, and/or publication of this article.
Data availability statement
Data will be available on request from the corresponding author.*