
Abstract
This paper presents a descriptive, data-driven model based on track settlement rates to support turnout design decisions. Given the wide range of turnout configurations, infrastructure managers must select designs that exhibit favourable long-term behaviour. Descriptive models can support this process by combining empirical in-field data with objective mathematical metrics. Key challenges arise from non-normally distributed settlement rates and strong interdependencies between turnout features, which are addressed using non-parametric methods, scaling, and targeted subsetting. The approach is demonstrated using settlement rates derived from 25 years of longitudinal level measurements recorded by regular track recording vehicles, covering 446 turnouts on the Austrian railway network. Driving direction is shown to have no influence on overall settlement behaviour. Sleeper type, by contrast, exhibits a clear and statistically robust effect: concrete sleepers equipped with under-sleeper pads show about halved settlement rates compared to conventional concrete sleepers and reduced by 40% compared to wooden sleepers. The effects of turnout radius and turnout type are physically plausible and consistent across subsets, but not always statistically significant due to the high variability inherent in field data. Despite remaining limitations, the proposed model provides a transparent and scalable basis for comparing turnout designs within a national network and across infrastructure managers. From an engineering perspective, it enables the identification of design configurations associated with reduced settlement behaviour and maintenance demand. When combined with life-cycle cost models, it represents a step toward data-driven decision support for more informed and economically efficient turnout design decisions.
Keywords
Introduction
Turnouts, also addressed as switches and crossings (S&C), play a vital role in railway infrastructure. They facilitate the transition of trains between tracks while in motion, ensuring operational flexibility and resilience. The significance of this aspect is underscored by its widespread utilization. The EU-27 railway network is estimated to contain approximately 300,000 turnouts or roughly one turnout for every kilometre of track. 1 Due to their structural complexity and exposure to high, concentrated dynamic loads, turnouts are particularly prone to accelerated deterioration.2,3,4 This has resulted in disproportionately high investment and maintenance costs, which account for up to one-third of the total annual track maintenance expenditure on certain networks.2,5
Turnouts are available in a variety of designs. There are three main categories: turnouts (switches), crossings and diamond crossings. Turnout crossings can be realised as fixed or movable. For the sake of simplicity, the scope of this study is limited to turnouts in ballasted track with fixed crossings. The study encompasses a range of turnout geometries. Turnout radii define the maximal permitted speed of the diverging branch and, at the same time, the length needed to realise a turnout. A turnout is classified as straight if its throughgoing branch lies on a straight track; if it is installed in a curve and bent accordingly, it is classified as curved. Turnouts are also available in a variety of sleeper types, including wooden sleeper, conventional concrete sleeper, concrete sleeper with under sleeper pads (USP), as well as steel and composite options. Furthermore, there is considerable variation in the design of metal parts and substructures. Operational differences are defined by permitted speed, daily tonnage and the main driving direction as well as the number of trains diverting.6,7,8
Infrastructure managers must determine the specific turnout configuration required for each boundary condition. Some design features are predefined by operational requirements. For instance, a minimum radius is a precondition for certain diverging speeds. Some design decisions are strategic—for example, avoiding turnouts in curves, thereby eliminating the need for curved turnouts. A third category of design features comes with consistent operational functionality, but decisions must consider local boundary conditions and the long-term performance of turnouts. Component designs, such as the choice of sleeper, fall into this category. In the absence of further information, this decision is frequently made on the basis of either retaining the status quo or lowest possible investment costs. However, given the significant costs associated with the maintenance of turnouts, 9 decisions should incorporate long-term performance considerations, including service life expectancy and maintenance requirements.
Turnout maintenance is a diverse process, encompassing various actions related to the signalling components,10,11 metal parts,12,13 and the track structure itself.14,15 In terms of track structure, the most financially significant maintenance actions are those related to ballast, including levelling-lining-tamping and ballast cleaning. 16 At the same time, the amount of ballast-related maintenance required constrains the achievable service life of a turnout. 17 Higher requirements for ballast-related maintenance are therefore uneconomic, and design decisions should contribute to reducing these demands.
Demand for ballast-related maintenance can be most effectively modelled by track settlement rates.18,19 Track settlements in railways are categorised as either “absolute” (uniform settlements) or “relative” (differential settlements).19,20 In the context of maintenance planning, the latter approach is employed, given that train dynamics are significantly influenced by differential settlements. 21 In regulations, relative track settlements are referred to with the longitudinal level. 22 Longitudinal level is a standardised measurement signal that can be categorised into the following wavelength spectrums: D0 (0.6-3 m), D1 (3-25 m), D2 (25-70 m) and D3 (70-150 m). While D0 and D3 are partially optional, D1 and D2 are mandatory for infrastructure managers in Europe, 23 and similar measurements are used in US and Asia.24,25 Longitudinal level D1 is the primary input used for ballast-related maintenance planning (lateral failures have been reduced significantly by mechanised track work, twist failures are limited to single points only), and is thus the most commonly employed signal for track settlement calculation.21,26,27 Track settlements are described by the rate of longitudinal level signal deterioration. 28
The amount of ballast-related maintenance required depends on settlement rates, which in turn are influenced by the turnout design.29,30 The turnout design can therefore have a significant impact on maintenance demands and long-term costs. In order to make the right decision, infrastructure managers need reliable information on the impact certain design decisions have on long-term behaviour. One reasonable source of information is the experience of maintenance staff. However, maintenance staff is typically familiar with the set of turnouts within their area of responsibility, a network-wide overview is hard to achieve by local experience. Another option is to rely on simulation models. 31 Simulations provide an objective means of describing quality behaviour and open the possibility of including innovative, yet unbuilt turnout designs or worn components.30,32,33 While simulations can be a reliable source of data for specific queries, they may not always accurately reflect real-world holistic behaviour and tend to simplify field conditions. Consequently, the results may not always accurately reflect the actual quality or behaviour.
While in-field experience and simulations are reasonable and trustworthy sources of information, we argue for the addition of a third source in form of descriptive models. Unlike predictive models, descriptive models do not aim to predict future event, but instead describe data in a form that allows for the definition of strategies. 34 They provide insight into large quantities of data, enabling businesses to make sense of it. 34 In this paper, descriptive models seek to integrate empirical, measured in-field track behaviour with the objectivity of a mathematical model. This is achieved by ensuring the dataset is sufficiently large to consider all relevant design impacts on a defined metric, in our case track settlements. This approach complements existing simulation-based and mechanistic track deterioration models by providing empirical, network-scale evidence of real-world turnout performance.
There are a number of prerequisites that must be met in order to ensure reliable descriptive modelling. It is essential that data describing quality behaviour is available in a reasonable time series with consistent data collection. Data must be available for a high number of assets and cover a variety of turnout designs. It is essential to establish meaningful quality indicators that accurately reflect track settlements for turnouts. Executed maintenance must be identified. Furthermore, data preparation tools must be automated to manage the substantial volume of data required. Finally, a proper descriptive model demands the use of appropriate statistical tools.
Up to now, these preconditions have not been established for the aspect of track settlements in turnouts. For this reason, such models do neither exist nor can be found in literature. The authors of this paper have access to a dataset that fulfils the identified preconditions, due to a long-term cooperation with the Austrian infrastructure manager, ÖBB-Infrastruktur AG. In addition, recent research has addressed the respective challenges associated with data handling.35,36,37 This paper employs recently developed tools to manage 20 years of network-wide data on 446 turnouts, alongside statistical analyses, to deliver a descriptive model ready to support turnout design decisions. Thereby, the paper makes three main contributions: (1) a scalable, descriptive modelling framework for turnout settlements based on longitudinal level data; (2) a robust approach to handle non-normally distributed variables and interdependent turnout design features; (3) quantified, network-scale evidence of the impact of sleeper type and turnout geometry on performance, as well as consistent trends for other design features.
Methodology
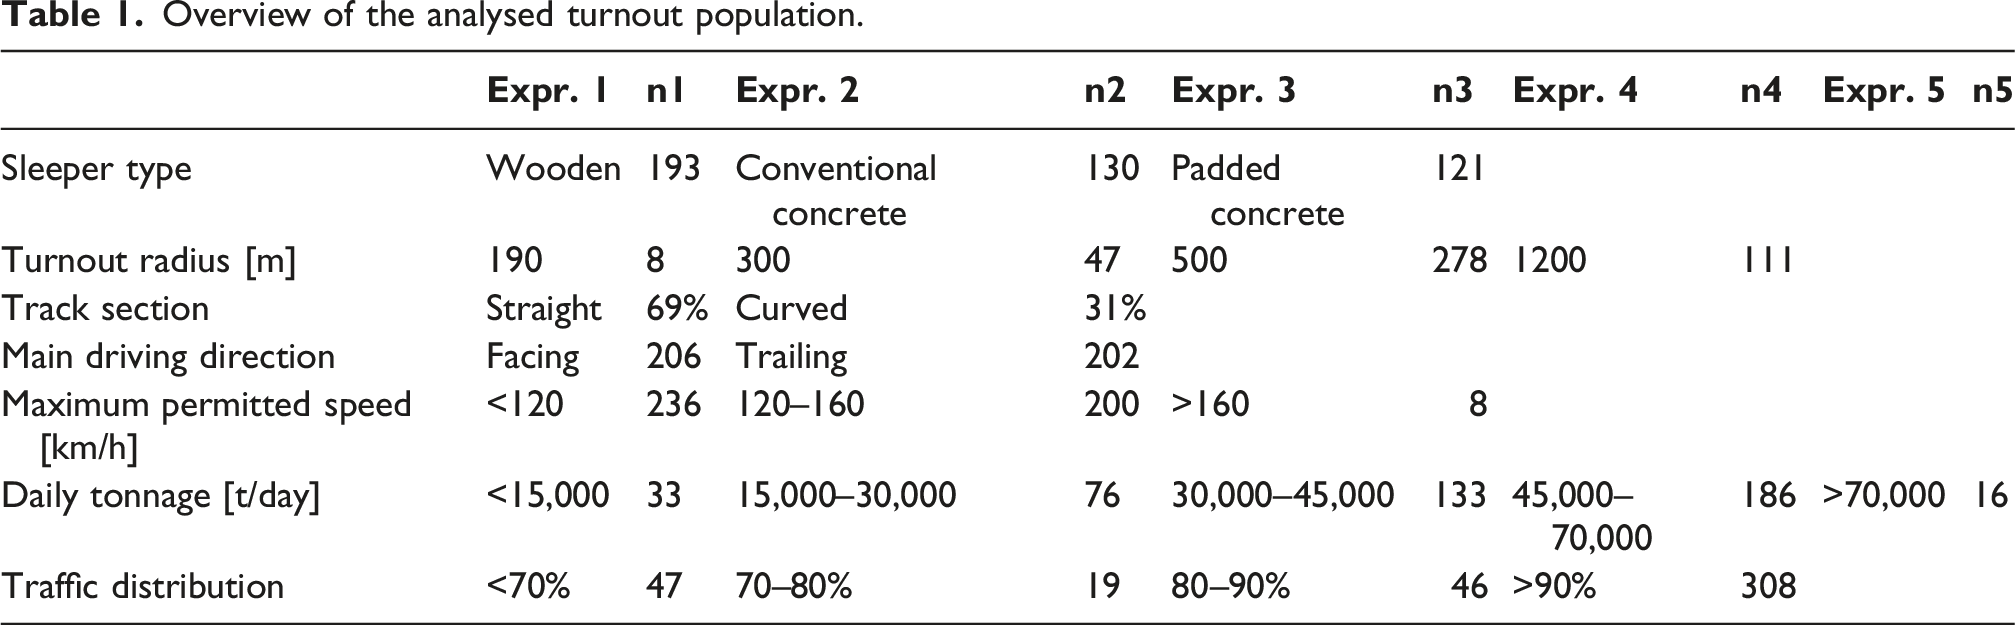
Overview of the analysed turnout population.
The following subchapters describe the data basis, discuss relevant quality indicators for assessing track geometry condition in turnouts, address the treatment of time series and settlement functions, and examine several statistical challenges arising from non-normally distributed settlement rates and non-independent turnout characteristics. Figure 1 provides an overview of the workflow. Detailed information is provided in the relevant subchapters. Overview of the methodological workflow used to build the descriptive model employed.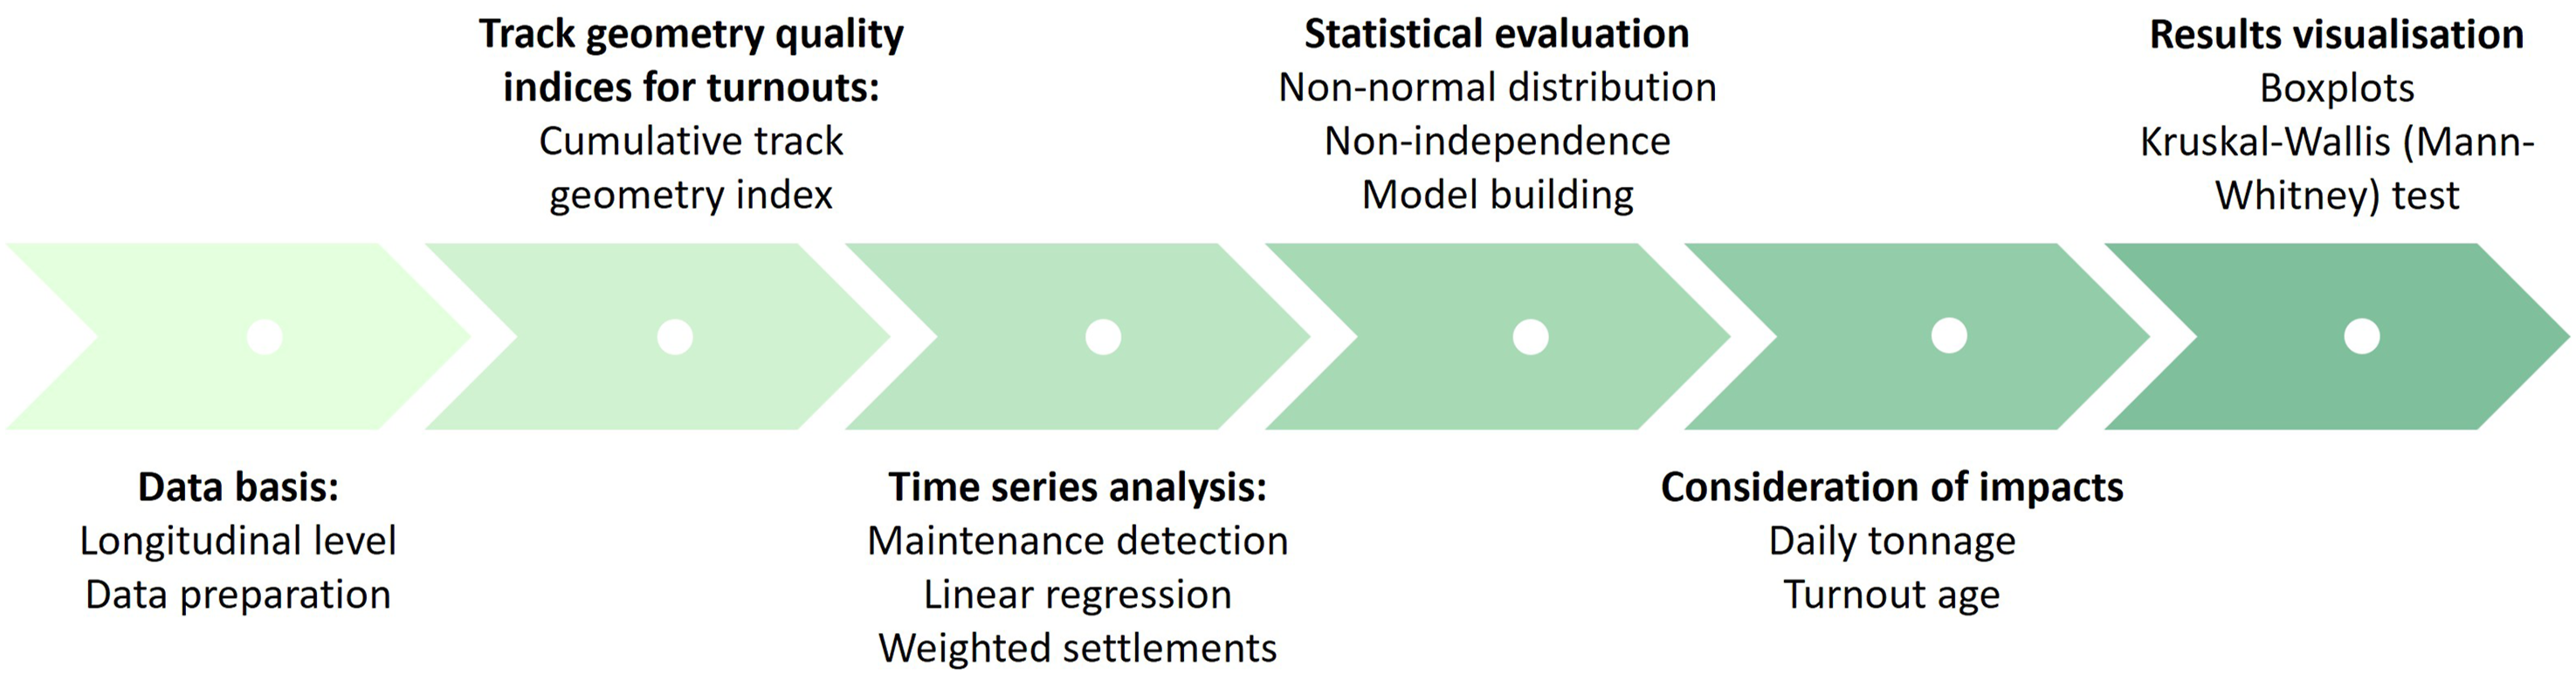
Data basis
In Austria, standard track-recording vehicles with consistent track geometry measurement devices have been measuring main lines 2-6 times a year since 2001. One of the key parameters that has been recorded is longitudinal level D1, as outlined in the European regulation EN 13848-1. Although not designed specifically for turnouts, measurement devices are active while passing a turnout, and thus data can be used. Figure 2(a) illustrates four longitudinal level measurements in the area of a turnout. An intensive data alignment process was applied to the data to ensure proper data alignment.
35
(a) Longitudinal level measurements within a turnout from four measurement runs. (b) Transformation of the longitudinal level signal into RMS values, converting all signal amplitudes into non-negative values. (c) Cumulative sum of RMS values along the turnout length, forming the basis for the cumulative track geometry index (cTGI).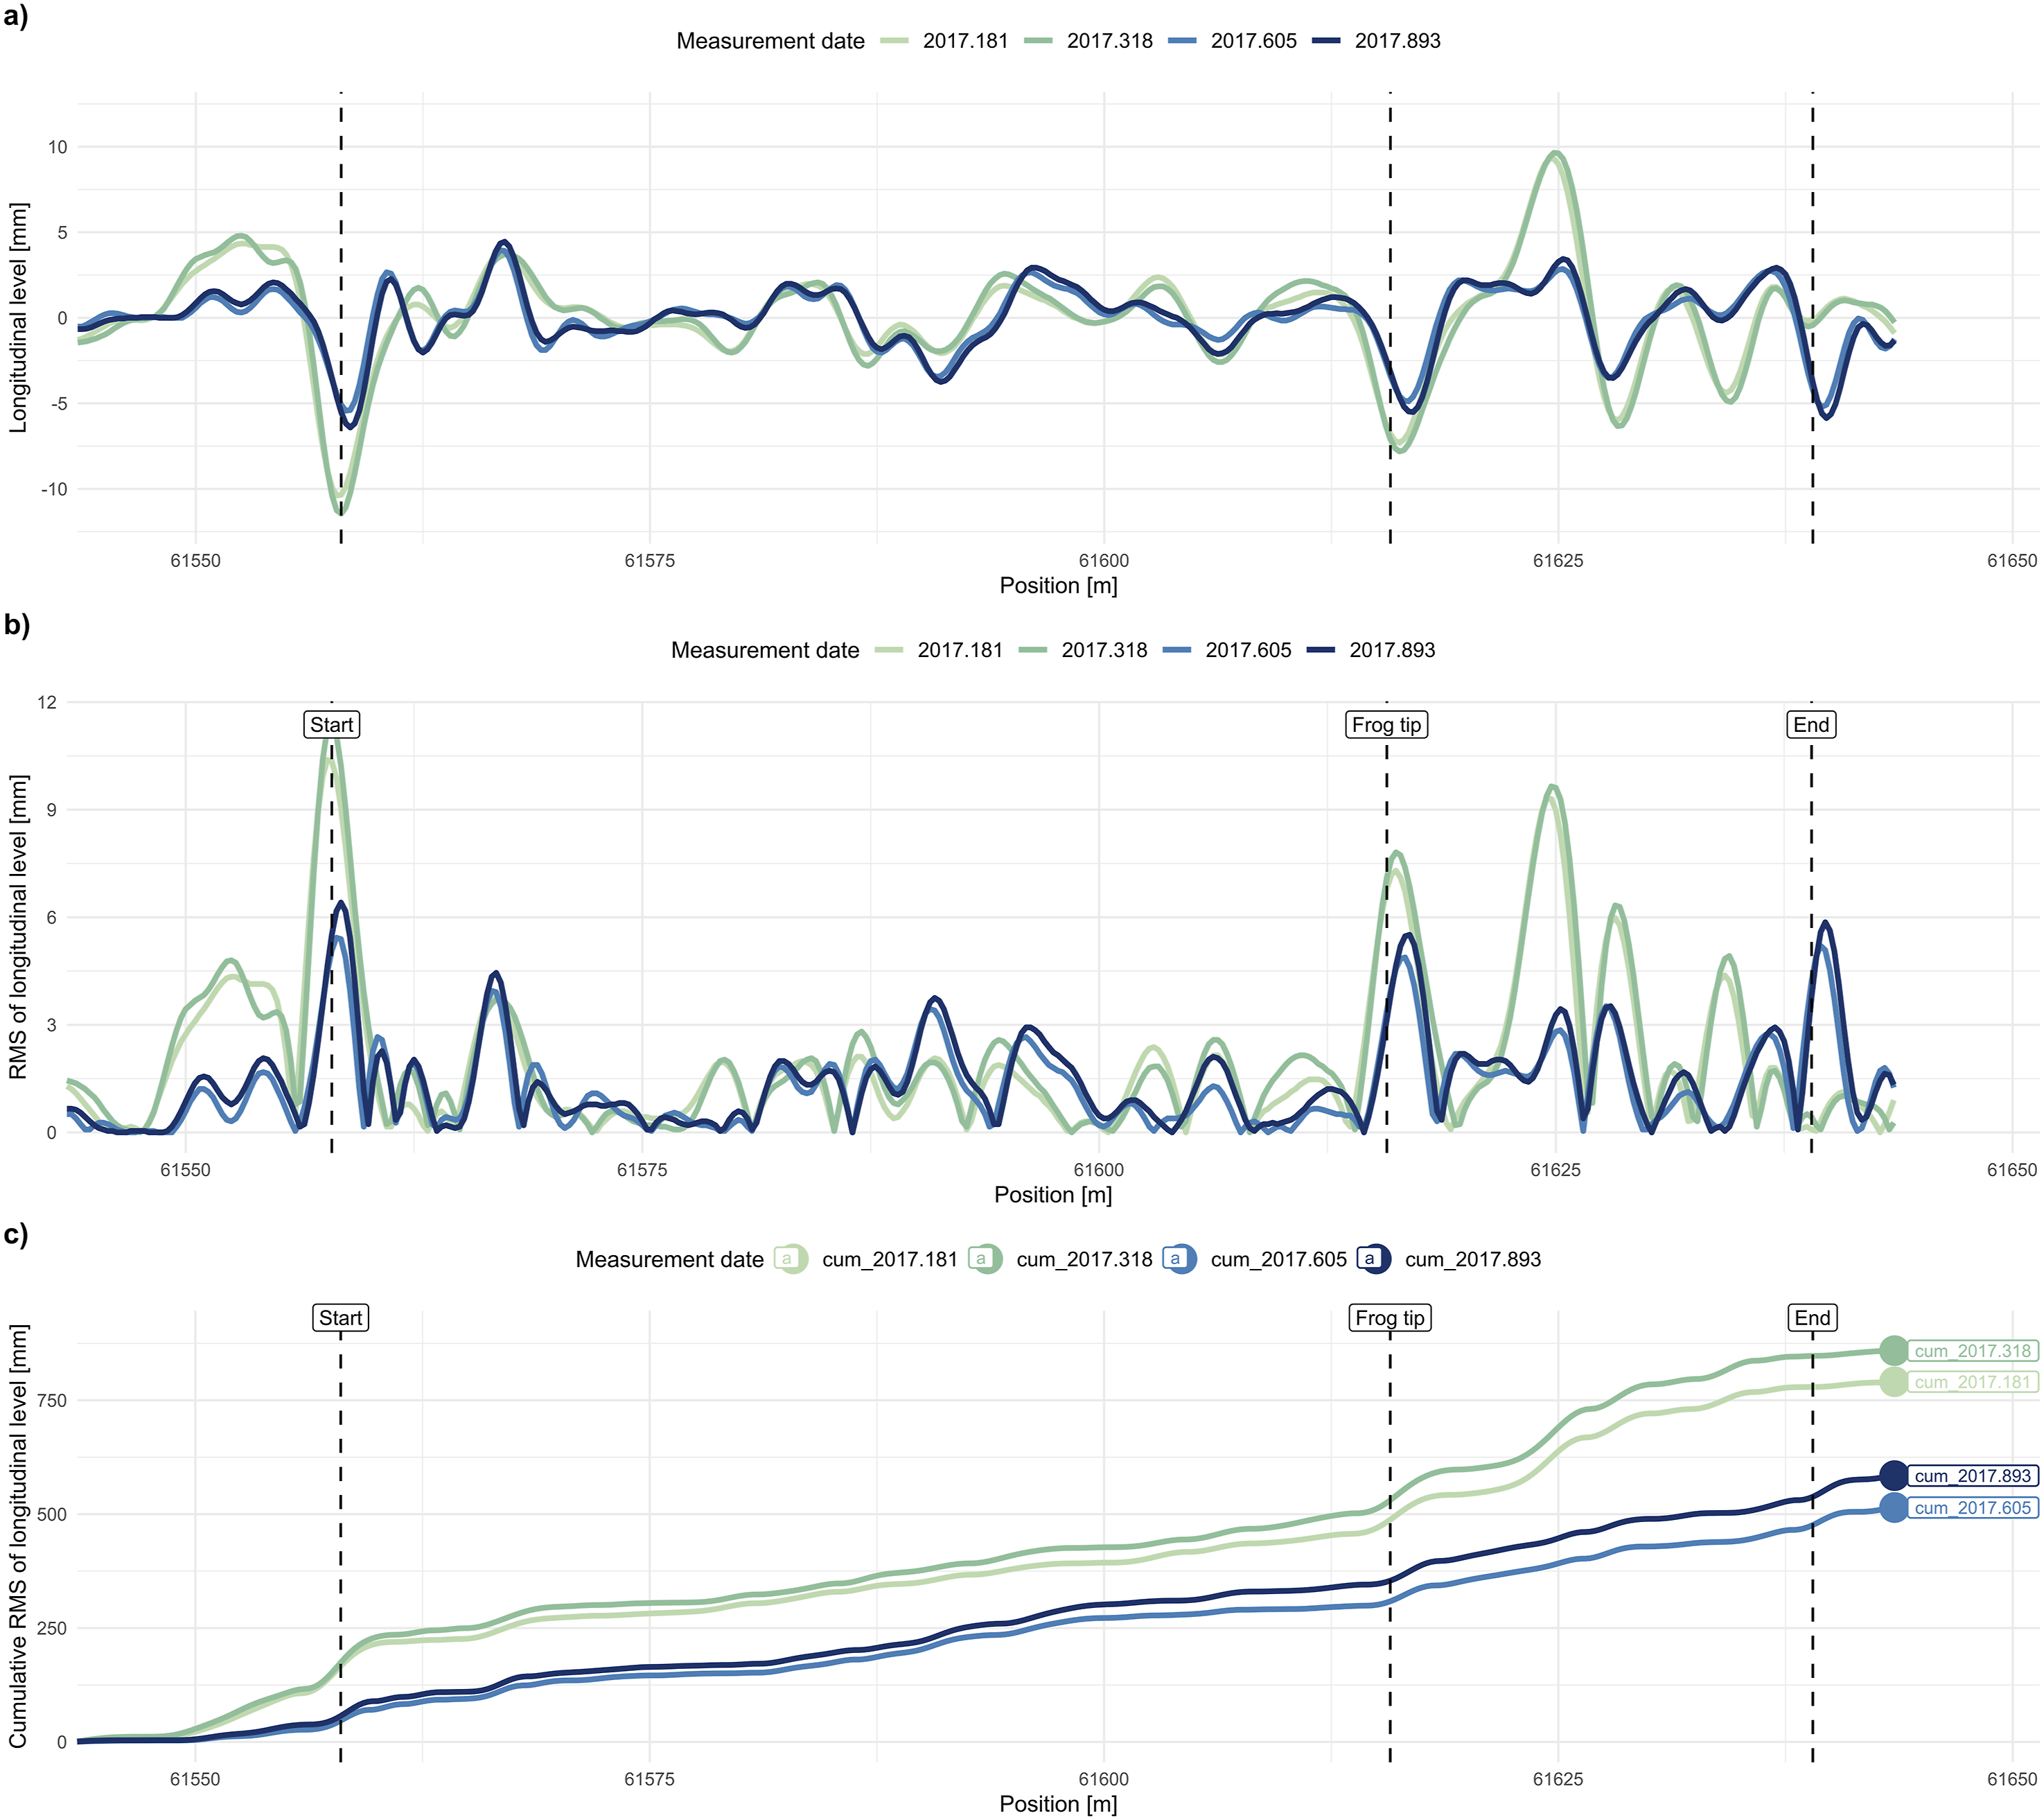
Vertical lines indicate turnout positions, including the start of the turnout, the frog tip and the end of the turnout. Typical track behaviour over time can be observed by analysing signal characteristics. As a result of track settlements, compared to the first measurement run (2017.181) the signal peaks are slightly more pronounced in the second measurement run (2017.318). After this, a tamping action significantly enhanced the track geometry of the turnout, and the third run (2017.605) therefore shows better track quality. After that, the track geometry deteriorates again (2017.893). Closer analysis of the signal characteristics reveals local settlements (isolated track geometry failures) at the turnout start, at the frog position and in the transition zone between the last long sleeper and the first short sleeper.
While raw data helps to assess individual turnouts and plan maintenance, descriptive modelling requires quality indicators. In open track, the longitudinal level is evaluated using: (1) the maximum zero deviation, which is a safety-related threshold that triggers spot tamping; and (2) the standard deviation over a 100–200 m window, which supports long-term maintenance planning. 38 As the latter better reflects long-term performance, it is more suitable for this study. However, due to the short length of turnouts and the reduction in the size of the window, the index calculation must be adapted. 39
Track geometry quality indices for turnouts
Instead of standard deviation, we use the cumulative track geometry index (cTGI) to describe the ‘average’ track geometry quality for turnouts. Higher cumulative values indicate larger overall deviations in longitudinal level and therefore poorer track geometry quality. Further details of this approach are already published.
37
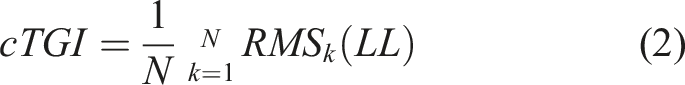
Figure 2(b)-(c) provides an overview of the index calculation process using the recorded signals already described in the previous chapter. The calculation consists of two main steps. First, the longitudinal level signal is transformed into RMS values (Figure 2(b)), which removes the sign of the signal while preserving its amplitude. In this study, the RMS calculation is applied pointwise, such that it is equivalent to taking the absolute value of the longitudinal level signal. In a second step, these values are accumulated along the turnout length (Figure 2(c)), resulting in a cumulative curve. The final value of this curve, normalised by the number of data points, defines the cumulative track geometry index (cTGI). Formulas 1 and 2 describe the index calculation.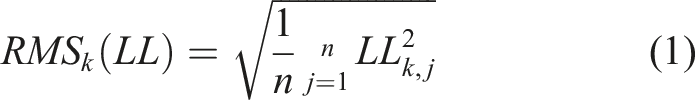
The use of cTGI as a proxy for settlement behaviour is justified by its direct derivation from longitudinal level measurements, which are the primary indicator for ballast-related maintenance in practice. As differential settlement manifests as increasing longitudinal level irregularities, the cumulative representation captures both the magnitude and spatial distribution of these effects. Consequently, higher cTGI values correspond to increased maintenance demand and reduced track quality.
This behaviour is also reflected in the example shown in Figure 2(c), where the index value increases between consecutive measurement runs, drops after maintenance, and increases again thereafter. The scaling of the values makes the cumulative track geometry index independent of the length of the turnout being evaluated, unlike standard deviation, and allows turnout segments of virtually any length to be evaluated. This is particularly useful for comparing turnouts of different lengths (diverging radii).
Time series analysis
The depiction of cTGIs over time provides a solid foundation for conducting time-series analysis and examining turnout quality behaviour. Typically, track settles over time, leading to growing cTGI values. Tamping actions “straighten” the track, which is reflected by an abrupt reduction in cTGI values. Figure 3 illustrates this standard settlement behaviour, based on one of the analysed turnouts. Time series of turnout track geometry represented by the cumulative track geometry index.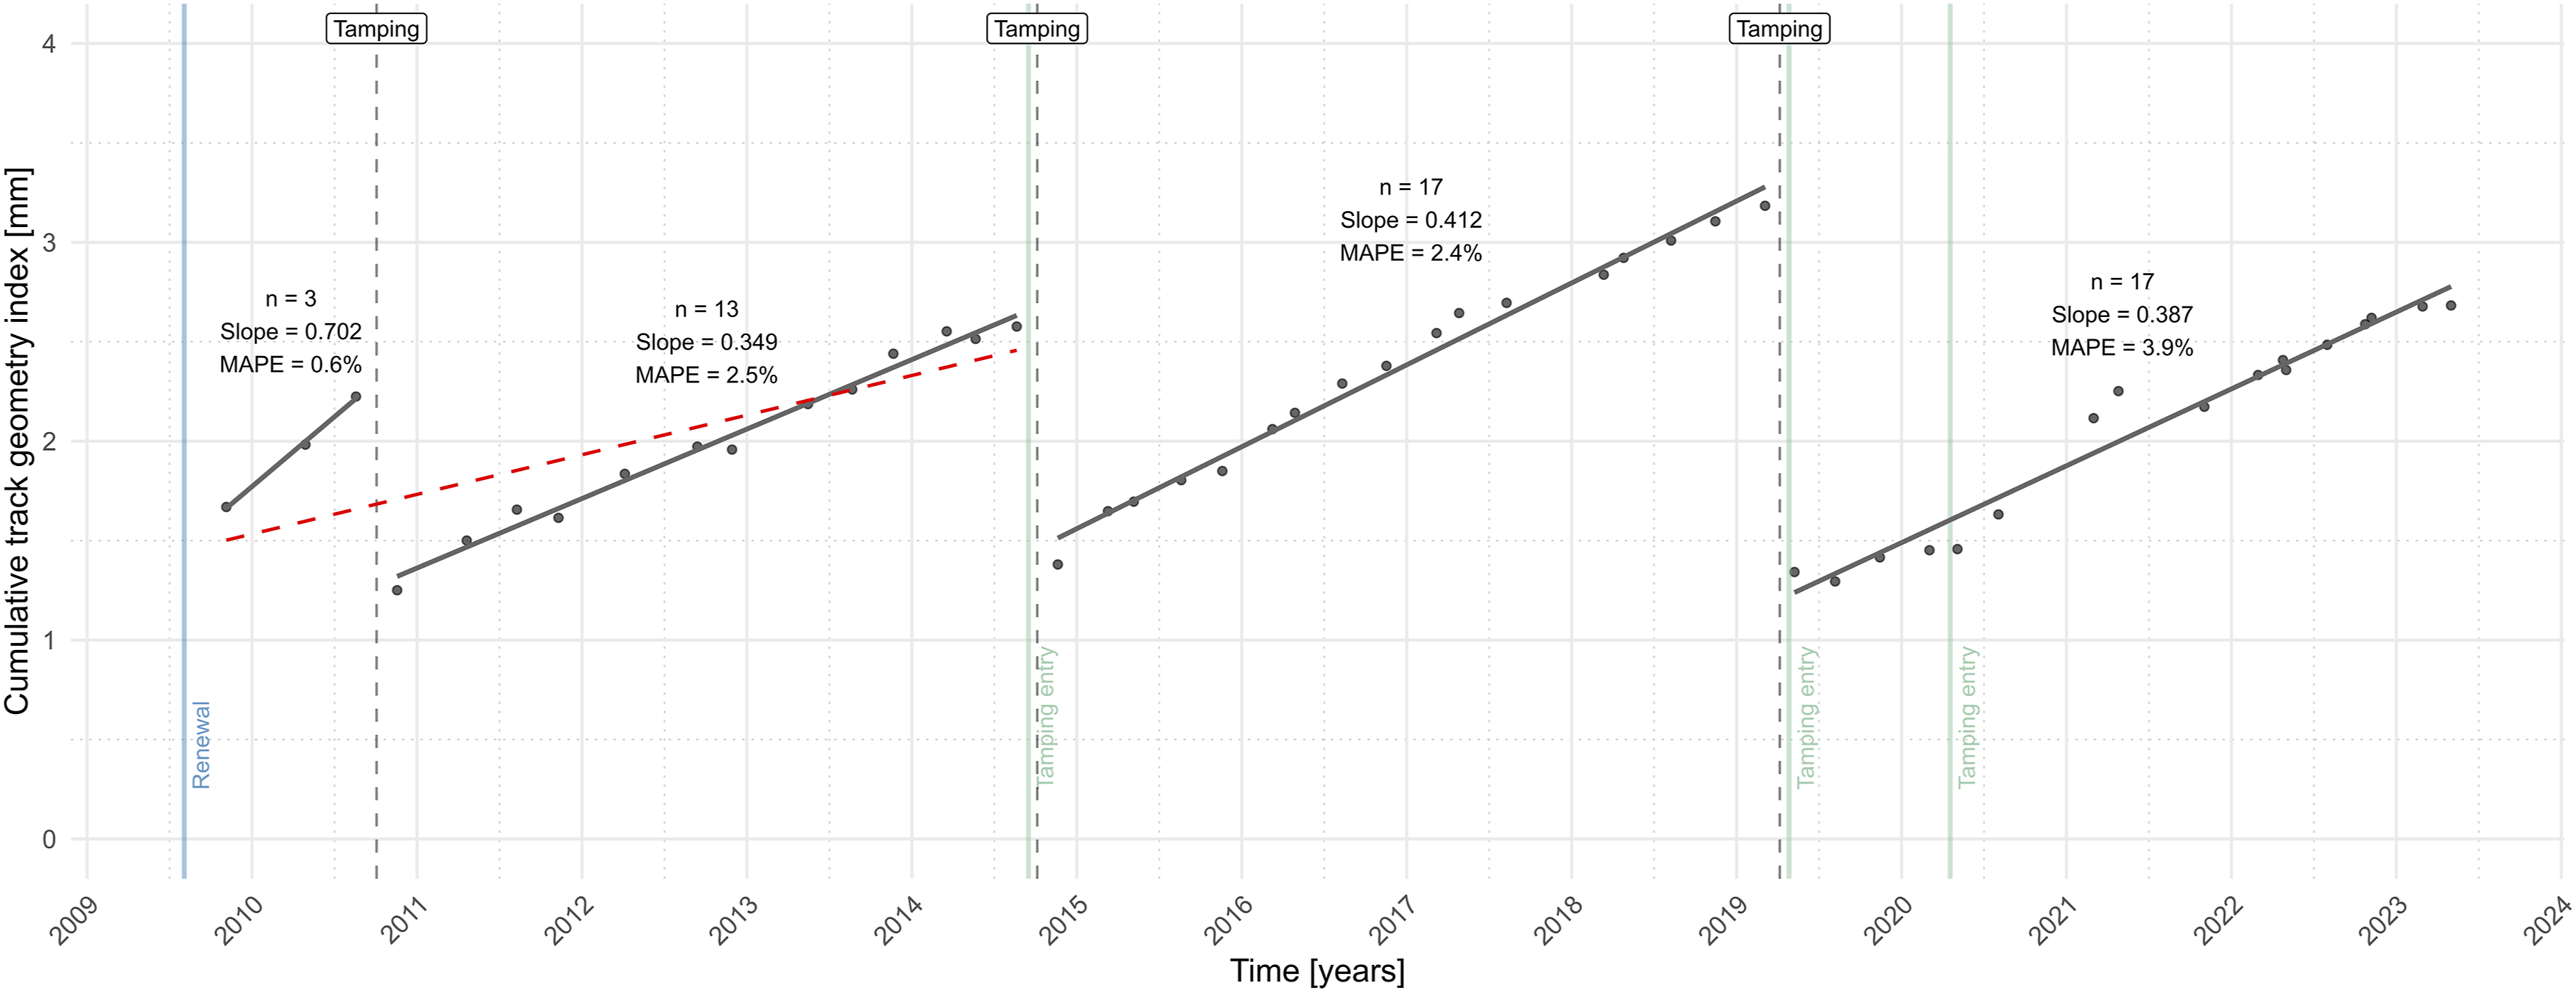
The time series starts with the turnout renewal (installation) in 2009. Each point on the graph reflects the cTGI derived from a measurement run. The initial settlement branch extends up to 2010, the year in which stabilisation tamping was carried out. Following this, three additional settlement branches are visible. The green vertical lines indicate maintenance information, as provided by the infrastructure manager. It appears that entries for 2014 and 2019 are accurate and have been verified by the observed behaviour. However, in 2011 an entry is missing, and an entry for 2020 does not accurately reflect a maintenance action. Entries of this nature are not isolated incidents in the dataset under consideration and also known to other rail networks. If not dealt with correctly, settlement branches are defined inadequately and resulting settlement rates are not correct. This is illustrated by the additional dashed regression line between 2009.5 and 2014.75, which does not accurately reflect the actual settlement trend. Due to the unreliability of documented maintenance actions, we have implemented a maintenance detection algorithm based on signal characteristics. 36 The accuracy of the maintenance detection algorithm has been evaluated in detail in a recent publication by the authors, 36 where detection performance was quantified against a validated reference dataset. The results indicate that the applied approach provides sufficiently reliable identification of maintenance-related changes in track geometry for the purposes of this study with F-scores of up to 0.75 depending on track conditions.
Having defined these maintenance-free time spans, settlement behaviour can be evaluated within these windows. For that, we apply linear regressions and calculate the slope of the regression. As outlined in literature, 40 this approach is both feasible and advantageous. A steep settlement rate with high values indicates fast-track settlement and thus poor turnout performance. Settlement rates of the presented example are relatively high, with a particularly high value of 0.7 mm/year for the first branch. The occurrence of high settlements directly following the turnout renewal is a recognised phenomenon of initial settlements, and the reason for stabilisation tamping shortly after renewal. The other branches of the example exhibit settlement rates of approximately 0.4 mm/year, still indicating relatively high settlements.
In order to compare average turnout behaviour, an average settlement rate must first be defined for each turnout. Simply calculating the mean of all settlement rates can be misleading, since short, steep branches occur more frequently and therefore exaggerate rapid changes compared to long, flat branches. Therefore, to obtain a more accurate average, settlement rates are weighted by their respective time intervals (formula 3).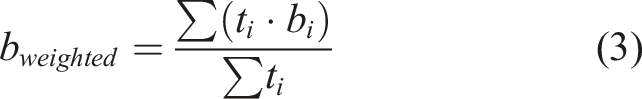
Statistical evaluation
Two aspects demand proper consideration in order to produce valid results. (1) Neither the original calculated nor the weighted settlement rates follow a normal distribution. (2) Features and their characteristics are highly interdependent.
Non-normal distribution track settlement rates
Normal distribution is tested using a combination of graphical methods (graphical histogram and the qq-plot) and the statistical Shapiro-Wilk normality test. All evaluations are performed using predefined commands provided with the statistical software R (version 2025.09.1). Figure 4 presents histograms and the QQ-plots based on settlement rates. Density and Q-Q plots as indicators for normal distribution. (a) Settlement rates, (b) log transferred settlement rates, (c) weighted settlement rates and (d) log transferred weighted settlement rates.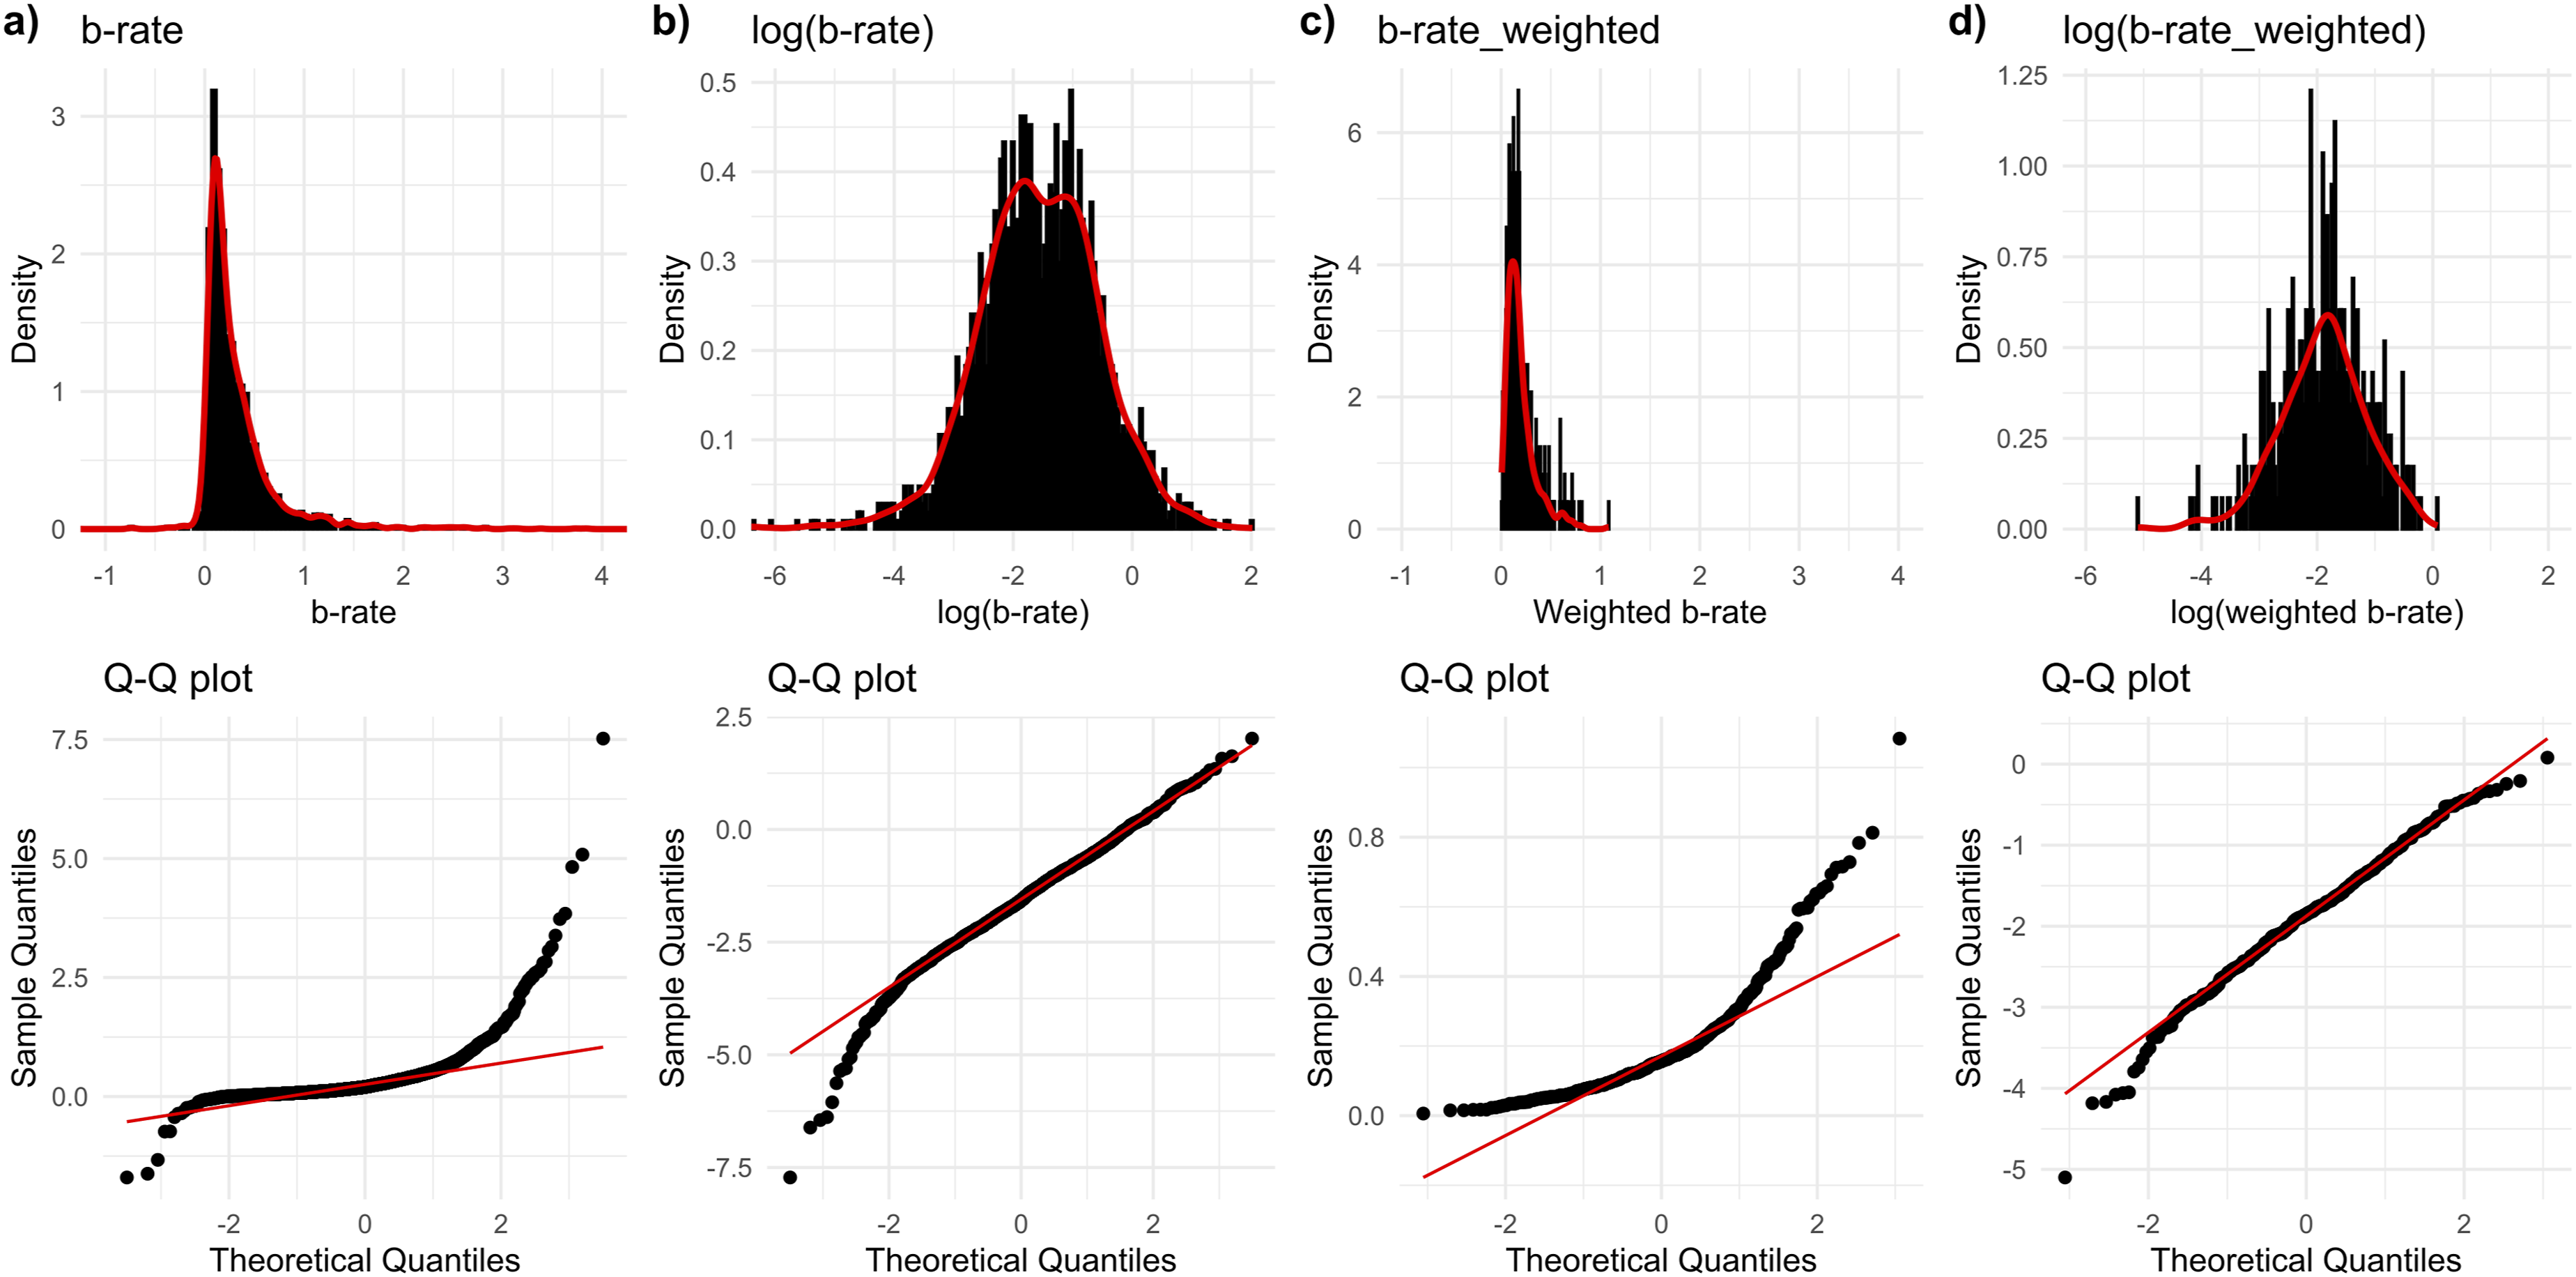
The density plots based on settlement rates (a) and weighted settlement rates (c) deviate distinctly from a Gaussian normal curve and therefore indicate non-normality. This is also confirmed by skewness values of 5.02 and 1.89 (0 reflecting a normal distribution), as well as kurtosis values of 53 and 7.75 (3 reflecting a normal distribution). As black points deviate from the red line of the Q-Q plots, the results of the density plot can additionally be confirmed. The results of the Shapiro-Wilk normality test indicate that the settlement rates (W = 0.61, p-value <2.2e-16) and weighted settlement rates (W = 0.83, p-value <2.2e-16) do not follow a normal distribution. For normality, the value of W should be 1, and the p-value must be greater than the significance level of 0.05.
As the data are not normally distributed, parametric tests such as t-tests and ANOVAs are only applicable to a limited extent. There are two options: (1) transform the data (usually via log transformation), test for normality and then back-transform the results, or (2) apply non-parametric tests, such as the Kruskal–Wallis test. Although log transformation shifts the data closer to normality (Figure 4(b) and (d)), normal distribution cannot be statistically confirmed. Given this, and the added complexity of interpreting transformed data, the original dataset is retained and analysed using non-parametric methods.
Non-independence of turnout features
Although descriptive models do not require variables to be independent, strong dependencies between features can complicate interpretation and may lead to misleading conclusions if not properly accounted for.
41
In the context of statistics, a variable is said to be statistically independent if “the state of one subsystem does not affect the probabilities of various states of the other subsystems”.
42
This is not generally the case for design features of railway tracks. Design regulations prescribe specific components for given boundary conditions, which creates systematic dependencies between variables. For instance, concrete sleepers with under-sleeper pads (USP) are used on heavily loaded lines because they reduce settlements. A superficial analysis ignoring the sleeper-impact might therefore wrongly suggest that higher loading leads to lower settlements. Using a Chi2 test with Cramer’s V values, dependencies of features can be identified. Figure 5 depicts major feature dependencies from the analysed dataset. Dependencies among the considered turnout features assessed via Chi2 tests, with Cramér’s V values.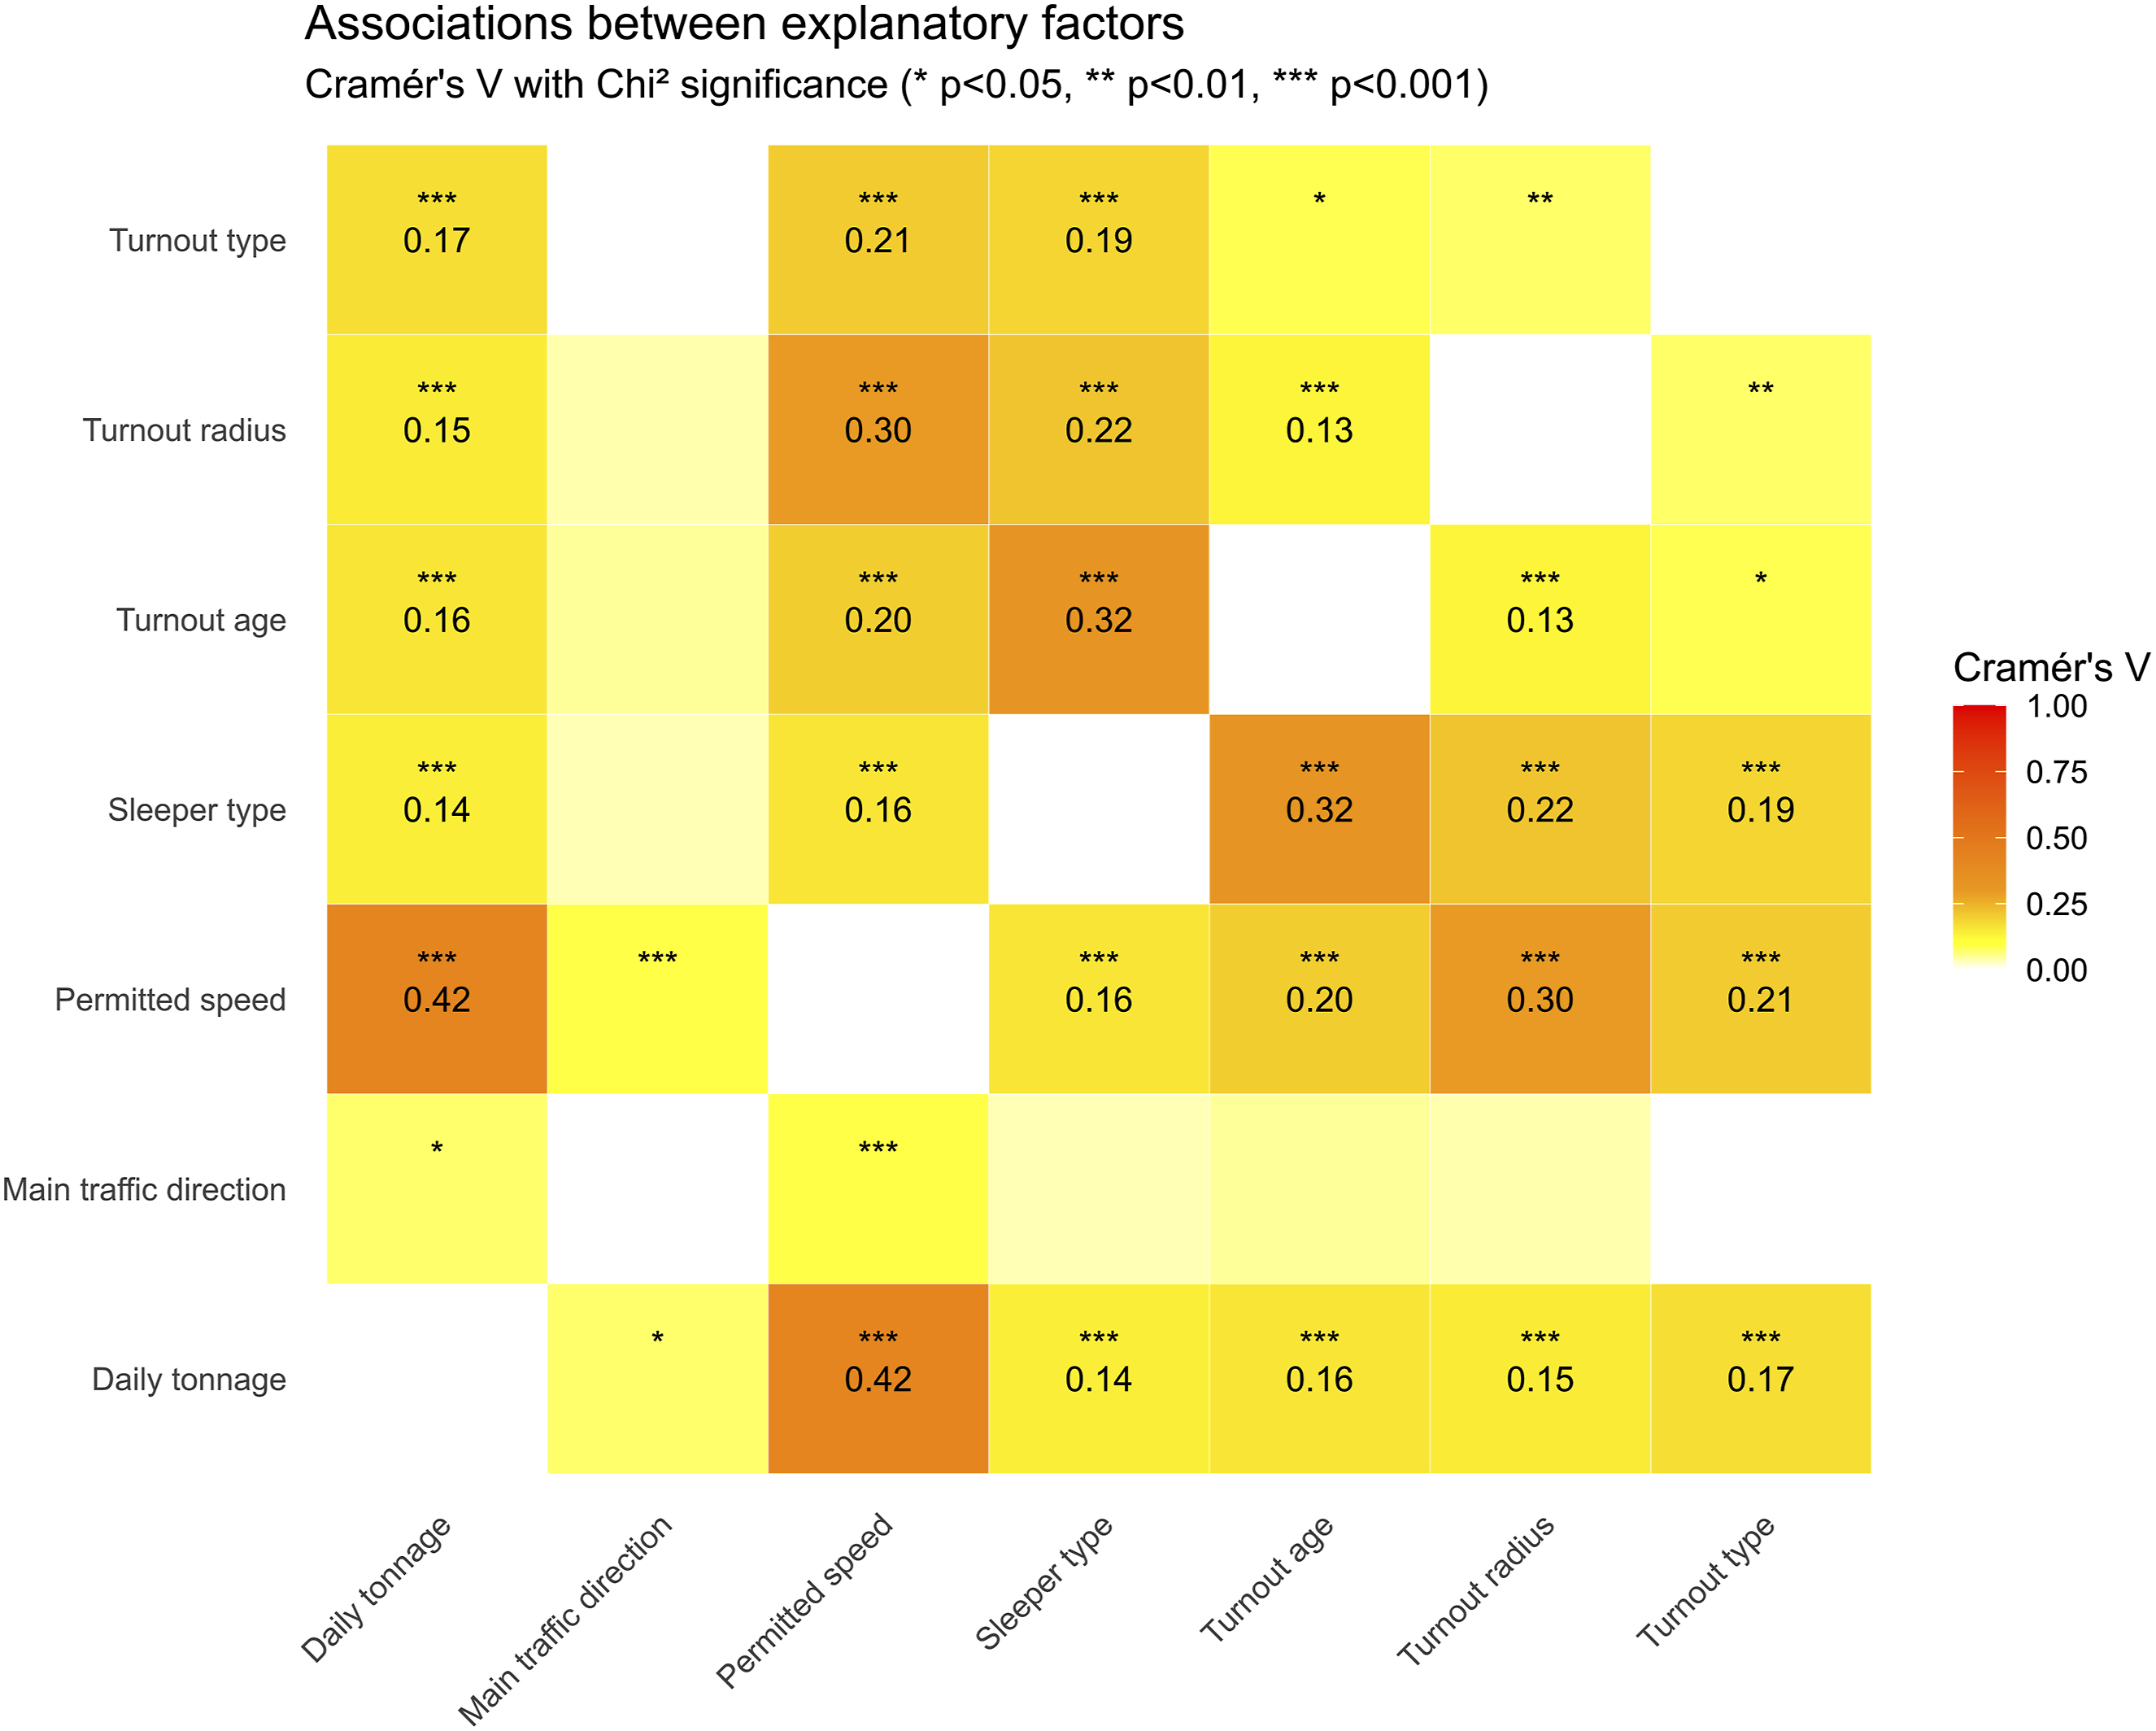
Each field of the grid outlines the dependency between the two turnout features labelled by means of a Cramér’s V value. For instance, the field of the top line and first row illustrates the dependency between daily load and turnout type. The significance of each field is indicated by small stars at the top. Cramér’s V values above 0.2 are indicative of essential dependencies. A value greater than 0.4 indicates a very strong correlation between the features. This is the case in the correlation between the permitted speed and daily tonnes, underscoring the interconnected nature of these parameters. However, dependencies are present for almost every turnout feature. Only the main driving direction (facing or trailing) is independent of other features; all other features are interconnected with at least one other.
There are four possible approaches to managing highly dependent datasets. One option is to homogenise the samples to create balanced sub-datasets 43 ; however, this process is time-consuming, reduces the sample size and produces non-random subsets, so it is not pursued here. The second approach focuses solely on independent variables, ignoring the others. While this approach is statistically valid, it yields limited results. Thirdly, dominant performance drivers can be analysed directly. As these features have the greatest influence on the quality index, significant differences remain apparent despite potential dependencies. The fourth approach is clustering-based homogenisation, which is widely used in the railway sector. We will discuss approaches 3 and 4 in the results section.
Consideration of daily tonnage and turnout age
A well-researched impact variable on track settlements is the type and volume of traffic.
44
Whilst more detailed approaches have been developed considering both tons and vehicle characteristics,
45
due to the complexity of the topic, most track-related research has focused on daily tonnage solely.46,47,48 The left part of Figure 6 depicts the mean settlement rates of all 446 turnouts analysed, plotted over daily tonnage, illustrating the impact. Correlation functions are applied to quantify the effect of accumulated tonnage on settlement rates, both for the full dataset and for three subsets grouped by sleeper type. For all regressions, the impact of daily tonnage is clearly and significantly demonstrated, despite the regression based on the concrete USP sleeper. Increases in daily tonnage are directly linked to higher mean track settlements. In order to eliminate the impact of daily tonnage, values are scaled using the correlation functions calculated (formula 4-6). Effect of daily tonnage on mean track settlements, shown before (left) and after (right) scaling.
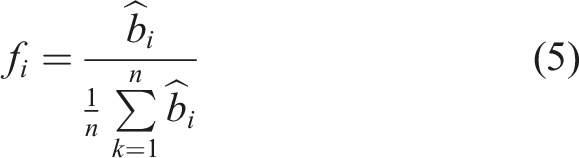
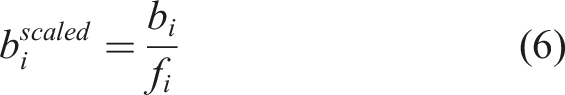
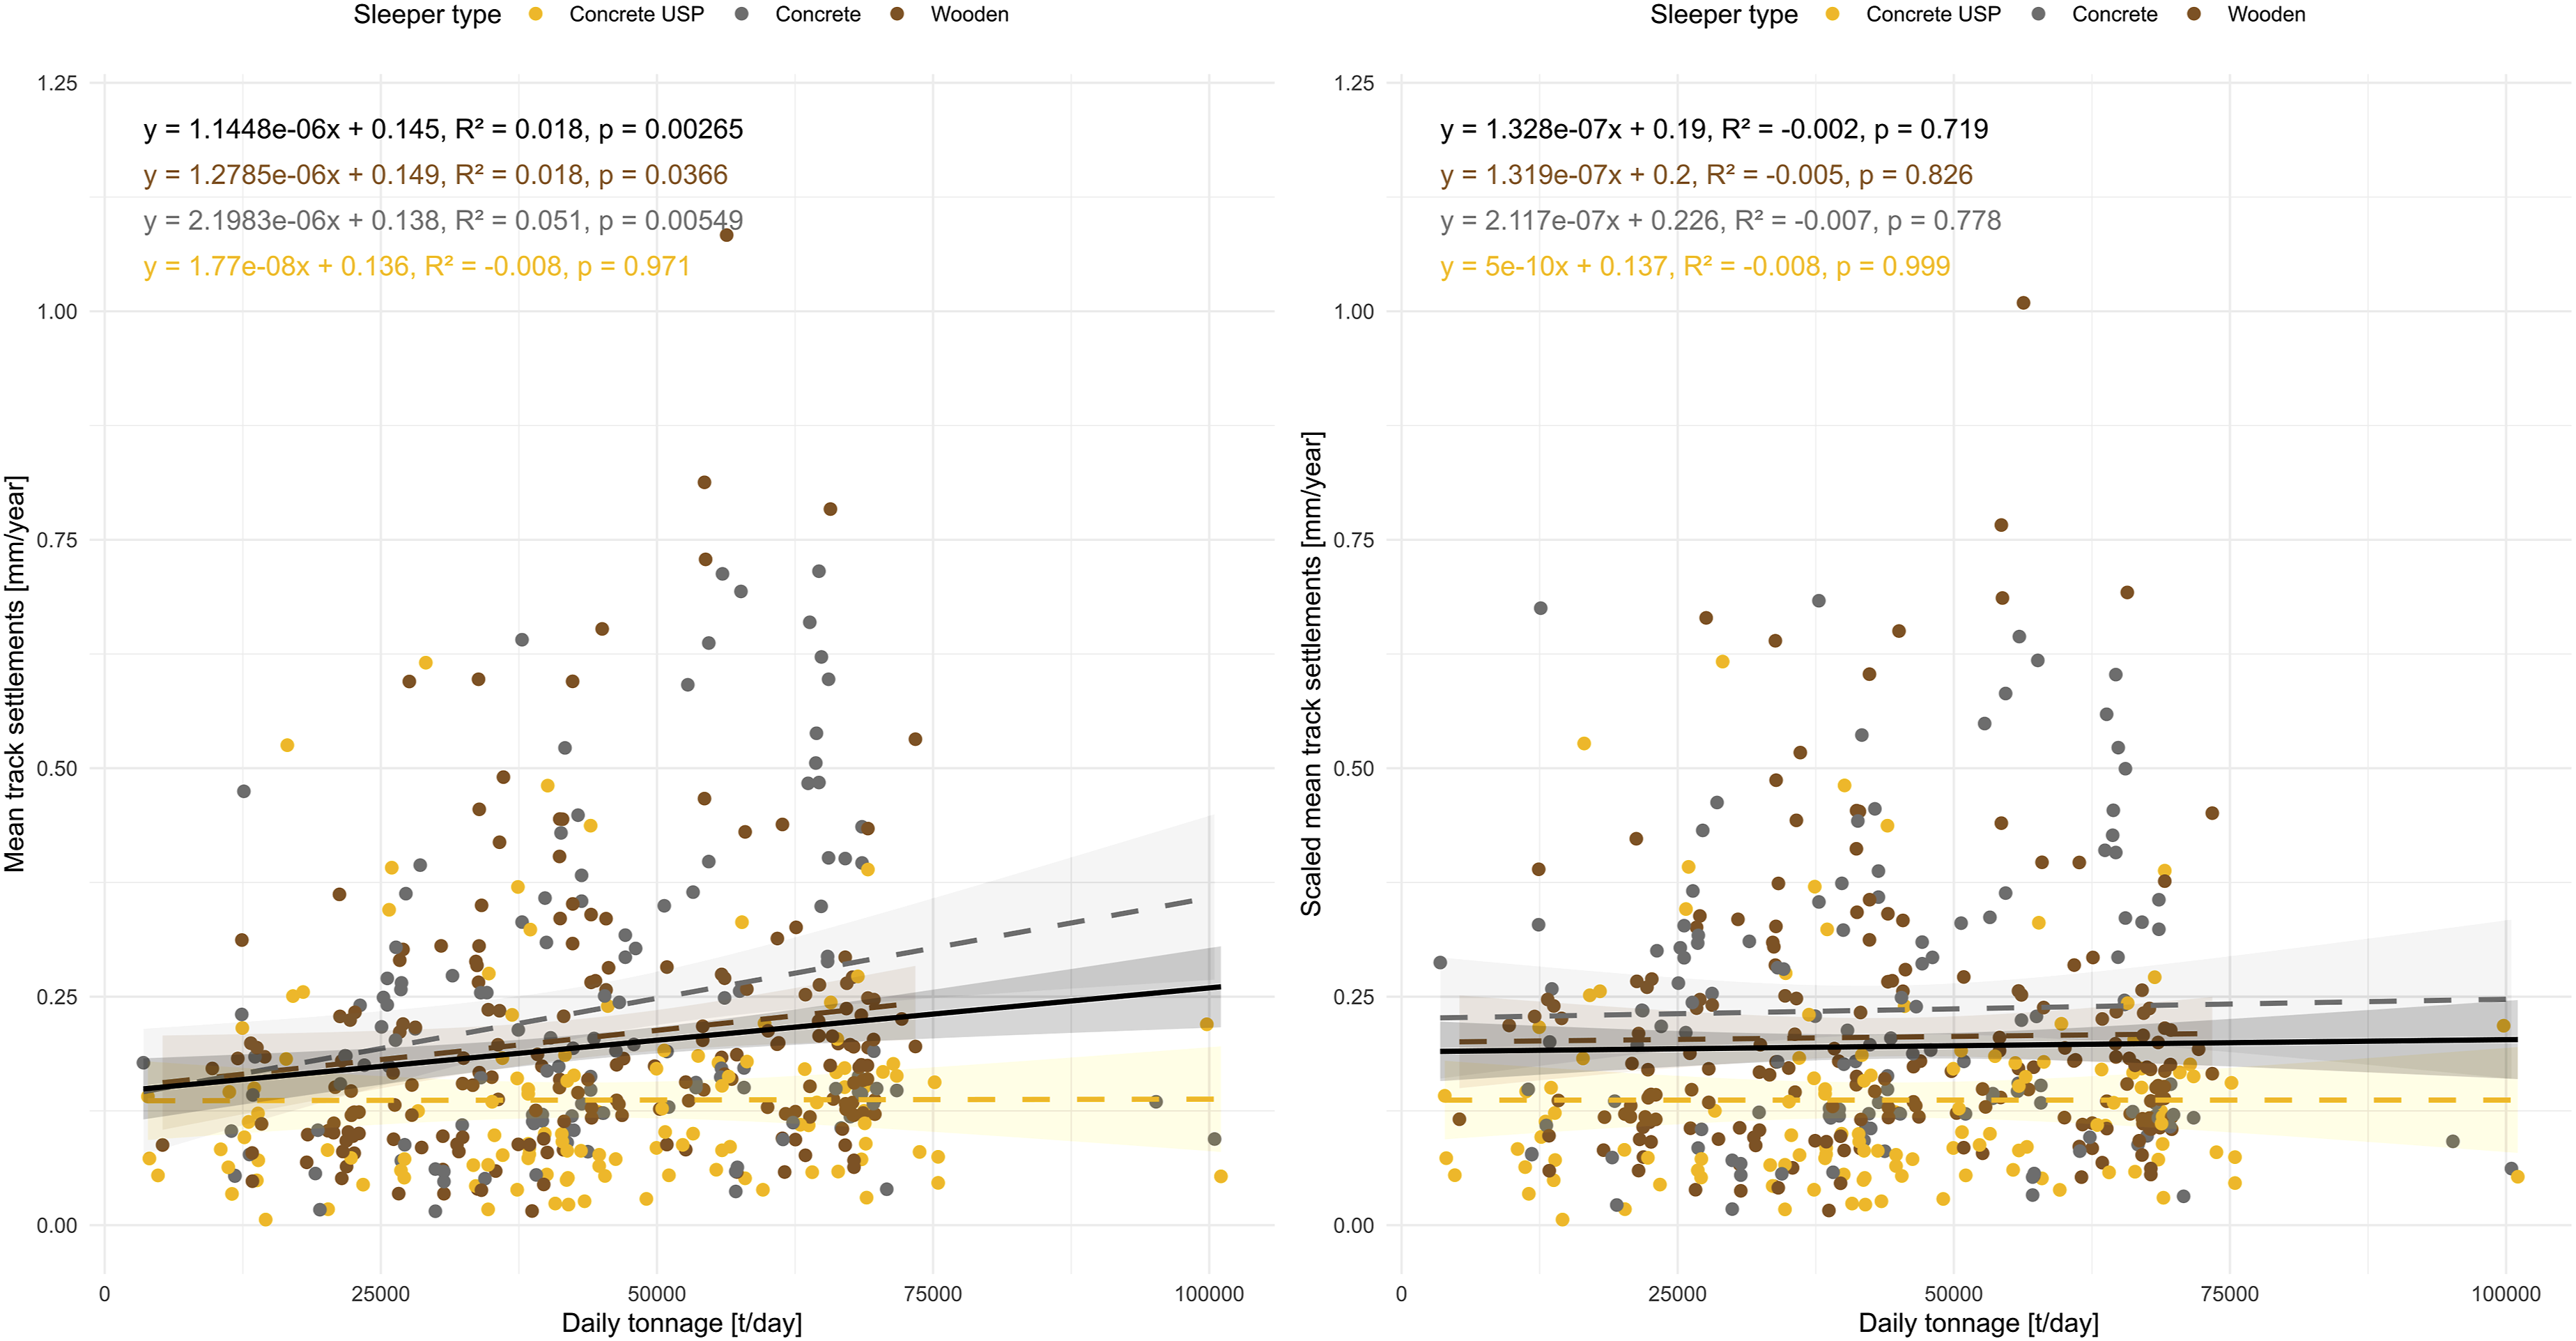
The regression models predict expected settlement values for each tonnage level. Dividing these predictions by their mean yields scaling factors of about 1, which can be used to remove the calculated effect of daily tonnage. The scaled mean settlement rates as a function of daily tonnage are shown on the right-hand side of Figure 6, where no statistically significant relationship can be observed. Although scaling was performed analogously for each sleeper type, the global regression now shows no correlation, demonstrating the effectiveness of the approach. In addition, since the scaling factors are approximately 1, the average mean track settlements remain unaffected by scaling, and values can still be compared to non-scaled settlement rates. For all subsequent evaluations, scaled mean track settlements will be utilised to consider the impact of daily tonnage.
One final consideration is the age of the turnout, which may be a significant factor affecting track settlement. Evaluations show no clear trends for different sleeper types. Therefore, it was not possible to compensate for turnout age. More detailed thoughts will be shared in another publication.
Result visualisation
The developed descriptive model is used to assess the performance impact of specific turnout design features, here illustrated by four representative examples. Results are visualised using boxplots with labelled medians. Statistical significance is first tested using a Kruskal–Wallis test. If significant, pairwise Wilcoxon rank-sum tests (Mann–Whitney U tests) are conducted to identify which design characteristics differ in settlement behaviour. Chi-squared and p-values are reported alongside the boxplots.
Results
Three different types of results are presented. Firstly, an example of a feature which is independent of all other features is given. Secondly, a dominant feature is depicted, overshadowing other dependencies. Thirdly, the typical process of data subsetting in order to reduce dependencies is demonstrated based on two connected examples.
Main driving direction as an independent feature
As demonstrated in Figure 5, the main travel direction of trains is not connected to any turnout design feature. Therefore, a direct comparison of turnouts with facing or trailing main driving direction is valid without any further efforts. The comparison is illustrated in Figure 7. The median for both groups is 0.15 mm/years, and the distribution is very similar. The Kruskal-Wallis test yields a p-value of 0.863, clearly indicating that the main travelling direction does not have a significant impact on mean track settlements. Effect of the predominant driving direction on mean track settlements.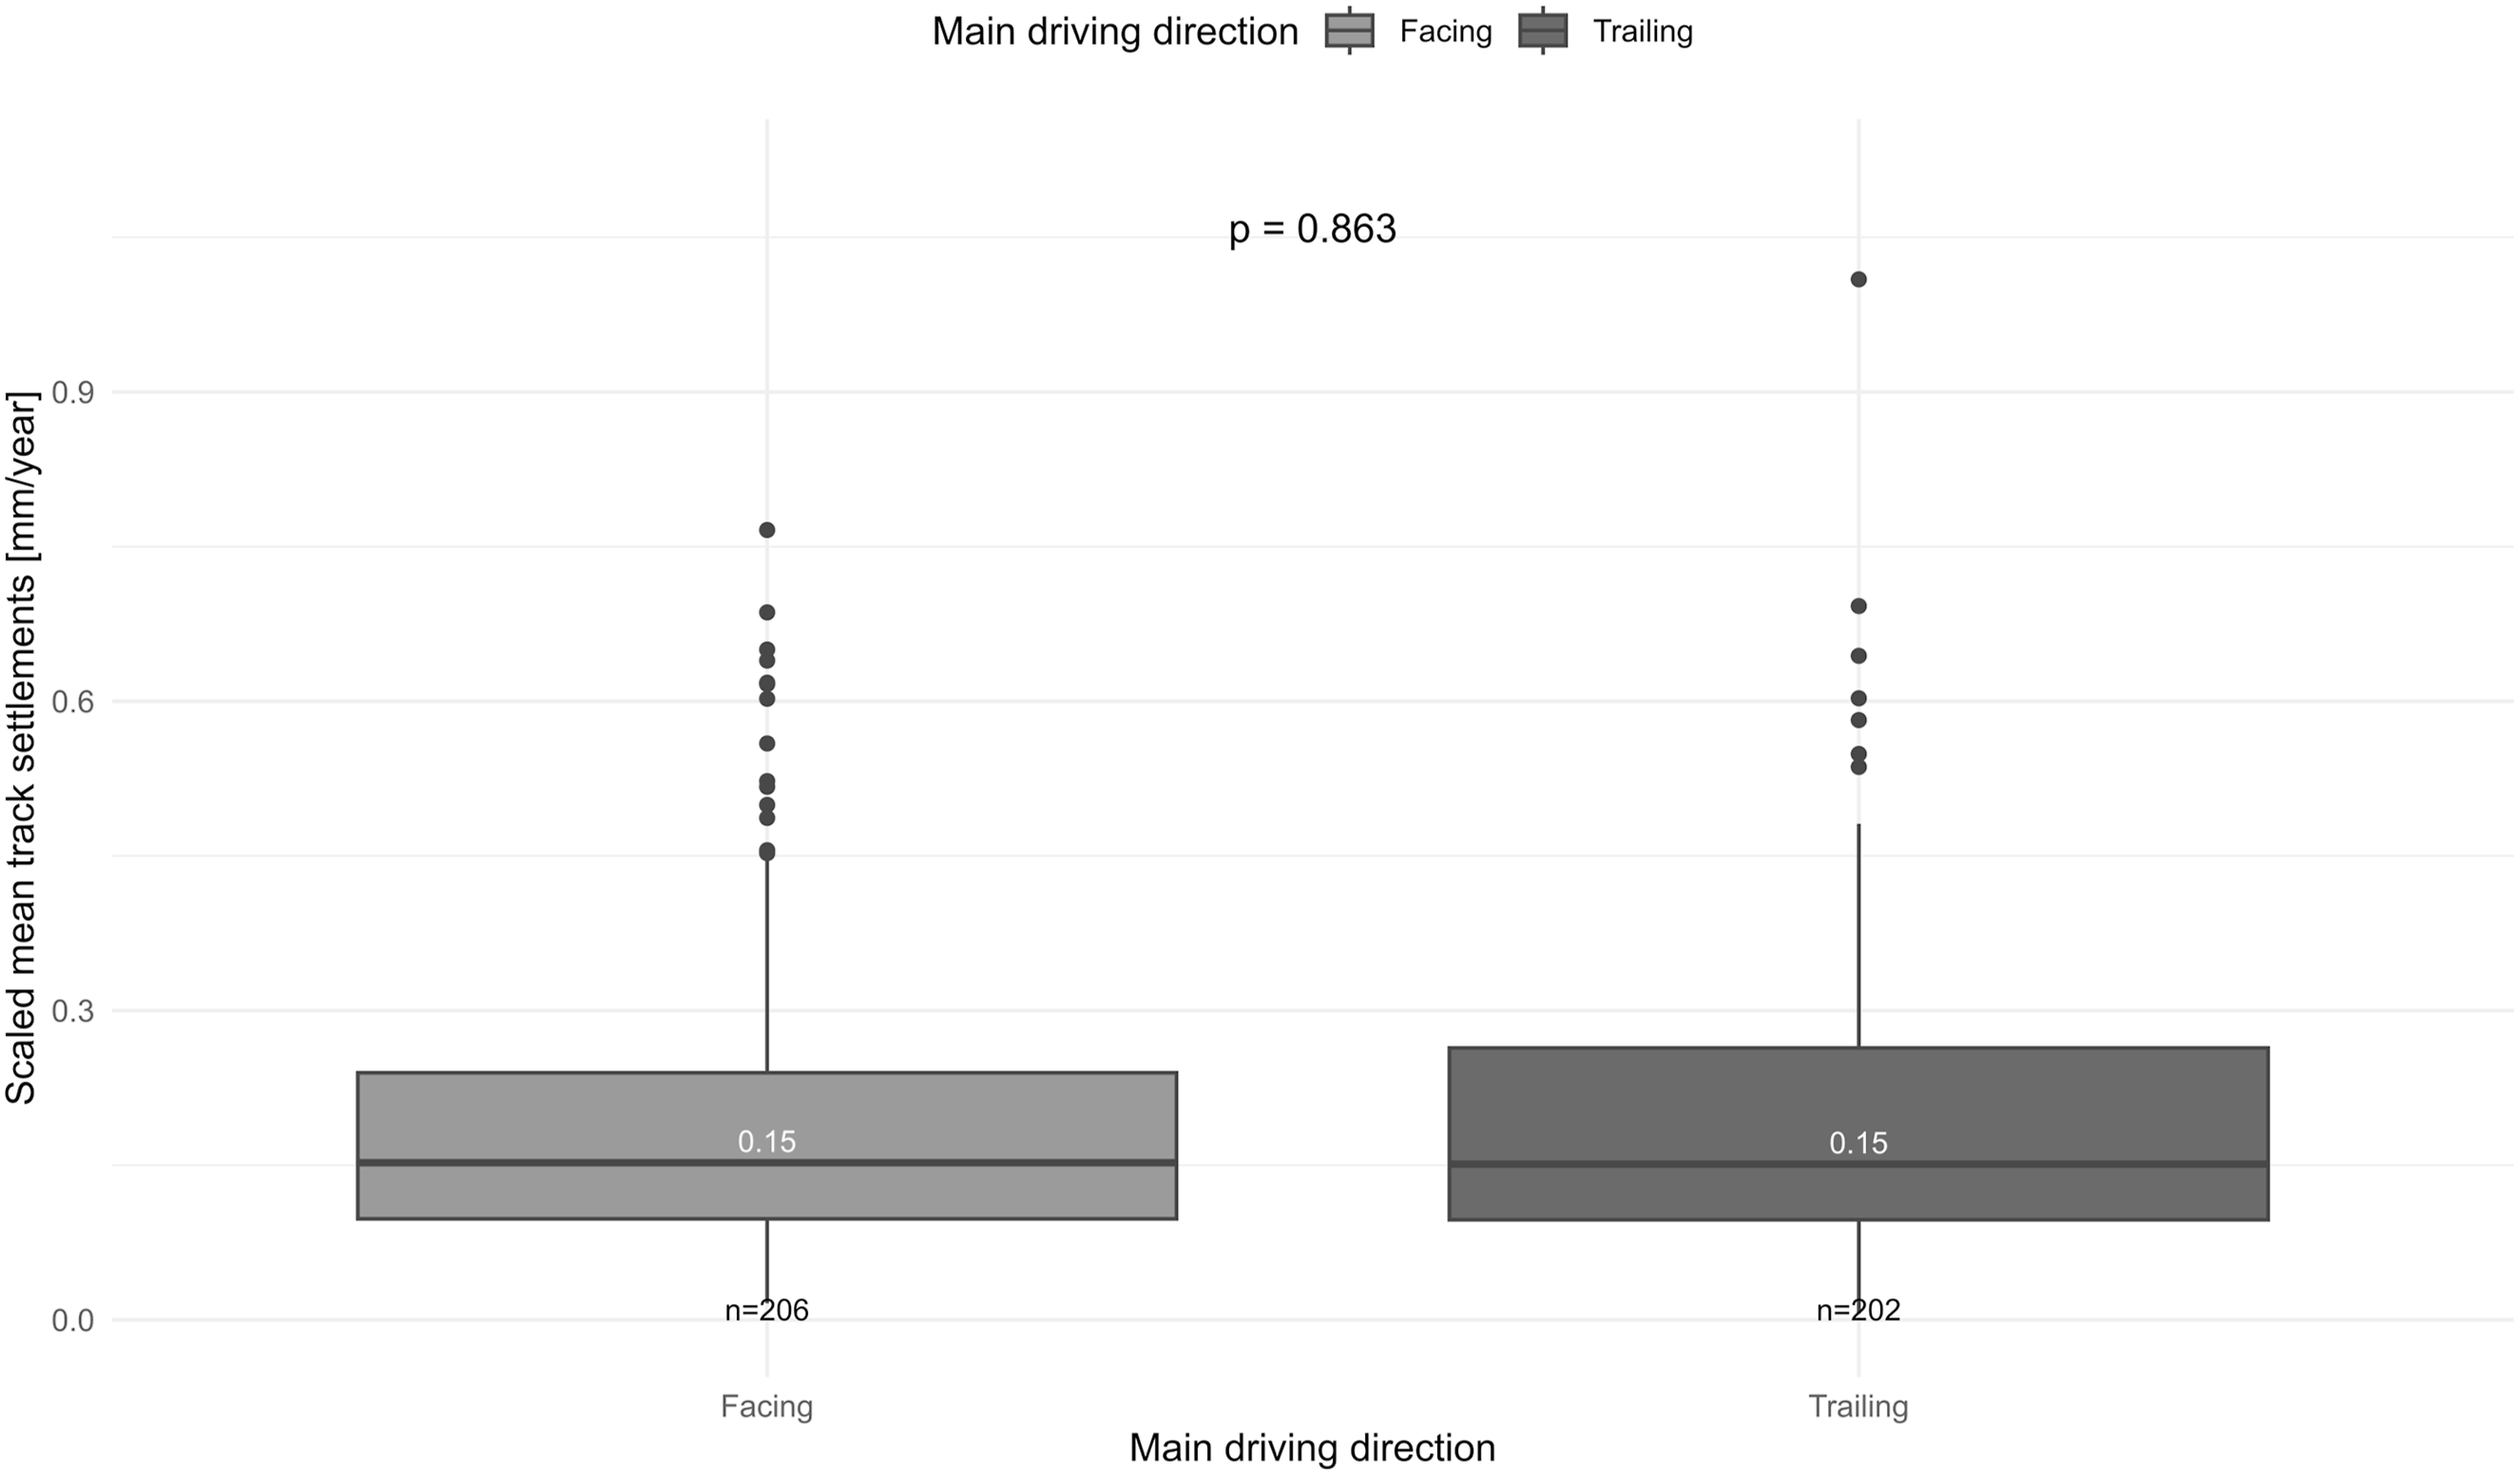
Turnout sleeper type as a dominant feature
Figure 8 presents a comparison between sleepers based on the analysed turnouts. Conventional concrete sleepers exhibit the highest settlement rates of 0.2 mm/year. The median settlement rate for wooden sleepers is 0.17 mm/year, while concrete sleepers with USP demonstrate a settlement rate of 0.1 mm/year, which is 50% of the settlements of conventional concrete sleeper. The results of the Kruskal-Wallis tests confirm the high level of significance for every combination. Also, conventional concrete sleepers show a clearly broader interquartile range than padded concrete sleepers and wooden sleepers. This higher variability of settlement rates indicates that performance is less consistent, with some turnouts exhibiting significantly higher settlement behaviour. Effect of turnout sleeper type on track settlement behaviour.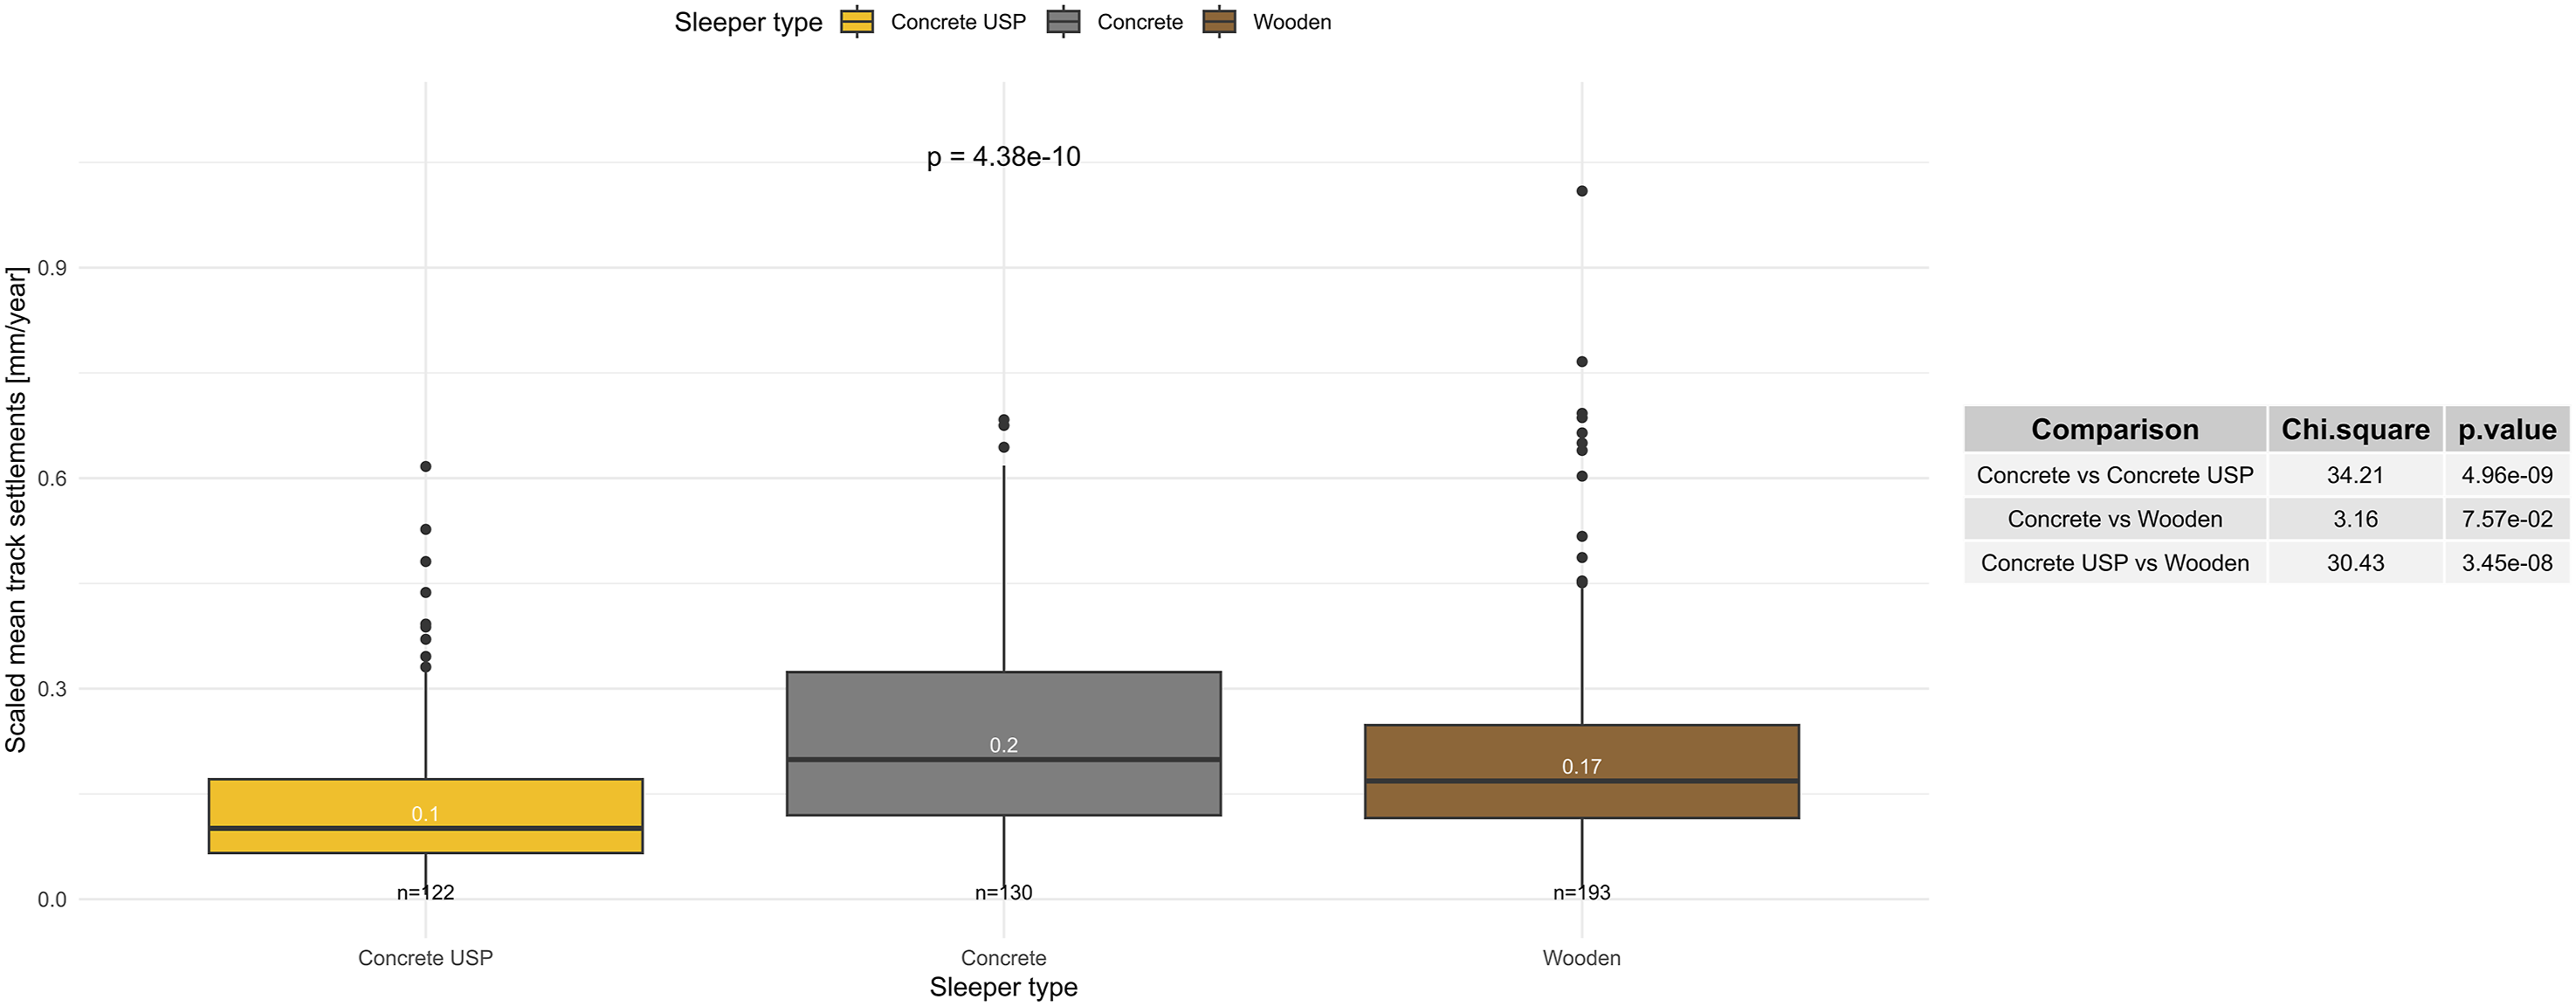
Data subsetting for non-dominant features
In view of the fact that the impact of sleeper type is so dominant, it must be considered for further evaluations. Figure 9 illustrates the impact of turnout radii on track settlements, analogous for every sleeper type. Effect of turnout radii on the rate of turnout settlements.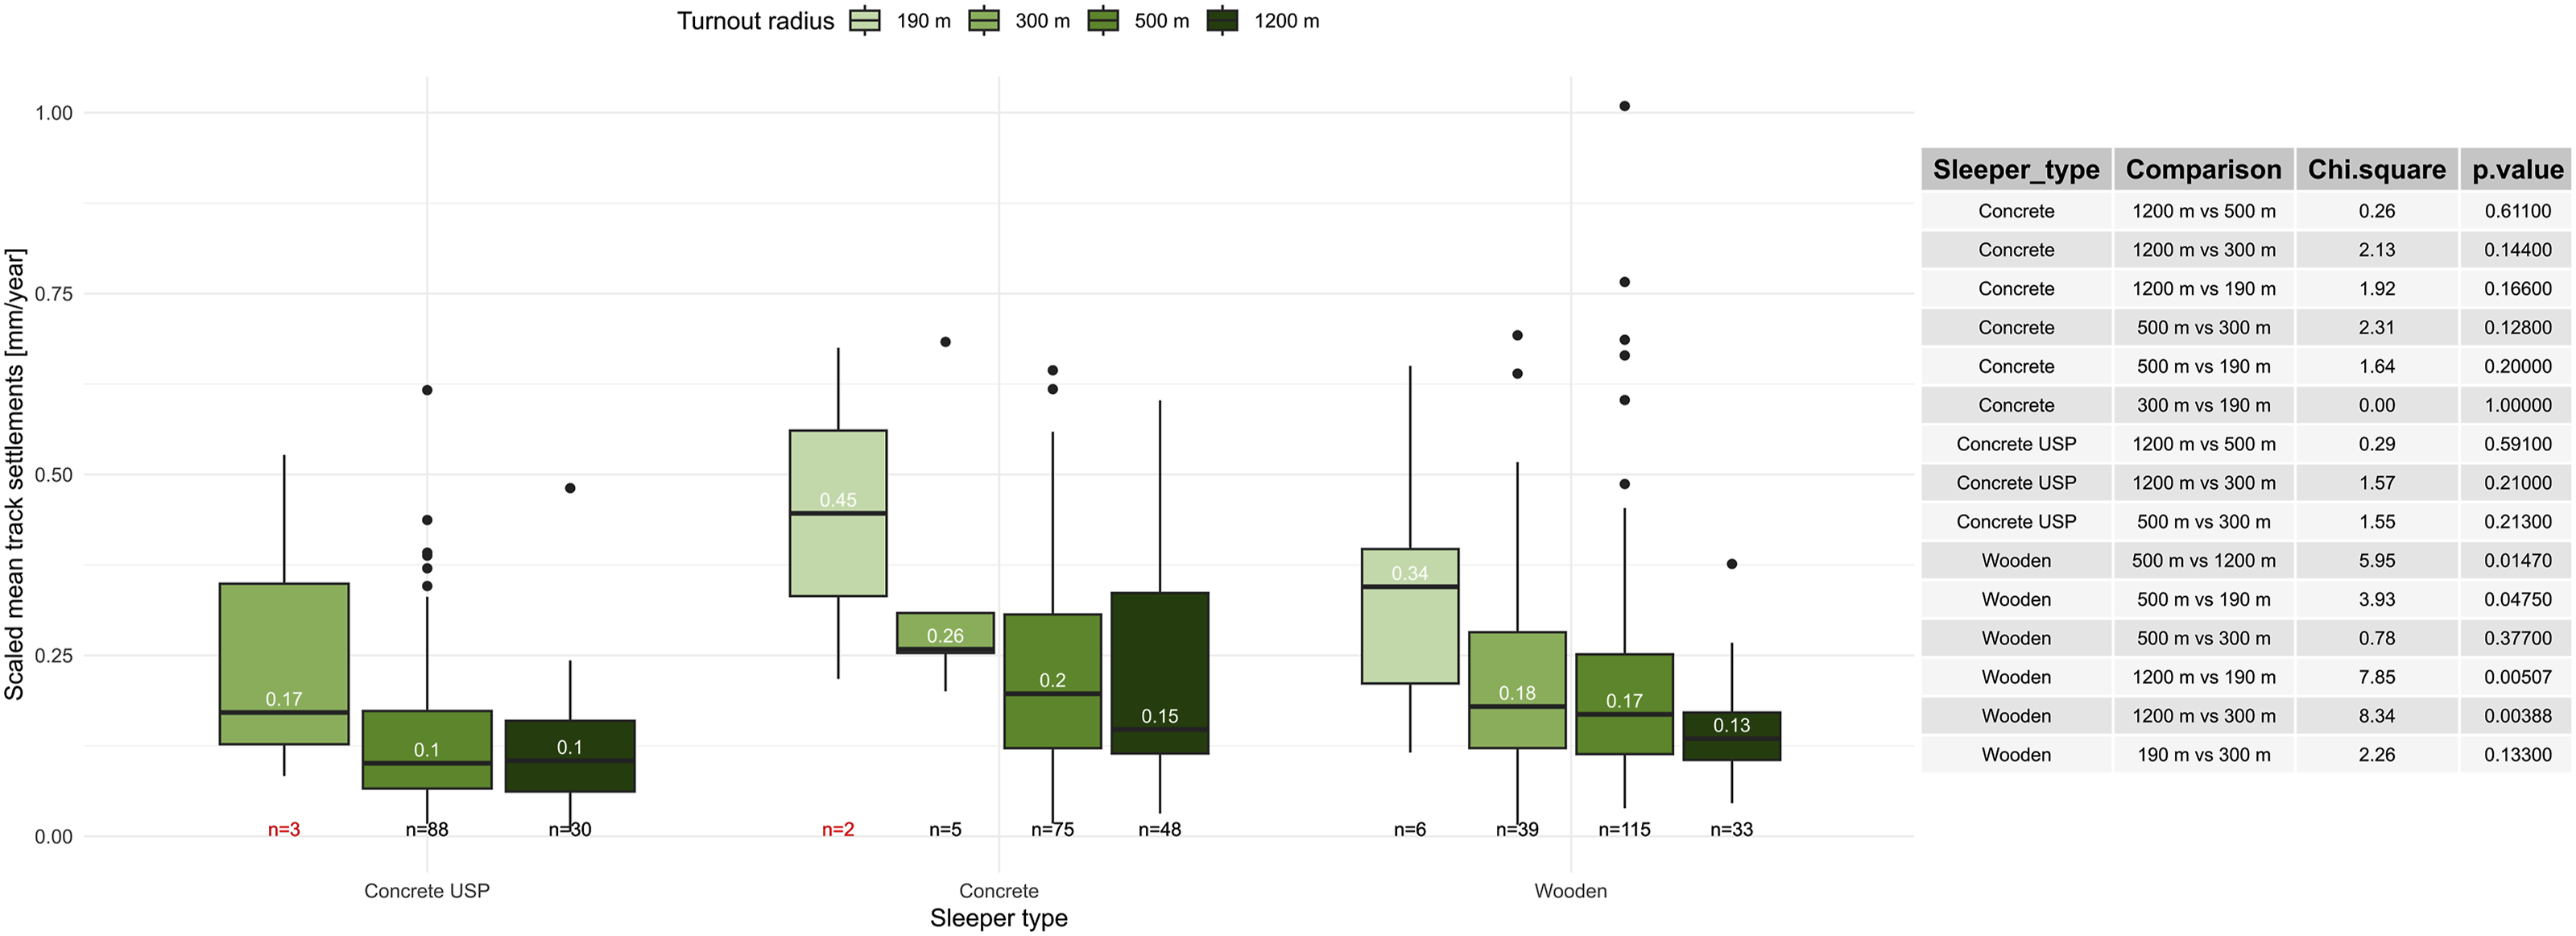
A consistent trend is observed for each sleeper type: turnouts with smaller radii show settlement rates up to three times higher. However, except for wooden sleepers, the statistical metric does not indicate significance, mainly due to small sample sizes — particularly for radii of 190 m and 300 m — a limitation typical of data subsetting. Since small-radius turnouts predominantly consist of wooden sleepers, the larger sample size in this group enables statistical significance to be demonstrated. Pairwise comparisons confirm this pattern, showing near-significant results for concrete sleepers and significant effects for wooden sleepers. While global statistical significance has yet to be established, the influence of turnout radius is highly probable and should be considered in future analyses. Figure 10 illustrates the effect of turnout design on settlements for radii of 500 m and 1200 m. Effect of turnout type on the rate of track settlements.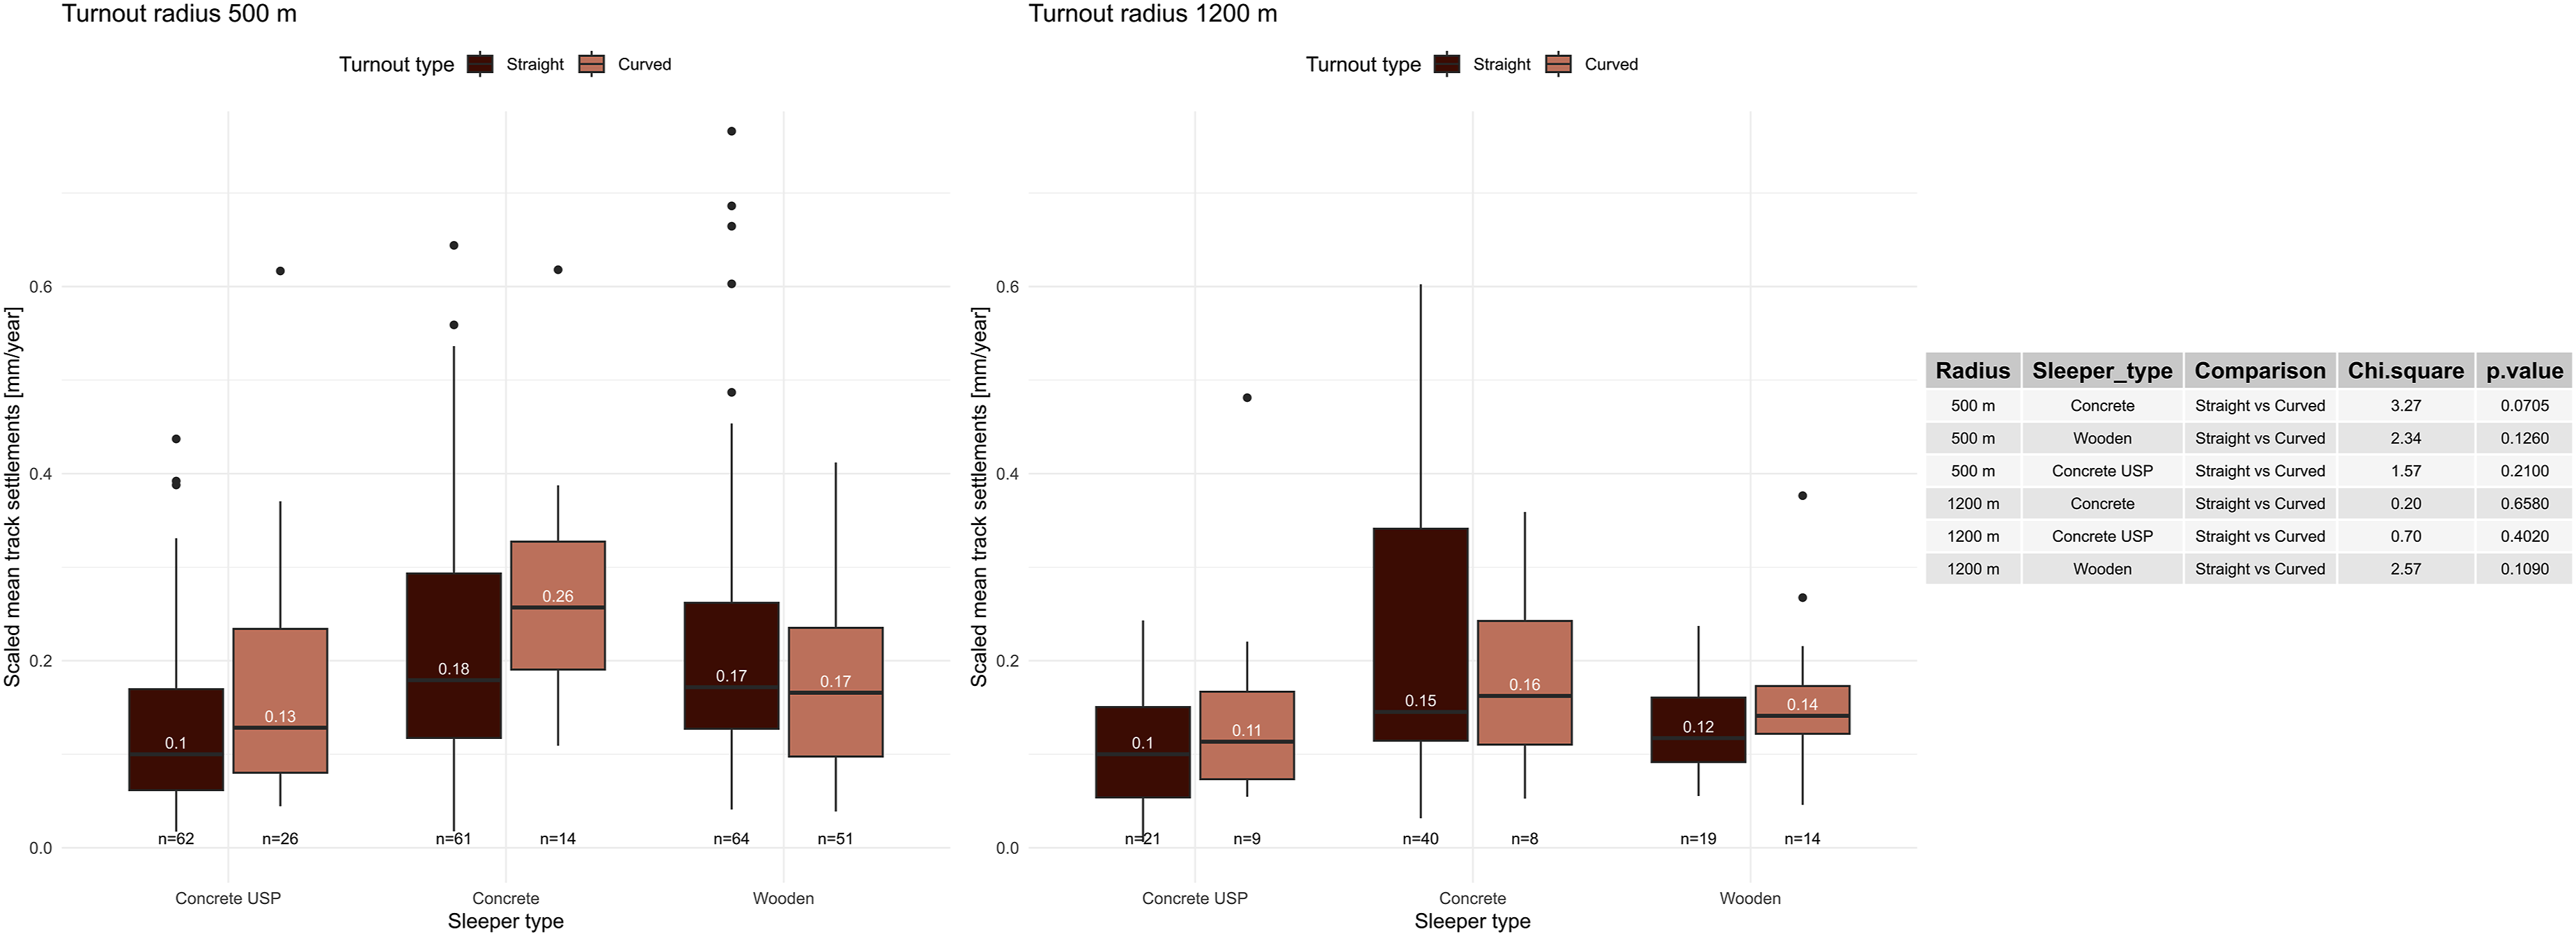
Five out of six comparisons demonstrate that curved turnouts yield about 20% higher settlement rates in comparison to straight turnouts. Wooden sleepers with turnout radii of 500 m are an exception, with equally high settlement rates. Once again, the statistical metric is unable to demonstrate any significant relationship.
Discussion and Outlook
This paper proposes a descriptive model based on track settlements to support turnout design decisions. The approach complements existing simulation-based and mechanistic track deterioration models by providing an empirical, network-scale perspective on turnout behaviour under real operating conditions. Descriptive models for track settlements present two main challenges. (1) Settlement rates are typically not normally distributed, which necessitates the use of non-parametric statistical metrics; (2) turnout features show dependencies to each other. To build meaningful descriptive models, it is essential to consider these dependencies.
As part of this study, we analysed the impact of several key design features, demonstrating the viability of the built model. The results for the features driving direction and sleeper type are clear and statistically valid. Driving direction has no impact on overall settlement behaviour. It should be noted that this may differ for local settlements at the turnout frog position, as the dynamics are influenced by the driving direction in this area. 49 The results indicate a significant impact of sleeper types on track settlements. Padded concrete sleepers have been shown to deliver the best performance; in contrast, conventional concrete sleepers exhibit sub-optimal performance. This result aligns closely with the findings of published research on sleeper behaviour.50,51,52 From an engineering perspective, this result indicates that the selection of padded concrete sleepers can significantly reduce long-term ballast-related maintenance demand. Given that tamping frequency is directly linked to settlement rates, the observed reduction implies a substantial extension of maintenance intervals and associated cost savings. The higher variation of settlement rates observed for conventional concrete sleepers (and, to some extent, wooden sleepers) suggests that these systems are more sensitive to local boundary conditions, such as substructure quality or dynamic loading effects, leading to less predictable long-term performance.
With regard to turnout radius, all sleeper types exhibit higher settlement rates for smaller radii. This can be attributed to the reduced turnout length associated with smaller radii. Although the quality indicator is normalised by length, shorter turnouts contain the same localised inhomogeneities (e.g. frog, sleeper transition zones, switch rail) over a reduced distance, leaving little unaffected track within the turnout. Consequently, average settlement rates are increased. While there may be debate around whether higher settlement rates in shorter turnouts are more detrimental than the moderately lower rates observed in longer turnouts (given that longer turnouts also reduce the proportion of open track), in practice turnout radius selection is governed primarily by operational requirements rather than settlement considerations. Nevertheless, the quantified relationship provides infrastructure managers with a basis for anticipating increased maintenance demand in constrained layouts and for evaluating whether compensatory design measures are justified.
Further results indicate the impact of turnout type on settlement rates. Curved turnouts exhibit approximately 20% higher settlement rates than straight turnouts, which can be attributed to additional curve-induced forces. 56 Although turnout radius is often constrained by operational requirements, the observed increase in settlement rates for turnouts in curves provides a quantitative indication of the associated performance penalty. This enables infrastructure managers to anticipate elevated maintenance needs or to justify the use of enhanced design components in constrained layouts.
The analysed features can be differentiated by the strength of evidence. The influence of sleeper type is a statistically robust result, with clear and significant differences between all groups. In contrast, the effects of turnout radius and turnout type are not consistently statistically significant; however, the observed trends are physically plausible and consistent across independent subsets. In railway engineering applications, statistical significance is not the only criterion for validity, as analyses often rely on small numbers of highly specific, and sometimes non-replicable, cases.53,54,55 Track settlement behaviour is influenced by multiple interacting factors, leading to substantial variability that inherently limits statistical power. In such cases, consistency in observed trends provides supporting evidence of underlying physical behaviour, even in the absence of formal statistical proof.
From the perspective of a decision-support framework, this distinction is essential. While statistically robust results can inform design choices directly, trend-based findings should be interpreted with engineering judgement and, where possible, supported by additional data or complementary modelling approaches. This is particularly relevant for features with weaker effects, as additional conditioning reduces sample sizes, and the influence of remaining dependencies cannot be fully excluded. Accordingly, the results for turnout radius and turnout type should be interpreted with due consideration of these limitations, even though the observed trends are consistent across subsets. Further research is therefore required to strengthen the statistical basis for non-dominant design features and incorporate additional influencing factors. This will enable a more comprehensive and reliable foundation for data-driven decision support to be established Approaches that account for multiple interacting variables simultaneously, such as multivariable modelling, could be a useful addition to the current framework, reducing reliance on extensive subsetting. The development and application of causal modelling approaches is therefore considered a topic for future research.
This study has excluded several potentially significant factors. Loading is only considered using daily tonnage. This is a common approach in the railways. However, it is a clear simplification, given the current state of knowledge on damage caused by different vehicle types. 44 Furthermore, factors such as turnout age and cumulative tonnage, as discussed, are relevant considerations. Different types of ballast and subsoil have different tendencies to settle. 20 Poor substructure condition has been shown to be a key factor in the settlement of tracks and turnouts. 57 Given the absence of data concerning the sub-structure’s condition, the option of consideration was not applicable. The same applies to ballast cleaning, which must be considered for “fair” comparisons. Aside from ballast cleaning, maintenance philosophies in general have a significant impact on track/turnout quality behaviour. 58 The objective of future research is to incorporate all of these influences.
Another potential adaptation of the approach relates to the quality index used for modelling turnout quality behaviour. We decided on track settlement rates based on longitudinal level measurements, as these typically trigger ballast-related maintenance actions like turnout tamping and ballast cleaning, and at the same time are a good indication for the achievable service life of a turnout. A significant proportion of the maintenance and renewal budget can be attributed to these factors. The selection of quality indicators may be made in a different way. Malfunctions resulting in temporal track closures and associated costs of unavailability are a significant concern. 59 The same is true of factors like reliability and maintainability. 60 Furthermore, the performance and maintenance requirements of metal components, such as the frog or the switch rail set, are relevant factors when determining the maintenance budget. The final aim must be to incorporate all these factors. This is best achieved through a life cycle cost approach as discussed by 61 or. 62
Despite its limitations, the model represents a step towards data-driven decision-making in infrastructure management. It provides a foundation for comparing turnout performance using network-specific data, while also facilitating knowledge transfer across different railway networks. On this basis, descriptive models contribute in two ways to the effective use of turnout designs: (1) they provide empirical, network-scale evidence that enables a deeper engineering understanding of turnout behaviour, which can be further refined through more specific descriptive models (e.g. for individual components such as the turnout frog). This evidence can also be used as a reference for simulation tools,63,64 thereby supporting a more detailed and physically grounded analysis of turnout performance; (2) when combined with economic models, they establish a robust foundation for infrastructure managers to make informed and economically efficient design decisions. Both approaches can contribute to reducing long-term maintenance and renewal costs of turnouts.
Footnotes
Acknowledgements
Data provided by OeBB Infrastruktur AG. Open Access Funding by the Graz University of Technology. During the preparation of this manuscript, the authors used ChatGPT (OpenAI, GPT-5.3) and DeepL for language editing and text formulation. The authors have reviewed and edited the output and take full responsibility for the content of this publication.
Funding
The authors received no financial support for the research, authorship, and/or publication of this article.
Declaration of conflicting interests
The authors declared no potential conflicts of interest with respect to the research, authorship, and/or publication of this article.