
Abstract
We evaluated retrospectively an automated method for the separate detection of subcutaneous and visceral fat in the abdominal region by magnetic resonance studies in HIV-positive patients on highly active antiretroviral therapy. The patients were divided into four different groups: lipoatrophy, lipohypertrophy, mixed and the control group. The use of software for the automated detection of abdominal compartment visceral adipose tissue (VAT), total adipose tissue (TAT) and subcutaneous adipose tissue (SAT) was compared to manual evaluation methods (fuzzy C-mean). The results of ROC analysis showed that the parameters, particularly the VAT, are better than the VAT/TAT and at identifying patients with the symptoms of abdominal fat accumulation. A sensitivity of 80.3% and a specificity of 79.5% resulted from a threshold VAT value of >87 cm2. Moreover, the manual evaluation method was shown to provide greater values for VAT and the VAT/TAT ratio than those given by the automated method. In the present study, a rapid MRI protocol for the detection and assessment of the course of lipodystrophy was presented and tested on a group of patients with signs of HALS, as well as on an antiretroviral naïve control group.
Keywords
Introduction
A milestone in the history of acquired immunodeficiency syndrome (AIDS) was the introduction of highly active antiretroviral therapy (HAART). Shortly after the introduction of this highly successful therapy, a syndrome, whose predominant feature is a change in the distribution of fat on the body of the patient, was described. This syndrome manifests itself mainly in a loss of fat tissue in the face and extremities and/or lipohypertrophy of the trunk, or, in rare cases, dorsocervical fat disposition – a so-called ‘buffalo hump’ (BH). This phenomenon is referred to as HAART-associated lipodystrophy syndrome (HALS).
Different methods used in literature to assess the whole fat mass are the body mass index, measurement of the skin-fold, of the extensive body, bioimpedance analysis, dual-energy X-ray absorptiometry and computed tomography (CT).
The aim of this study was to show that magnetic resonance imaging (MRI) is an accurate and sensitive instrument for the diagnosis, description and assessment of the course of this syndrome, which allows accurate differentiation of the individual fat compartments, especially in the abdominal area.
Patients and methods
One hundred and eleven patients presented, as part of the clinical routine, for an MRI scan over 36 months. A group of human immunodeficiency virus (HIV)-positive patients on HAART subjectively reported at least one of the above-described symptoms of HALS; these patients were compared with an HIV-positive, antiretroviral treatment-naïve group. In the latter group, the imposition of initial findings prior to therapy was the clinical question. With the help of information from medical records, the patients were divided into four different groups, similar to the method in a previously published study:
1
Lipoatrophy group: patients exhibiting at least one sign of lipoatrophy, but no signs of lipohypertrophy (Figures 1 and 2). Lipohypertrophy group: patients exhibiting only signs of lipohypertrophy. Mixed group: patients who exhibited signs of both lipoatrophy and lipohypertrophy (Figure 3). Control group: patients who subjectively reported no change in body shape.
The heights and the current weights of the patients were determined. Using a flexible tape, measurements were taken of each patient’s abdominal, hip, and leg circumference according to the guidelines of the World Health Organization (WHO).

This HIV-positive patient receiving HAART developed a clearly protruding dorsocervical fat accumulation. It is striking that the patient, despite massive general obesity, has developed significant lipoatrophy in the cheek area.
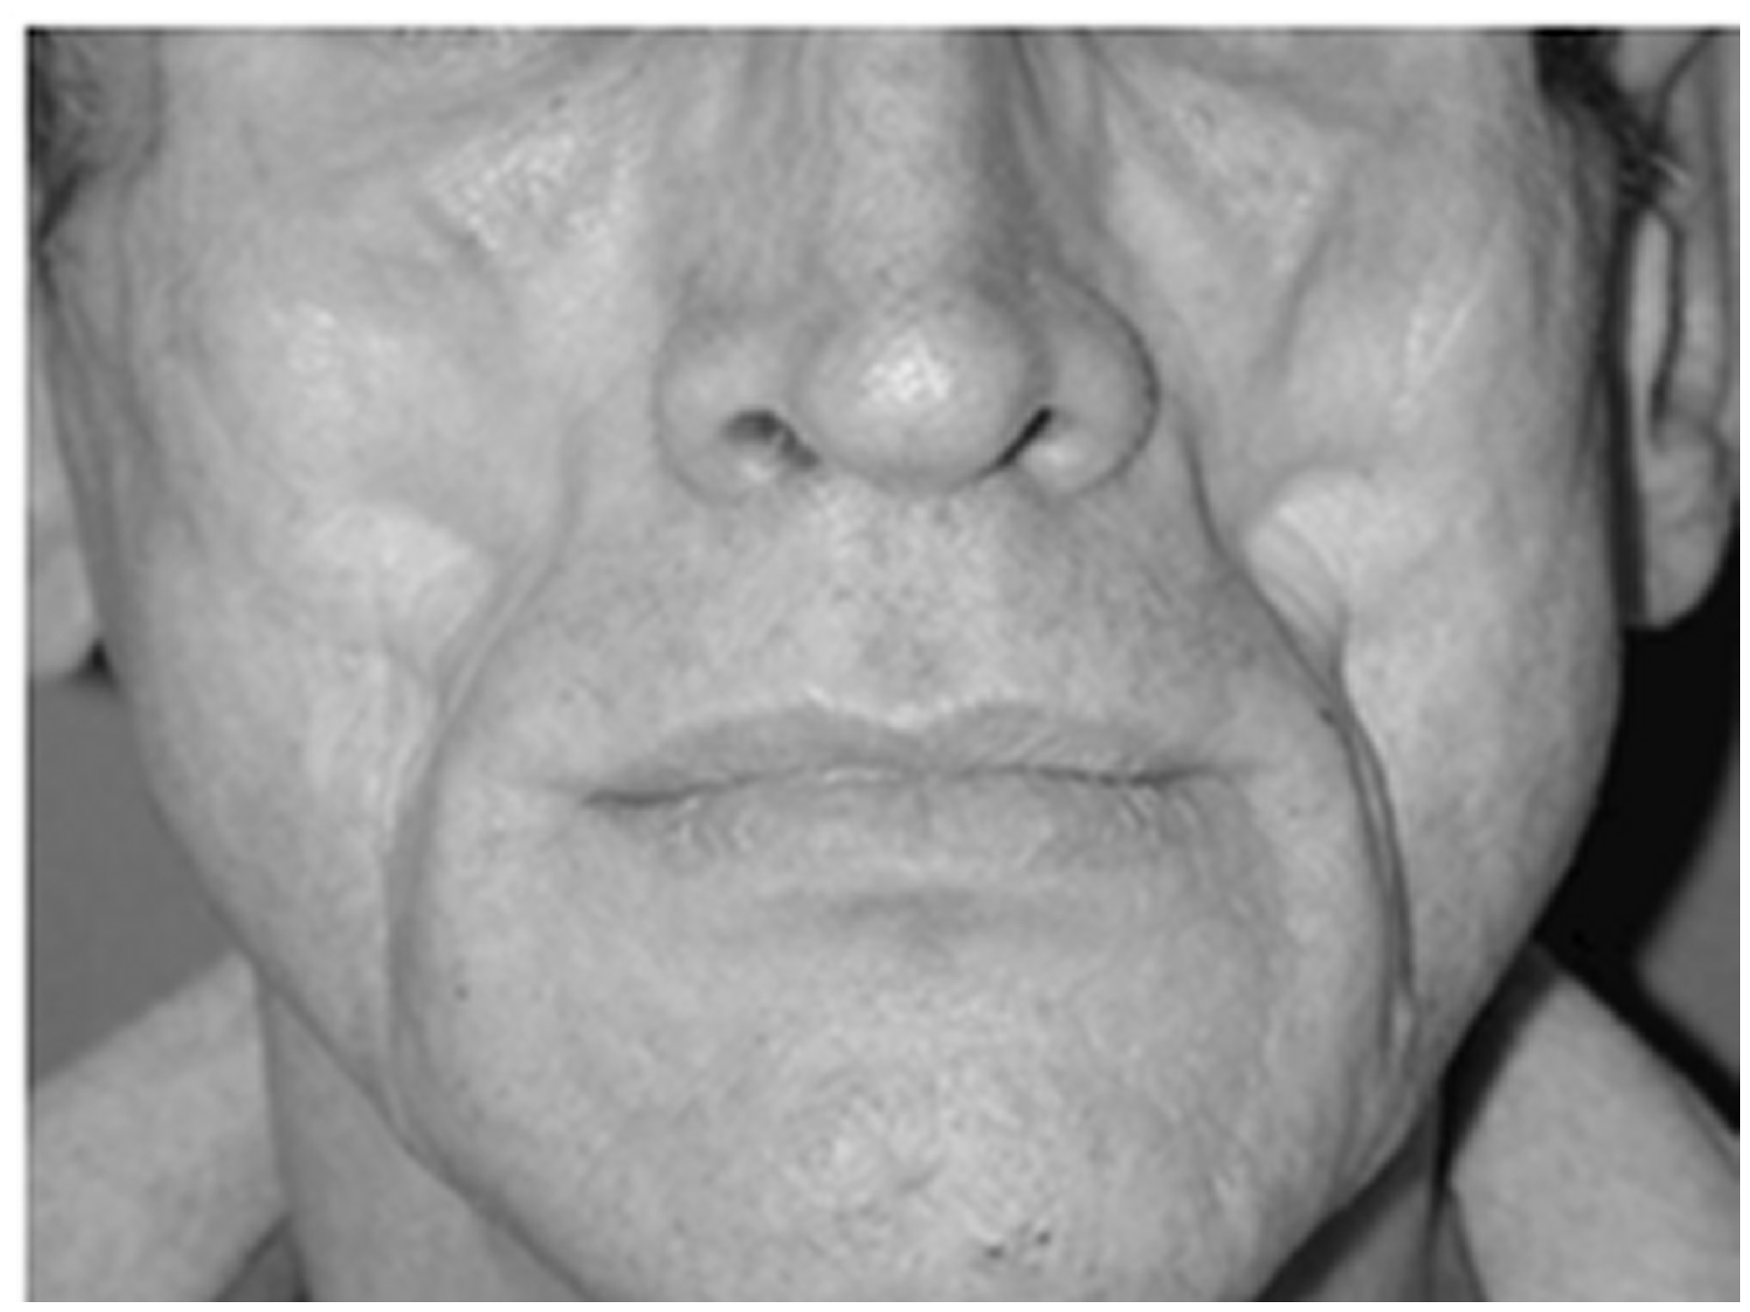
Different graduations of facial lipoatrophy (Graduation 4).
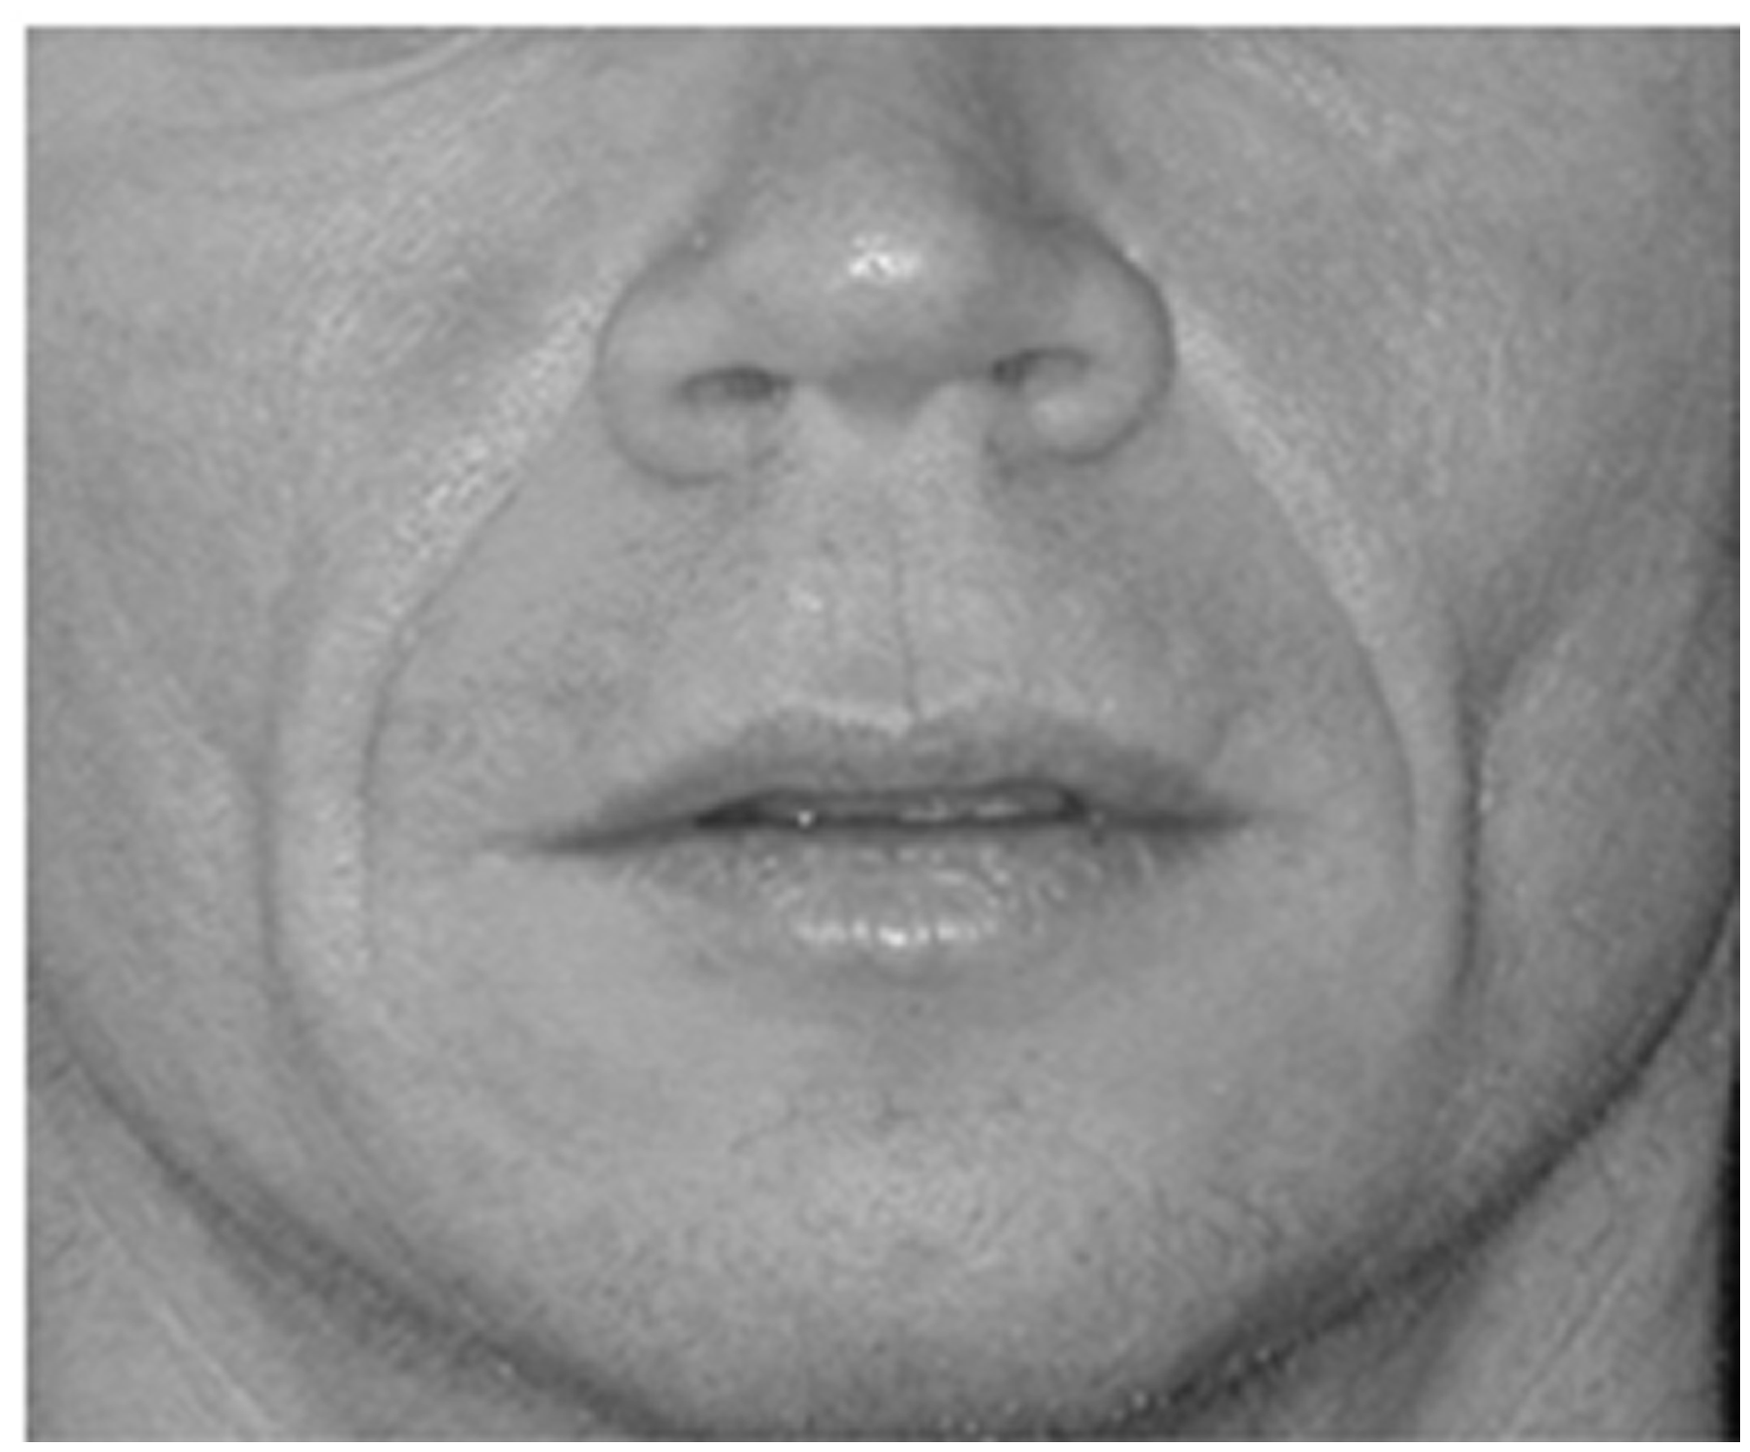
Different graduations of facial lipoatrophy (Graduation 1).
The proportion of female patients was 11% (n = 13). Ninety-three patients (women: 10.8%, n = 10) were included at the time of examination in the HAART group (A), 89 of which subjectively reported having at least one feature of HALS. Eighteen patients (women: n = 3, 16.7%) were antiretroviral naïve at the time of the investigation and reported no changes in body shape (group B). The 93 patients receiving HAART were classified into subgroups based on subjective information about changes in their body fat distribution.
Group A1: Patients with signs of lipoatrophy
This group included 15 patients (18.3% of the total collective), including 3 women patients (18.8%).
Group A2: Patients with signs of lipohypertrophy
This group included 17 patients (20.5% of the total collective), including 2 women patients (11.8%).
Group A3: Patients with mixed syndrome
This group included 46 patients (56.1% of the total collective), including 2 women (4.3%).
Group A4: Patients without symptoms
Four patients (of which one was a woman) subjectively indicated no detected changes. These patients were included in the investigation because a doctor had suspected such a change and sought a review by magnetic resonance tomography.
Patient data
The average age of the total group was 46.15 ± 9.94 years. Patients in group A were 40.75 ± 8.39 years old, on average, compared to 47.19 ± 9.91 years old in the control group. This difference proved to be statistically significant (p = 0.01). Mean height and body weight in group A was 1.77 ± 0.07 m and 80.16 ± 13.37 kg, respectively, and 1.78 ± 0.09 m and 75.82 ± 12.08 kg, respectively, in group B. The group of patients receiving HAART were nearly identical in average height and heavier, on average, than the control group; however, no significant differences were found in terms of both features between the groups (pheight = 0.43, pweight = 0.28).
Performing the MRI scan
All MRI scans were performed on a 1.5 T MRI scanner (Magnetom Sonata®, Siemens, Erlangen, Germany). The image acquisition was accomplished in each case by means of a fast T1-weighted gradient-echo FLASH sequence with a TR/TE (Repetition time/ Echo time) of 110/4 ms. The reproducibility was proven by multiple measurements in one patient.
In various regions of the body, respectively, recordings were created in 10 layers with a thickness of 8 mm in the axial slice orientation. As a point of reference for centering the images in the facial area, the nose bottom edge was used; for the detection of the dorsocervical fat accumulation was equal to the first thoracic vertebra. For detection of abdominal fat, the amount of the fourth lumbar vertebral body was centered. For detection of fat in the thigh, the top layer directly caudal to the gluteal fold.
Evaluation of the imaging-obtained material
Evaluation of the images in the facial area
Because atrophy of the facial fat mainly occurred in the area of the cheeks, a layer located from the caudal nose to the height of the lower edge of the upper jaw was investigated. Each pixel was assigned an intensity value from 0 to above 1000 by the diagnostic reporting. To measure the proportion of fat in an image slice, the corresponding intensity value of all points in a fatty tissue were added. Measurements were given a surface area in centimeter square, which corresponds to the sum of all pixels above the determined threshold value. In the facial area, a specialist tool was used to read the value for the intensity of the current pixel (‘pixel lens’).
Here, the fat with the remaining tissue was compared with respect to the intensity values and the threshold was manually set. With a ‘region of interest’ (ROI) was the delimited field, which included the fatty tissue of interest in the cheek area, to calculate the fat content.
Evaluation of the images in the neck area
Using the sagittal overview, images of the three layers were identified at the height of the vertebral bodies of C7, TH1 and TH2.
By these three transverse slices, the sagittal diameter of the dorsocervical fat at the level of the spinous processes, in centimetres, was determined (Figures 4 and 5).
On the left is the sagittal plane recording. The thickness of the fat layer in an axial section (on the right) from the spinous process of the first thoracic vertebra was determined. Example of a histogram curve of the intensity values of an abdomen image (background noise not shown). The intensity values are on the x-axis, and the number of pixels is on the y-axis. On the left is the “water peak”; on the right is the “fat peak”. This curve was used to determine a threshold value.

Evaluation of the exposures of the abdomen
For the analysis, the film was selected at the level of the navel. For the area within the ROI of this rectangle, a histogram curve was generated (Figure 6). The first peak with lower intensity values represents the ‘water peak’. The second peak corresponds to the ‘fat peak’. The threshold value was determined, which was the first increase in the nearest fat peaks.
Cross sectional image of the femur in a conventional T1-weighted gradient-echo FLASH sequence. The histogram curve shows a clearly definable water and fat peak.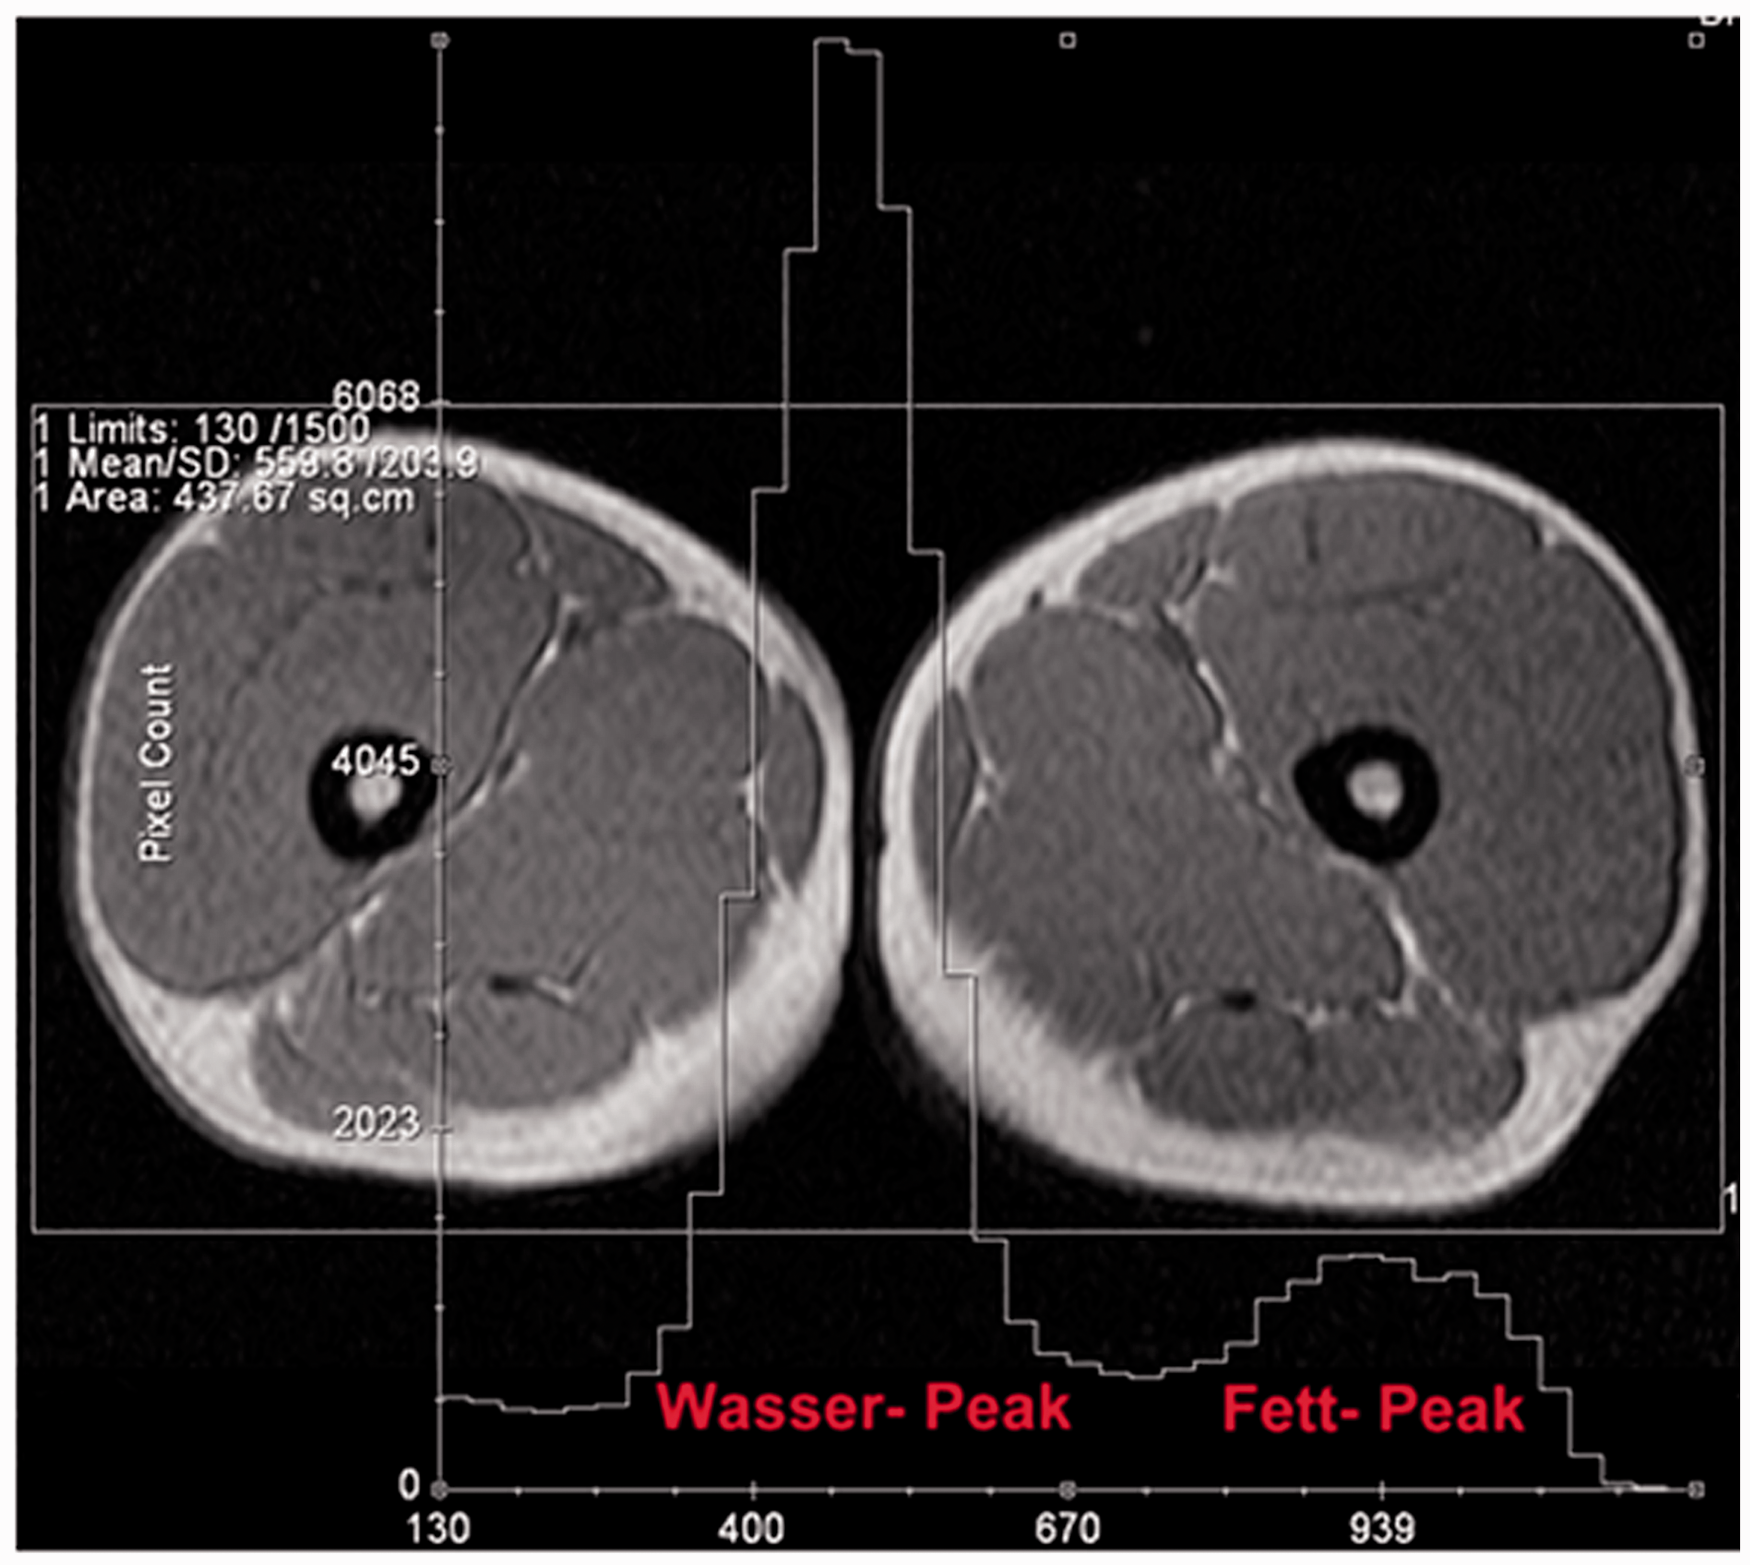
Subsequently, the area of the pixels with intensity above the determined threshold value was determined using the rectangular ROI, corresponding to the area under the curve (AUC) of the histogram between the threshold and the highest intensity value of the evaluated recording. The output value in square centimetres corresponds to the total fat content of the abdomen, and is therefore labeled as total adipose tissue (TAT).
To assess the visceral adipose tissue (VAT), an ROI curve was drawn manually, which surrounded only the area within the abdominal muscles and the spine. Again, the previously determined threshold value was used to determine the fatty tissue within the ROI. In order to determine the area that corresponded to the subcutaneous adipose tissue (SAT), VAT was subtracted from TAT. Also, the VAT/TAT ratio and the VAT/SAT ratio were calculated.
Evaluation of the exposures of the thigh
In the thigh area, all 10 of the gluteal fold caudal-made tomograms were included in the evaluation. To determine the total area of the leg section in each respective layer, an ROI tool was used. The value determined in square centimetres was defined as mean thigh volume (MTV) (Figure 7).
Descriptive statistics
Comparing the group as a whole, the mean and standard deviation was determined for each parameter collected. When analysing the values for the HIV PCR, the median was formed, and also the lowest and the highest values obtained were specified.
Comparative cross-sectional analysis
The statistical analysis was performed using the statistical software JMP (version 3.1.6.2., SAS Institute Inc., USA, 1996). The t-test for unpaired samples was used for comparison. These conditions were not met, and the non-parametric Mann–Whitney U-test for data without normal distribution came from two different collectives used. A p-value <0.05 was considered as significant in the analysis, and a p-value <0.0001 as highly significant. If the p-value was less than 0.1 but greater than 0.05, this was defined as a statistical trend. In order to analyse the values for the HIV PCR statistically, the common logarithm (log10) was used. These values were then compared using the Mann–Whitney U-test.
Determining threshold values based on sensitivity and specificity
To determine for later diagnosis of sharpest possible thresholds, patients were divided into subgroups based on their information. The group of patients who, for example, complained of dorsocervical fat accumulation were compared with the remaining patients without this phenomenon. Subsequently, with the aid of statistical software a list of potential thresholds were created. For each value, sensitivity and specificity was determined based on the patient information on the respective body fat change. A reasonable threshold value was assumed in which the specificity was 80 ± 2% (upper value). The second value was determined at a sensitivity of 80 ± 2% (lower value). This method was based on the consideration that with sufficiently high probability, all patients with a score above the upper value had dorsocervical fat accumulation. Conversely, patients with a score less than the lower value had no buffalo hump with high confidence. The area between the upper and lower value was classified as borderline. In order to validate the accuracy of the assignment by the respective parameter, a receiver operator characteristic (ROC) curve was constructed. For this, the sensitivity was plotted on the y-axis against the value of one for each threshold and specificity was plotted on the x-axis. The AUC is a measure of the accuracy of the diagnostic method. It indicates the probability by which the diagnostic method is able to make the correct diagnosis in every decision. The more sufficient the curve in the upper left corner, the greater the AUC, and more precise are the examined diagnostic procedures. However, if the curve lies exactly on the diagonal line (reference line), then AUC = 0.5. The examined parameters are therefore not better than the random assignment of patients to each group. The specification of the AUC was performed in combination with the associated 95% confidence interval.
Similarly, the measurements were assessed in the area of abdomen. For the thigh area evaluation, the same method was followed with the pertinent evaluation of the previously determined representative layer. The evaluation was also carried out with the statistical software SPSS (version 11.5.0, SPSS Inc., USA, 1989–2002).
Results
A total of 111 HIV-infected patients were studied. The proportion of female patients was 11% (n = 13). Ninety-three patients (women: 10.8%, n = 10) were included at the time of examination in the HAART group (A), 89 of which subjectively reported having at least one feature of HALS. Eighteen patients (women: n = 3, 16.7%) were antiretroviral naïve at the time of the investigation and reported no changes in body shape (group B). The 93 patients receiving HAART were classified into subgroups based on subjective information about changes in their body fat distribution.
Group A1: Patients with signs of lipoatrophy
This group included 15 patients (18.3% of the total collective), including 3 women patients (18.8%).
Group A2: Patients with signs of lipohypertrophy
This group included 17 patients (20.5% of the total collective), including 2 women patients (11.8%).
Group A3: Patients with mixed syndrome
This group included 46 patients (56.1% of the total collective), including 2 women (4.3%).
Group A4: Patients without symptoms
Four patients (of which one was a woman) subjectively indicated no detected changes. These patients were included in the investigation because a doctor had suspected such a change and sought a review by magnetic resonance tomography.
Anthropometric data
Total collective
Comparison of anthropometric data between group A and group B.
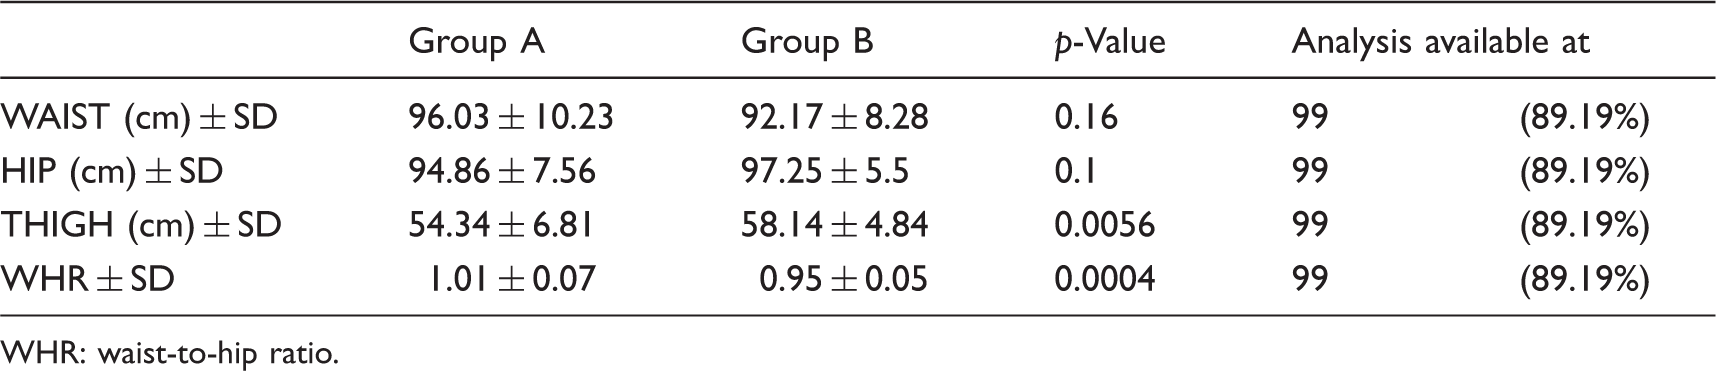
WHR: waist-to-hip ratio.
Subgroups
The t-test was used when comparing group A1 to the control (group B) because, in this case, both the groups were of the same size and the parameters studied showed a normal distribution. Neither body weight nor height differed significantly between the two groups. The symptom of fat atrophy, however, was associated with increased patient age (50.35 ± 9.11 years, p = 0.004).
Waist circumference was 88.00 ± 7.31 cm in group A1, which was slightly less than the waist circumference of group B. This difference was insignificant (p = 0.16). As for the hip and leg circumference values, statistically significant differences were found (HIP: 93.04 ± 4.84 cm, p = 0.04; THIGH: 50.38 ± 6.35 cm, p = 0.0006). Both the values were less in group A1 than in the control group. A comparison of patients who reported symptoms of fat accumulation (i.e. an increase in waist circumference and/or a bull neck; group A2) with the antiretroviral naïve control group showed the following results: with regard to age and height, no statistically significant difference was identified, although group A2 was significantly heavier and had a higher BMI than the control group (88.15 ± 16.23 kg, p = 0.02; 26.73 ± 3.18 kg/m2, p = 0.008).
The values for the waist, hips and leg circumference were 103.5 ± 11.87 cm, 99.47 ± 9.32 cm and 61.33 ± 8.11 cm, respectively. Compared with the values for these parameters in the control group, statistical significance was found only for the waist circumference (pWAIST = 0.003), which was significantly greater in group A2 than in the control group. No difference between the groups could be determined in hip and leg circumference (pHIP = 0.4, pTHIGH = 0.17); however, the difference in WHR of both groups was clearly significant (1.04 ± 0.06 in group A1 and 0.95 ± 0.05 in the control group; p < 0.0001).
Comparison of the subgroups of patients receiving HAART (A; defined above) to the naïve control group (B) with respect to the anthropometric parameters. The p-values refer to the comparison of the current sub-group with group B.
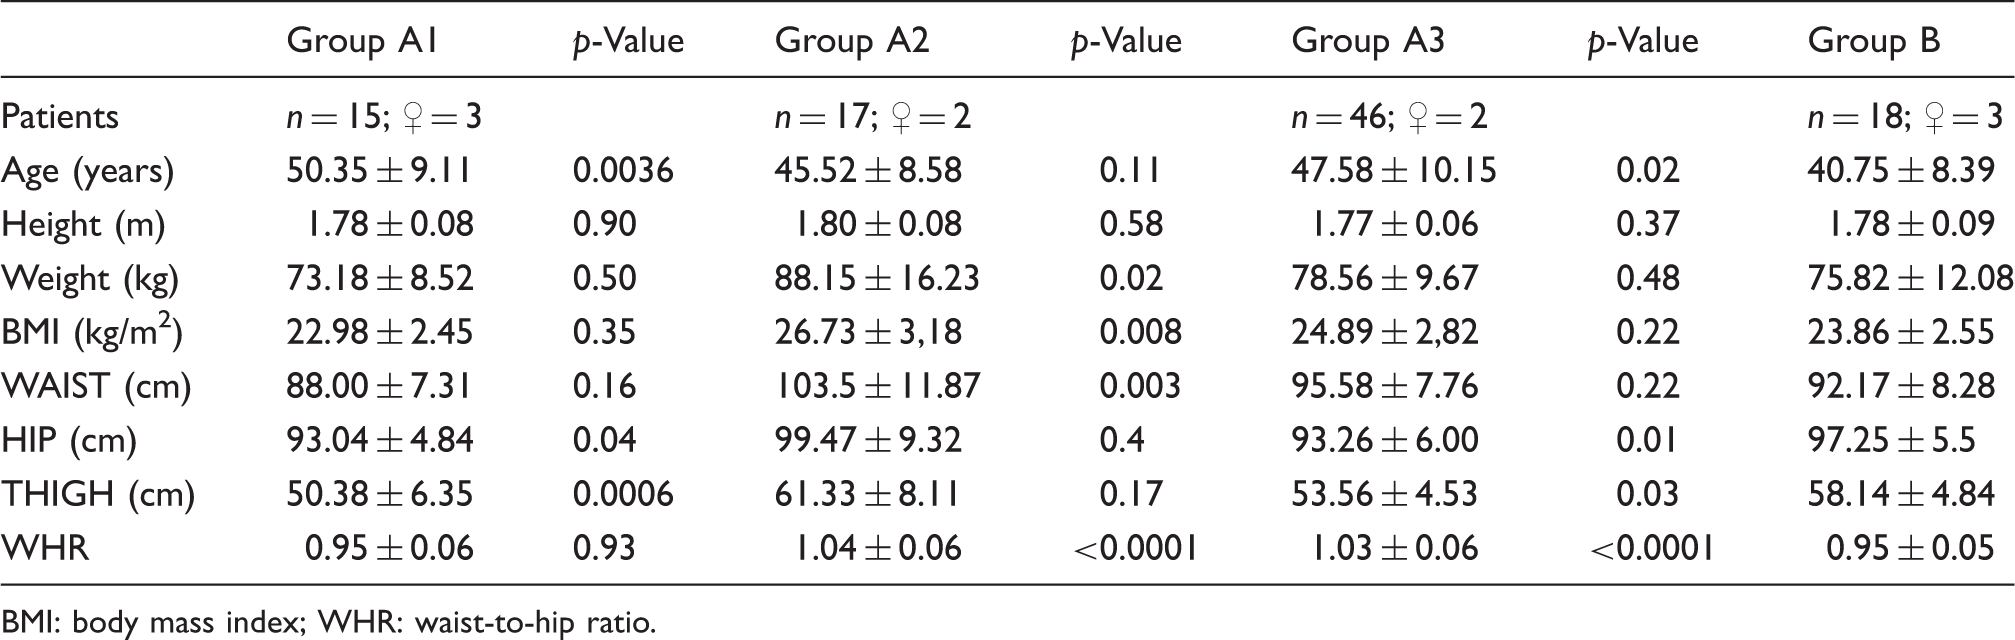
BMI: body mass index; WHR: waist-to-hip ratio.
The results of ROC analysis in our own work show that the parameters particularly the VAT are better than the VAT/TAT and, to identify patients with the symptoms of abdominal fat accumulation. A sensitivity of 80.3% and a specificity of 79.5% resulted from a threshold VAT value of >87 cm2.
Discussion
A study published in 2005 by Mallon et al. 2 was based on two cross-sectional analyses (the patient cohorts of the ‘Lipodystrophy Case Definition Study Group’, or LDCD, and the ‘Australian Lipodystrophy Prevalence Survey’, or APS) and identified clinical factors using statistical methods, which were associated with the development of a BH. In the LDCD group, the prevalence for a BH was 19%, while the prevalence was 2% in the APS group. Mallon et al. could prove that a BH in patients with lipodystrophy was mainly associated with hyperinsulinemia and insulin resistance, elevated blood pressure and HAART. 2
With the help of cross-sectional imaging such as CT or MRI, significantly higher levels of visceral adipose tissue (VAT) were measured in the context of HAART-associated abdominal lipohypertrophy compared to control groups. 3 Of course, one must consider the question of a useful threshold of VAT/TAT ratio for the diagnosis and quantification of visceral fat accumulation.
In our work, a specificity of 79.5% was reported for a threshold of VAT/TAT of ≥0.4. In a pilot study by Tirkes et al., 4 two groups of male patients were compared with regard to VAT and VAT/TAT ratio. Group 1 included only cardiovascular-predisposed patients, i.e. patients with conditions after myocardial infarction, coronary artery bypass graft surgery or coronary stent implantation. These patients were compared with a control group, which was not cardiovascular-predisposed and, with respect to common parameters such as like body weight, did not differ significantly from the control group. The fact that the two groups are different in terms of age cannot be explained.
It is not surprising that, even here in the preloaded group, a higher VAT/TAT ratio could be determined. Also, in this study, a ROC analysis was performed to evaluate the diagnostic value of the VAT/TAT ratio; for a threshold value of >0.4, this analysis resulted in a sensitivity of 91%. The determination of abdominal size resulted in a lower selectivity for the assignment of patients to each group compared to the parameters of VAT and TAT. These results clearly show that a three-dimensional image procedure like MRI is best placed to evaluate fat accumulation. Information of patients about the development of an already existing symptom does not always correlate with objective measurements. 5 So far, dual energy X-ray absorptiometry (DEXA) scans are used mainly in clinical studies for the evaluation of fat content in the extremities. 6 This technique is currently the gold standard, although it is associated with some disadvantages. Although radiation exposure to the patient is relatively low, the duration of a full body DEXA scan is, on average, 10–30 min, depending on which system is used. Moreover, results of DEXA scans that were created with different devices have been shown to be incomparable in some cases. 7
Another disadvantage lies in the fact that DEXA scans on abdominal fat content cannot differentiate naturally between VAT and TAT. In some clinical studies, 8 an MRI-based system was used to evaluate the fat content of the extremities in addition to the routine use of DEXA scans. While traditional DEXA scans and MRI gave equivalent results, these studies concerned only cross-sectional studies, and proof of whether MRI is also suitable for monitoring the progress of the leg fat content was not previously provided.
For the ninth layer distal to the gluteal fold, a threshold of 12 cm 2 with a sensitivity of 74.1% and a specificity of 76.3% was determined. After including the readings of all 10 radiographs in the ROC analysis, no relevant improvement of the estimate was shown. Therefore, one may assume that in terms of a rapid evaluation, the measurement of a representative layer is sufficient to detect lipoatrophy in the leg.
The prevalence of HALS within the population of HIV-infected patients treated with HAART ranges from 2% to 84%. 9 One goal of this work was to find a threshold that effectively separates patients with facial lipoatrophy from those without complaints. So far, the facial lipoatrophy was almost exclusively diagnosed by subjective means. Very often, different scales were used which again revealed the severity of the phenomenon. 10
In our study, a significant difference was shown between the two groups in the comparison of the area of fat in a transverse section at the level of the upper lip. To minimise the risk of false-positive measurements, a threshold of ≤6.0 cm2 was chosen; here, the specificity of the method was as high as 82%. For a threshold of ≤7.4 cm2, sensitivity and specificity were approximately equal (73.3% and 70.9%, respectively).
A similar approach to the problem, by means of CT analysis, was previously described. 11 For distinguishing between both groups, a threshold of ≤2.34 cm2 area of fat tissue was determined, with a sensitivity and specificity of 71%. In order to facilitate comparison with our study, which used bilateral measurements, this value must be doubled. Therefore, the thresholds are of comparable size (≤4.7 cm2 vs. ≤7.4 cm2 in our study). The differences may be explained by device-specific characteristics. The advantage of measurement by CT is the fact that the thresholds for detection of the fat tissue by the Hounsfield units are set from the beginning, which excludes a potential point of failure from the outset. An MRI-based system to specifically diagnose degree of lipoatrophy was presented in Singapore. 7 Here, fat volumes were measured in various regions of the face, i.e. the temple and cheeks, the periorbital region and the orbit itself, as well as the buccal fat either individually, or added to a total volume of fat, and compared with an asymptomatic control group. Between the groups, significant differences were strong.
The authors of this study investigated whether the fat content in the cheek area correlated with the entire superficial facial fat volume, and in patients with lipodystrophy, a strong correlation (r = 0.92, p < 0.001) was found. Another advantage of our method is the extremely short measurement time of only 35 s (planning and recording). Also, the body coil is used for measuring; therefore, a continuation of the study in other areas of the body (e.g. abdomen, legs, etc.) without changing the coil and the associated time loss is possible.
Another aim of this study was to describe, for the first time, tangible thresholds for the evaluation and assessment of the course of dorsocervical fat accumulation. The diagnosis of ‘buffalo hump’ was exclusively found in many clinical studies published to date. 12 Dinges et al. 3 reported a statistically significant difference (4.5 ± 2.2 cm vs. 2.1 ± 0.7 cm, p = 0.005) in a very small group of patients (n = 26). Also, the present work has shown a similar result for a group size of 100 patients (3.9 ± 1.84 cm vs. 2.3 ± 1.4 cm, p = 0.0003). For a threshold value of ≥3.2 cm, specificity in our patient population was 78.5%.
Conclusion
In the present study, a rapid MRI protocol for the detection and assessment of the course of lipodystrophy was presented and tested on a group of patients with signs of HALS, as well as on an antiretroviral naïve control group. The results of the studies showed a good correlation of the measured values with the subjective data of the patients. The sensitivity and specificity of the method was determined for each area individually with a ROC analysis, through which workable thresholds for the adoption of an appropriate fat redistribution could be proposed.
Footnotes
Declaration of Conflicting Interests
The authors declared no potential conflicts of interest with respect to the research, authorship, and/or publication of this article.
Funding
The authors received no financial support for the research, authorship, and/or publication of this article.