



Abstract
The purpose of this study was to exam the impact of type 2 diabetes mellitus (T2DM) on CD4 cell count trends in adults with HIV. In a longitudinal retrospective study in an urban primary care HIV clinic in the southeastern United States from 2010 to 2012, patients with HIV medical charts were audited to obtain their CD4 cell count, diabetes status, weight, and demographic information. Rates of increase of CD4 T cell count (i.e. slopes) were obtained using a linear mixed-effects model. Most of the HIV–T2DM cohort (n = 262) and HIV-only cohort (n = 2399) were African American (76%) and male (77%). The CD4 T cell counts were consistently higher in the HIV–T2DM cohort (p < .0001). The mean rate of CD4 T cell count increase (mean ± SE) was 63 ± 9 cells/µl/year in HIV–T2DM African American women and 28 ± 7 cells/µl/year in HIV–T2DM African American men (p = 0.003). In the multivariable slope analysis, the CD4 T cell count increase was significantly faster for HIV–T2DM African American women than for all other patients (mean difference = 30/cells/µl/year, 95% CI: 13–47; p < 0.001). Gender, race/ethnicity, and the diagnosis of diabetes influenced the recovery of CD4 cell counts.
Background
Today patients with HIV are living longer lives, 1 thus, their comorbid conditions are an increasing healthcare concern. 2 Sixty percent of persons living with HIV over age 50 have a comorbid diagnosis. 3 Especially in older persons living with HIV, type 2 diabetes mellitus (T2DM) is one of the most often diagnosed comorbid conditions, 2 and persons with HIV have a higher incidence rate of T2DM than their seronegative counterparts.4–6 This increased risk is due in part to the toxicity of HIV treatment which can lead to mitochondrial damage that interferes with glucose uptake in cells. 7
The comorbidity of HIV and T2DM (HIV–T2DM) can be especially damaging, because both conditions increase inflammation in the body. When compared to persons living with HIV (PLWH), PLWH and a dual diagnosis of diabetes (PLWH–T2DM) have significantly higher incidence of neuropathy, hypertension, renal disease and cardiovascular disease.8,9 Even with the use of antiretroviral therapy, HIV causes increased inflammation through the secretion of pro-inflammatory cytokines that damage CD4 cells, and such chronic inflammation can have profound effects on the body, including cardiovascular damage.10,11 In addition, T2DM causes a low-grade systemic inflammation, caused by macrophages accumulating in adipose tissue mediating inflammation in conjunction with adipocytes which promotes insulin resistance.12,13 Persons with DM also have increased levels of cytokines, which regulate HIV replication and can destroy T cells as part of the temporal cascade triggered by expanding adipose tissue.14,15 In persons living with HIV–T2DM, immune systems are continually stimulated, and even more so if those diseases are uncontrolled. Long-term control of both diseases is therefore essential for decreasing morbidity and mortality.
The World Health Organization, which plays a key role in monitoring HIV progression, recommends using the CD4 T cell count as a marker for immune system health. 16 Many variables can negatively impact immune recovery including antiretroviral therapy (ART) regimen, pre-ART immune function, and comorbid hepatitis C status.17–19 A higher body mass index (BMI, calculated by weight and height) can be protective in persons with HIV and improve immune recovery compared to those with lower BMI.20–22 However, higher BMI is associated with glucose intolerance and the development of diabetes. 23
Though CD4 is routinely used to monitor HIV, it is not used to monitor DM. Although DM can negatively impact the immune system it is through a different mechanism than T cells. 24 Ledergerber et al., 25 in a cohort of Swiss adults with HIV, reported lower CD4 cell count nadirs in persons diagnosed with DM when compared to persons without DM. However, new onset of DM was not associated with the CD4 cell count.5,6
Despite the generally accepted higher incidence of DM in the HIV population, less is known about the influence of DM on immune recovery and CD4 cell count trends in patients with HIV–T2DM as compared to those with HIV only. The purpose is to compare the pattern of increase in CD4 T cell counts between the HIV–T2DM and HIV-only groups and to compare changes in CD4 cell counts between men and women within the subset of African American HIV-infected patients over the three-year time period.
Method
This study was a retrospective chart review of longitudinal data of a convenience sample collected between the years 2010 and 2012. All patients received care at a large urban Ryan White funded clinic in the southeastern United States that cares for patients with HIV/AIDS. The majority of the patients at the clinic were African American men. The study was deemed exempt by the associated university institutional review board because patients in the database were deidentified. Data extraction was conducted by a data analyst not associated with the study, using the Electronic Privacy Information Center electronic medical record system records used by the clinic. As this is a deidentified chart audit, many factors were undiscoverable, such as CD4 cell count nadir, or date of diagnosis of HIV or T2DM.
The patient cohort consisted of adults older than 25 years who had received ART for at least six months, divided into two groups: HIV-infected patients with DM (HIV–T2DM), and HIV-infected patients without T2DM (HIV only). The HIV-only group had no ICD-9 code indicating a DM diagnosis. Gestational DM was excluded. Diabetes mellitus was defined by the ICD-9 code plus at least one HgA1c. First entry into the data set for each patient was considered baseline. Since ICD-9 code can be inaccurate, 26 we limited the code to diabetes mellitus specific (ICD 250) and not abnormal glucose (ICD 790.2).
The primary outcome for this study was CD4 T cell count. Because the patients’ numbers of clinic visits per year varied, we collapsed the unit of time into intervals of six months to represent the largest number of patients at each time point. Demographics included age, weight, and race. The race variable was constructed by dividing patients into African American and non-African American. Height was rarely noted in the chart, so BMI could not be calculated, a limitation of this study.
Analysis
Repeated measures analyses were used to analyze CD4 T cell counts using a means model via the SAS MIXED Procedure (version 9.4; SAS Institute, Cary, NC), providing separate estimates of the means by study group (HIV–T2DM or HIV only) and months of follow-up (six time intervals: baseline, 1–6, 7–12, 13–18, 19–24, and 25–31 months). A compound-symmetric variance–covariance form in repeated measurements was assumed for the CD4 cell count, and robust estimates of the standard errors of parameters were used to perform statistical tests and construct 95% confidence intervals. 27 Model-based means are unbiased with unbalanced and missing data, as long as the missing data are noninformative (missing at random). Predictors included in each model were study group, follow-up interval, and the interaction between study group and follow-up interval (Model 1). All specific statistical tests were done within the framework of the linear mixed-effects model, using t tests to compare differences between the model-based means (least squares means). Specific tests of interest for Model 1 included the difference between HIV–T2DM and HIV only at each follow-up interval. The results were summarized with adjusted means and 95% confidence intervals by study group and follow-up interval. Statistical tests were two sided and unadjusted for multiple comparisons. A p value ≤.05 was considered statistically significant.
Similar repeated measures analyses were done separately for the subset of 211 HIV-infected African Americans who were diabetic at baseline and the subset of 1800 HIV-infected African Americans who were not diabetic at baseline (Model 2). A multivariable repeated measures analysis was also performed for CD4 cell count, adjusting for gender, follow-up interval, the interaction between gender and follow-up interval, age at baseline, and weight at baseline.
Rate of increase of CD4 T cell count (or mean slope) was obtained using a linear mixed-effects model specifying CD4 T cell counts follow a linear regression over time, with random slope and intercept for each patient (Model 3). Sixty-nine patients with only one CD4 value were excluded from the slope model. Two slope models were fit. The first slope model included three predictors (study group, years on study, and the interaction between study group and years on study). The statistical test for interaction between years on study and study group was the primary overall hypothesis test to determine whether CD4 T cell counts in the two study groups changed in significantly different ways during follow-up (i.e. different temporal patterns over time). The second slope model (multivariable model) included six predictors: Study group (HIV–T2DM women and men and HIV-only women and men), years on study, the interaction between study group and years on study, race, age at enrollment, and weight at enrollment.
Results
The sample comprised those persons who received care at the clinic during 2010–2012 (N = 2661 and 17,495 CD4 T cell count measurements). The average age of the sample at first entry into the database was 44.8 years (SD = 10.0). The majority (76%) were African American, and the rest were predominately Caucasian (15%). Approximately 23% of patients were women.
Baseline characteristics for 2661 HIV-infected adults.
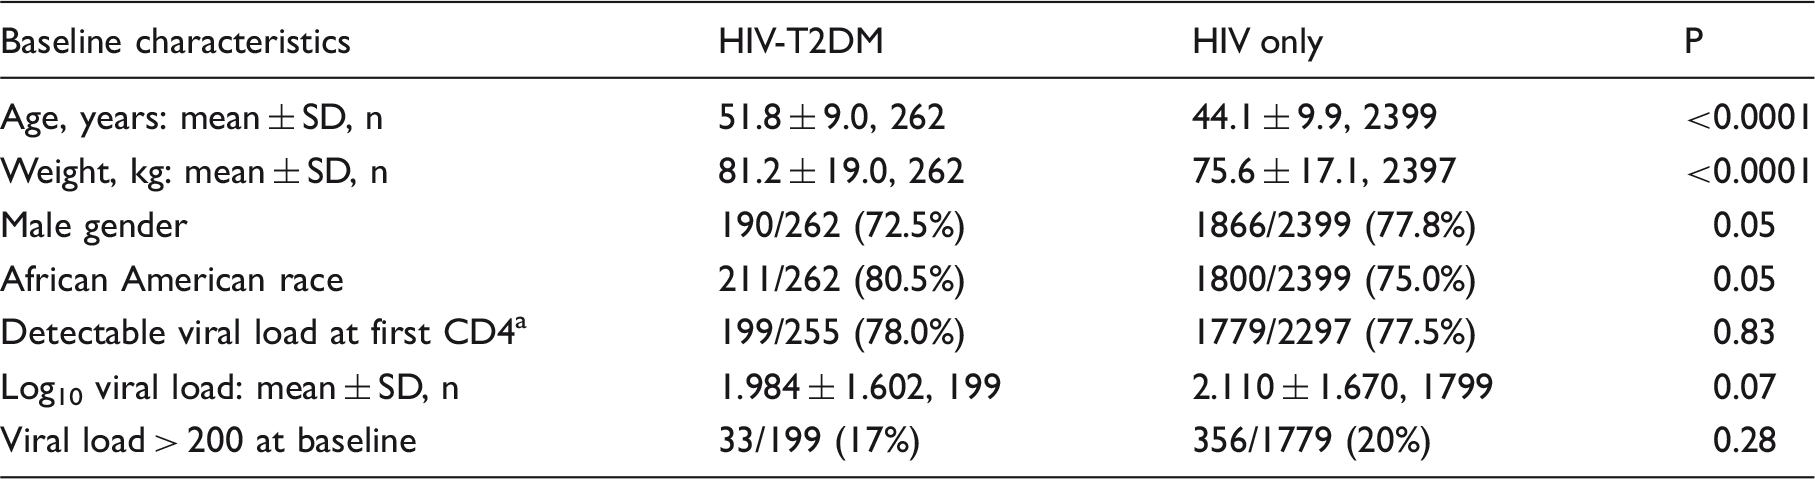
Baseline viral load was available for all patients within ± 6 months of the baseline CD4 cell count.
The CD4 T cell counts for the HIV–T2DM and HIV-only cohorts increased over time and were consistently different (p < .0001), with HIV–T2DM patients having significantly higher CD4 T cell counts than HIV-only patients (Figure 1 and Supplemental Table 1). The mean difference in CD4 T cell counts pooled over follow-up (HIV–T2DM minus HIV only) was 69 T cells/µl (95% CI: 37–100, p = < 0.0001). The mean CD4 T cell count was significantly higher in the HIV–T2DM group at baseline (427 T cells/µl versus 352 T cells/µl, p < .0001) and at all other time intervals (507 T cells/µl versus 426 T cells/µl, p < .0001 after 25–31 months of follow-up). The interaction between length of time in the database and study cohort was not significant for CD4 T cell count (p = .17), indicating that both groups followed the same pattern of increase in CD4 T cell count. Results from adjusted or multivariable analyses also indicated that both groups followed the same pattern of CD4 T cell count increase over time (p = 0.16). The adjusted mean difference in CD4 T cell counts pooled over follow-up (HIV–T2DM minus HIV only) was 39 T cells/µl (95% CI: 8–70, p = 0.01).
Model-based means for CD4 T cell counts (cells/µl) by study group (HIV-T2DM or HIV only) and months followed in database (baseline and five follow-up time intervals). Vertical bars are 95% confidence intervals (CIs). Numbers below months followed in database signify the number of subjects in each study group at each time interval. The total number of CD4 T cell counts was 1900 in the HIV-DM group and 15,595 in the HIV-only group.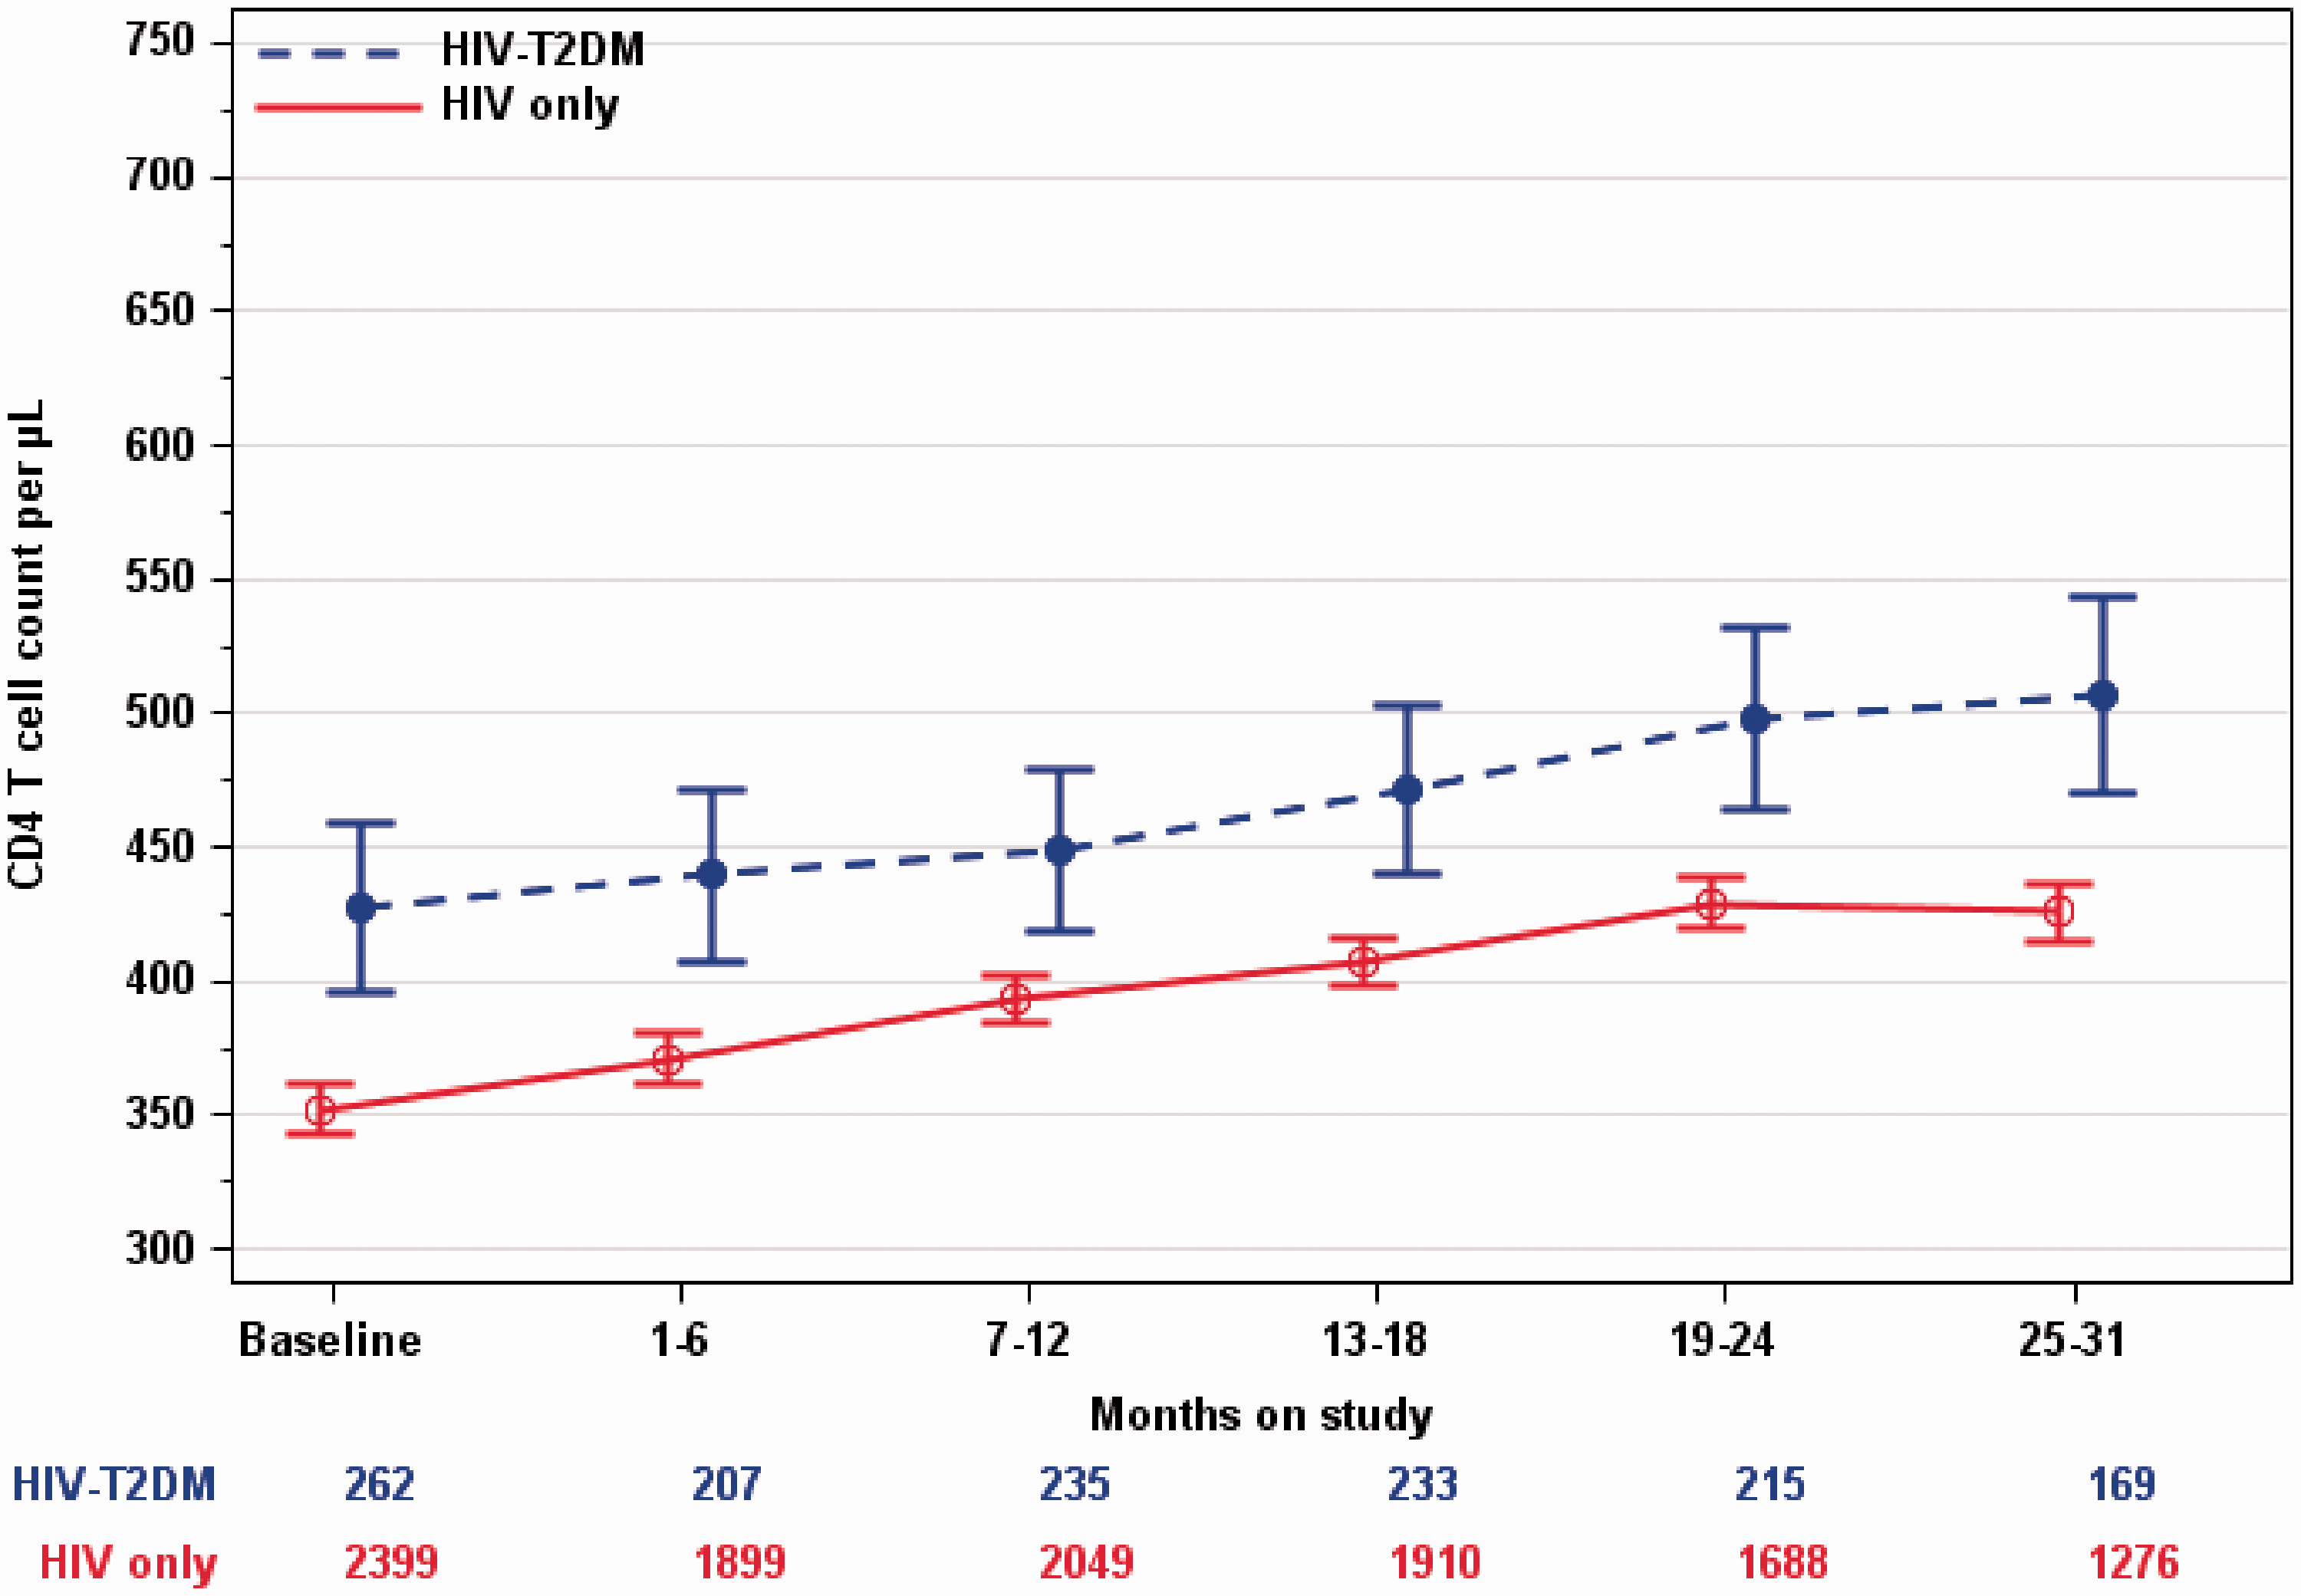
CD4 T cell counts for HIV–T2DM African American men and women changed in significantly different ways during follow-up (p = .025, test for interaction between gender and follow-up interval). For HIV–T2DM individuals, the mean CD4 T cell count was higher in women than in men at baseline (mean difference = 121 T cells/µl, p = .005, Figure 2(a) and Supplemental Table 2A), and after two years of follow-up the magnitude of the difference had increased (mean difference = 210 T cells/µl, p < .0001). After adjusting the analysis for age (p = .18) and weight (p = .12) at baseline, the adjusted mean differences in CD4 T cell count (Supplemental Table 3A) remained similar to the unadjusted mean differences reported in Supplemental Table 2A. A slope model confirmed these findings where the mean rate of CD4 T cell count increase (mean ± SE) during follow-up was 63 ± 9 cells/µL/year in HIV–T2DM African American women and the mean rate of CD4 T cell count increase during follow-up was 28 ± 7 cells/µL/year in HIV–T2DM African American men (p = 0.003, test for interaction between gender and follow-up time, Figure 3).
Longitudinal change in mean CD4 T cell counts in African American patients with HIV by months recorded in the database (baseline and five follow-up time intervals). The time trend lines are the model-based means and 95% confidence intervals. Vertical bars are the 95% CIs. (a) Mean CD4 T cells per microliter for 211 diabetic African American HIV-infected patients (HIV-T2DM) by gender (n = 140 men and 71 women) and recorded time in the database. Numbers below months on study signify the number of men and women at each time interval. (b) Mean CD4 T cells per microliter for 1800 nondiabetic African American HIV-infected patients (HIV only) by gender (n = 1351 men and 449 women) and recorded time in the database. Numbers below months on study signify the number of males and females at each time interval. Mean CD4 cell counts (cells/µl) for African American HIV-T2DM men and women at baseline and after 6, 12, 24, and 30 months of follow-up and the average rate of increase of CD4 during follow-up (Slope model: 137 African American men and 1009 CD4 T cell measurements; 69 African American women and 514 CD4 T cell measurements). Each patient had at least two CD4 T cell measurements. Vertical bars are 95% CIs.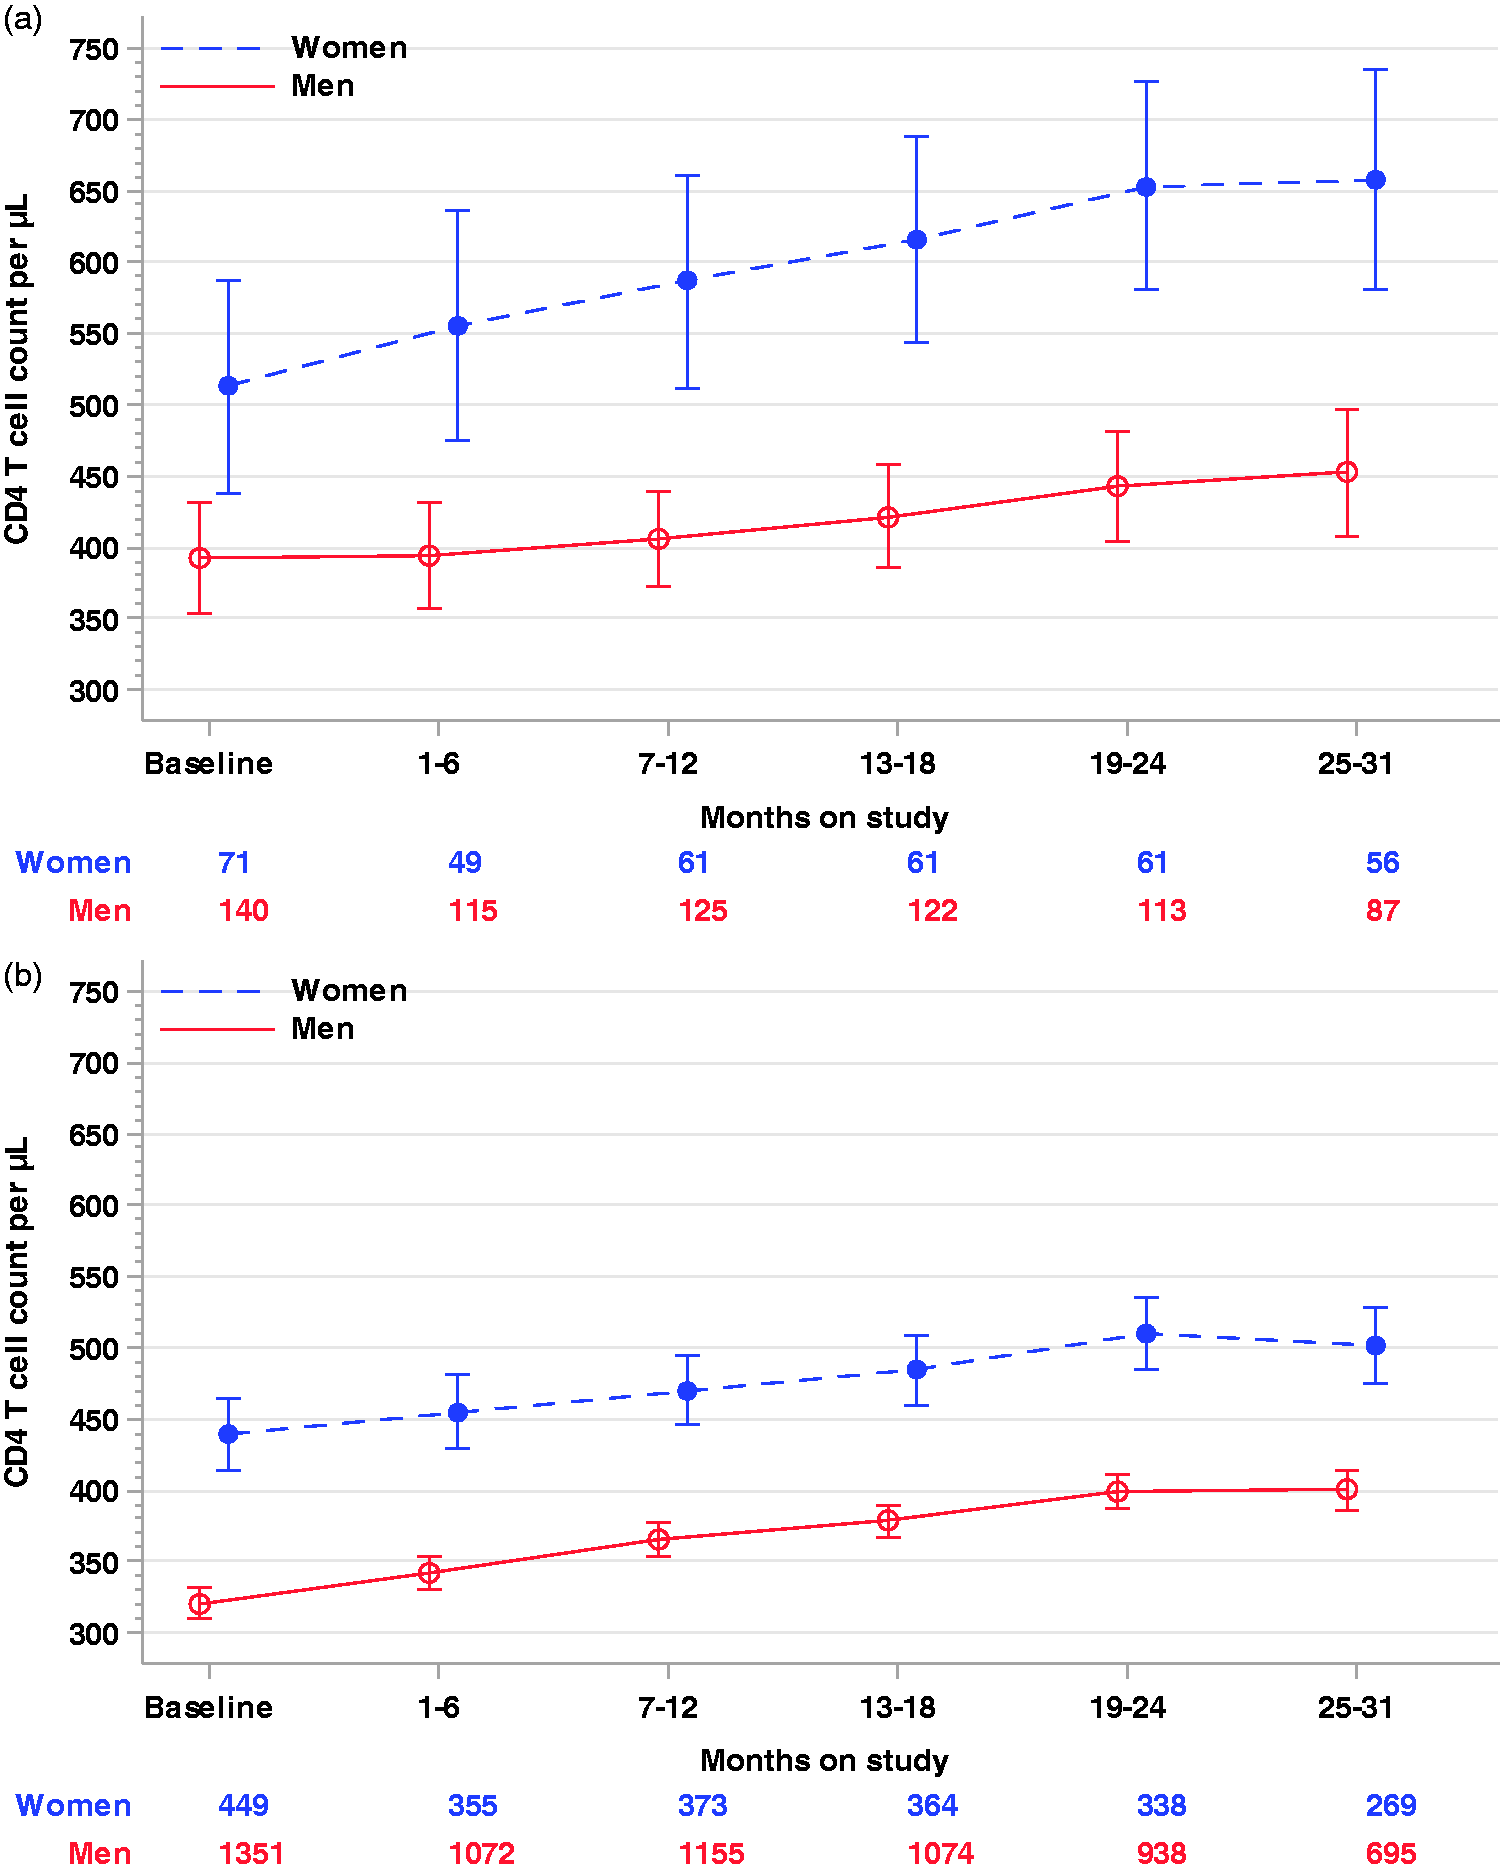
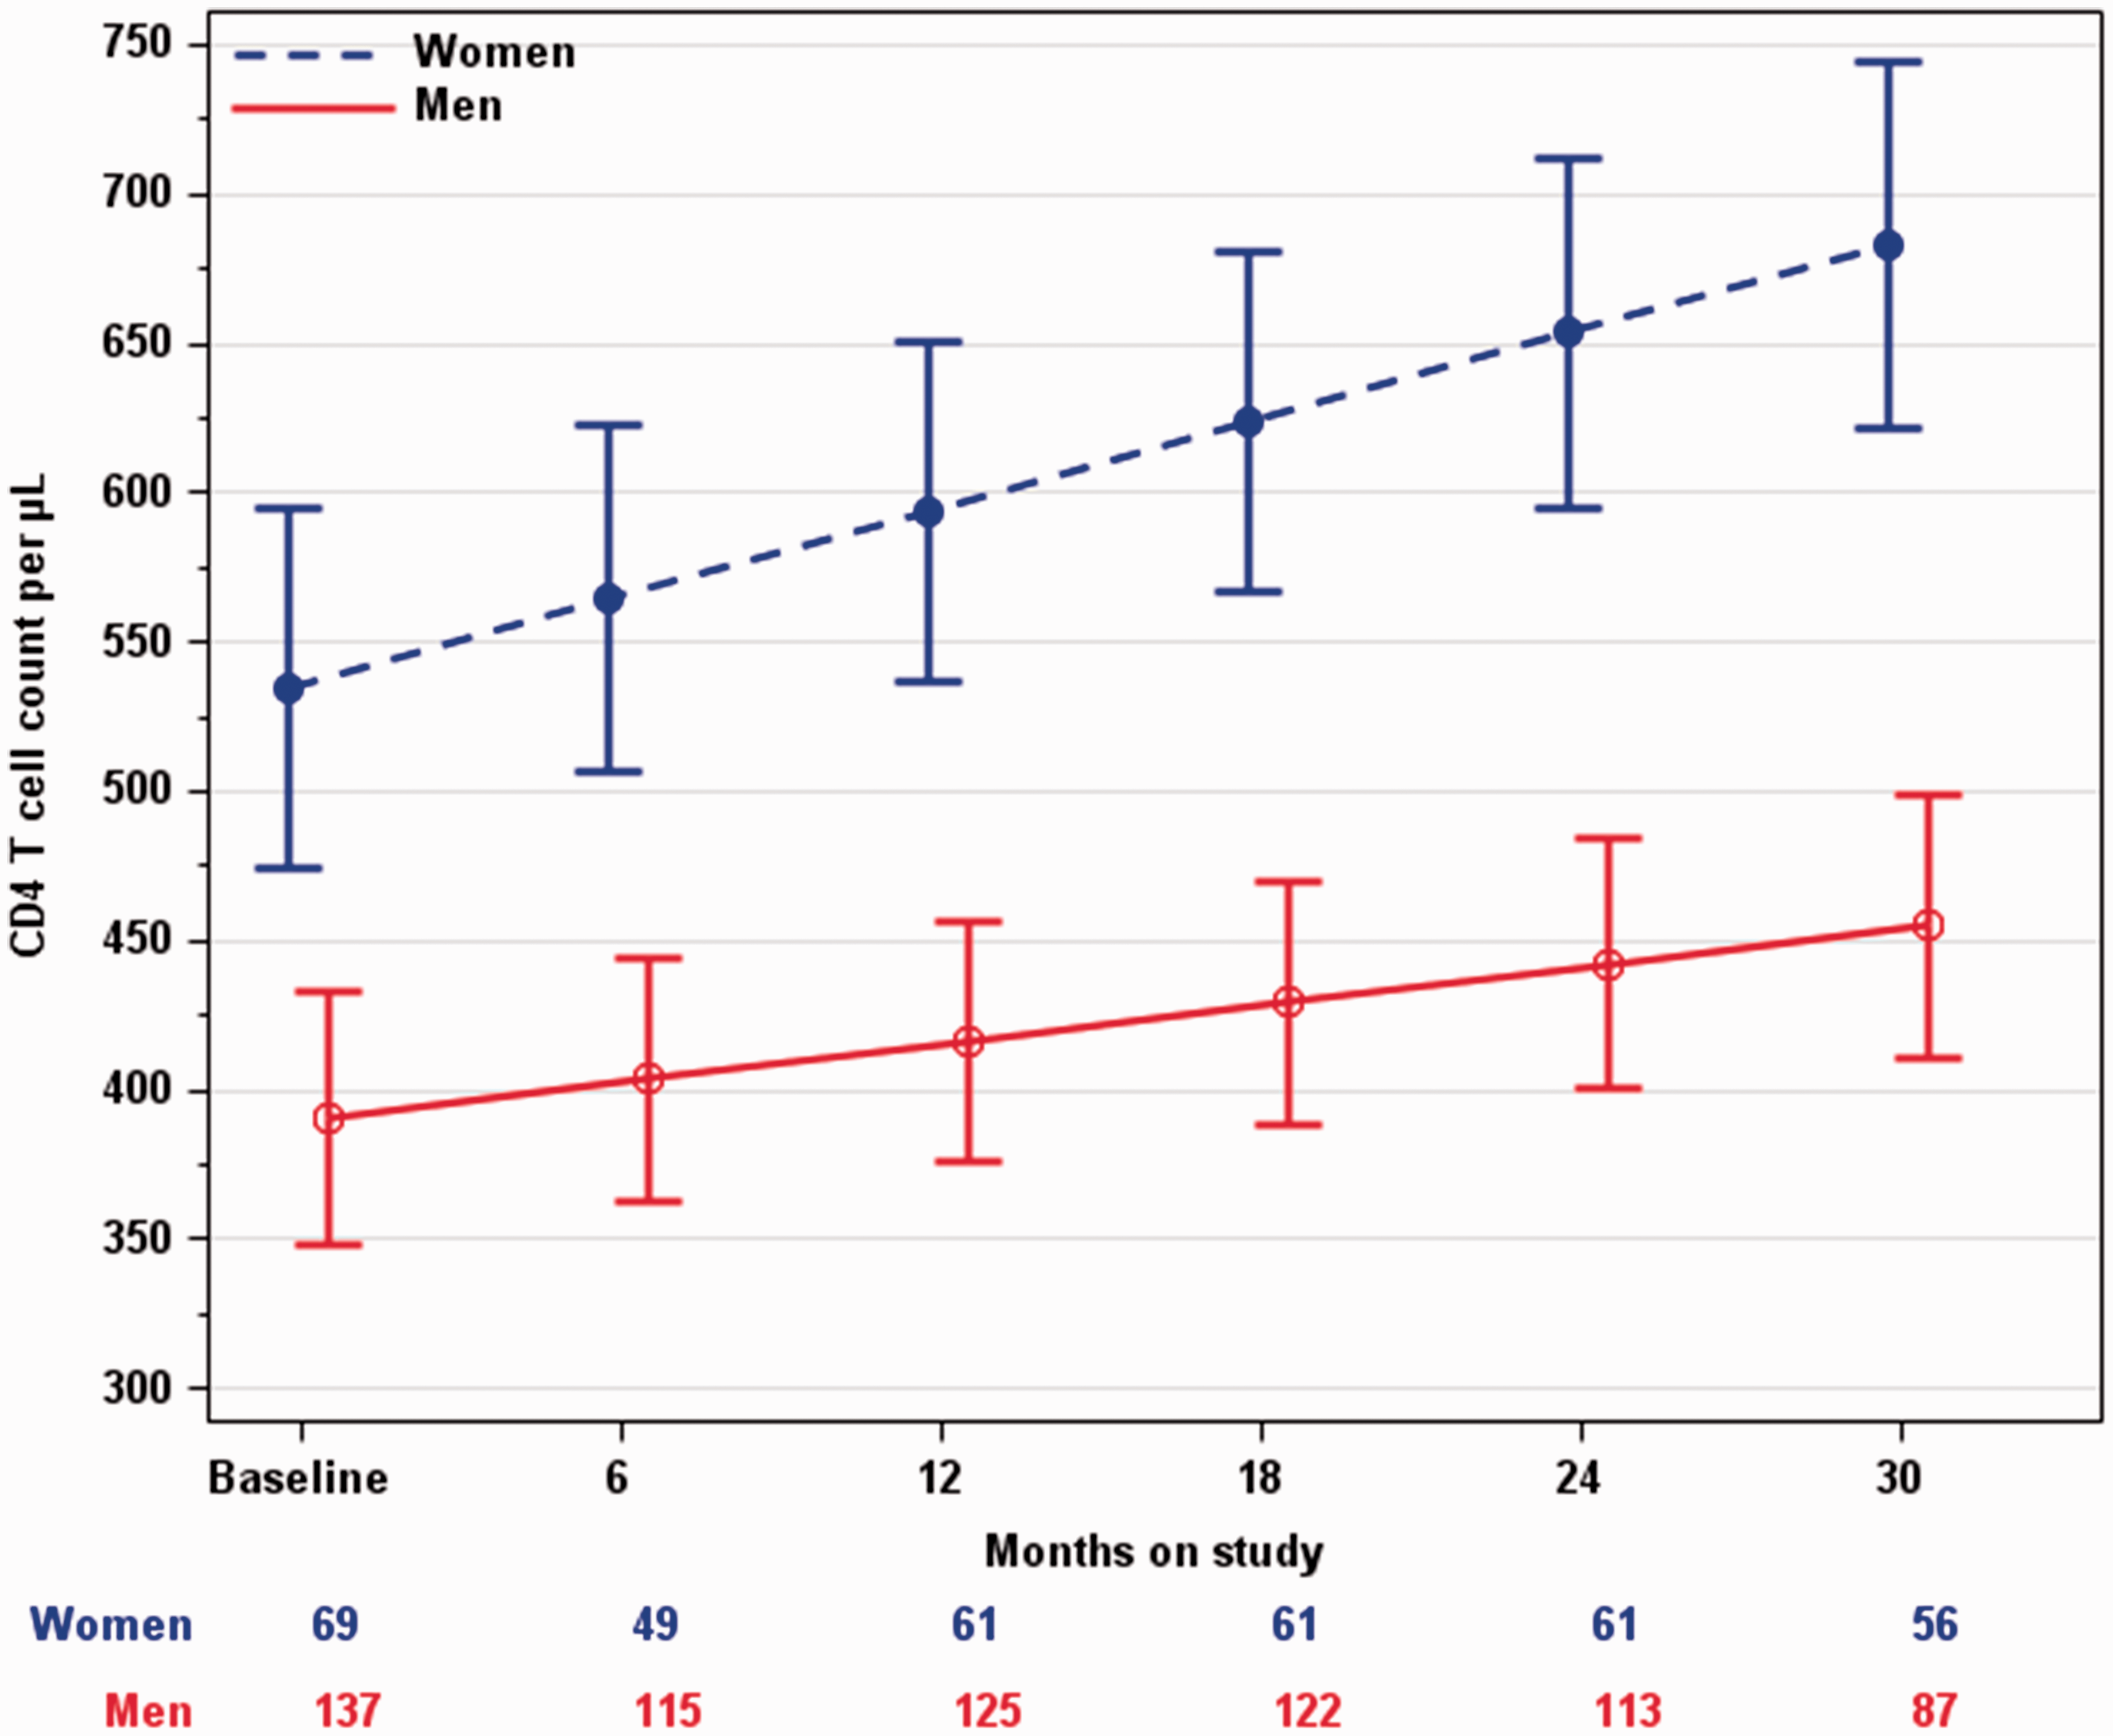
CD4 T cell counts for African American men and women who did not have DM at baseline were consistently different (p < 0.0001); women had a significantly higher CD4 T cell count than did men at each follow-up interval (Figure 2(b) and Supplemental Table 2B). The mean difference in CD4 T cell counts pooled across the follow-up intervals was 109 cells/µl (95% CI = 83–134). The interaction between follow-up interval and gender was not significant for CD4 T cell count (p = .51), indicating that both men and women followed the same natural pattern of increase in CD4 T cell counts. After adjusting for age (p < .0001) and weight (p < .0001) at baseline, the adjusted mean differences in CD4 T cell count (Supplemental Table 3B) remained similar to the mean differences that were not adjusted for age at baseline and weight at baseline (Supplemental Table 2B). The adjusted mean difference in CD4 T cell count pooled across the follow-up intervals was 112 cells/µl (95% CI = 86–138).
Univariable and multivariable slope analysis of CD4 T cell counts among 2592 HIV-infected adults (all patients had at least two CD4 cell count measurements).
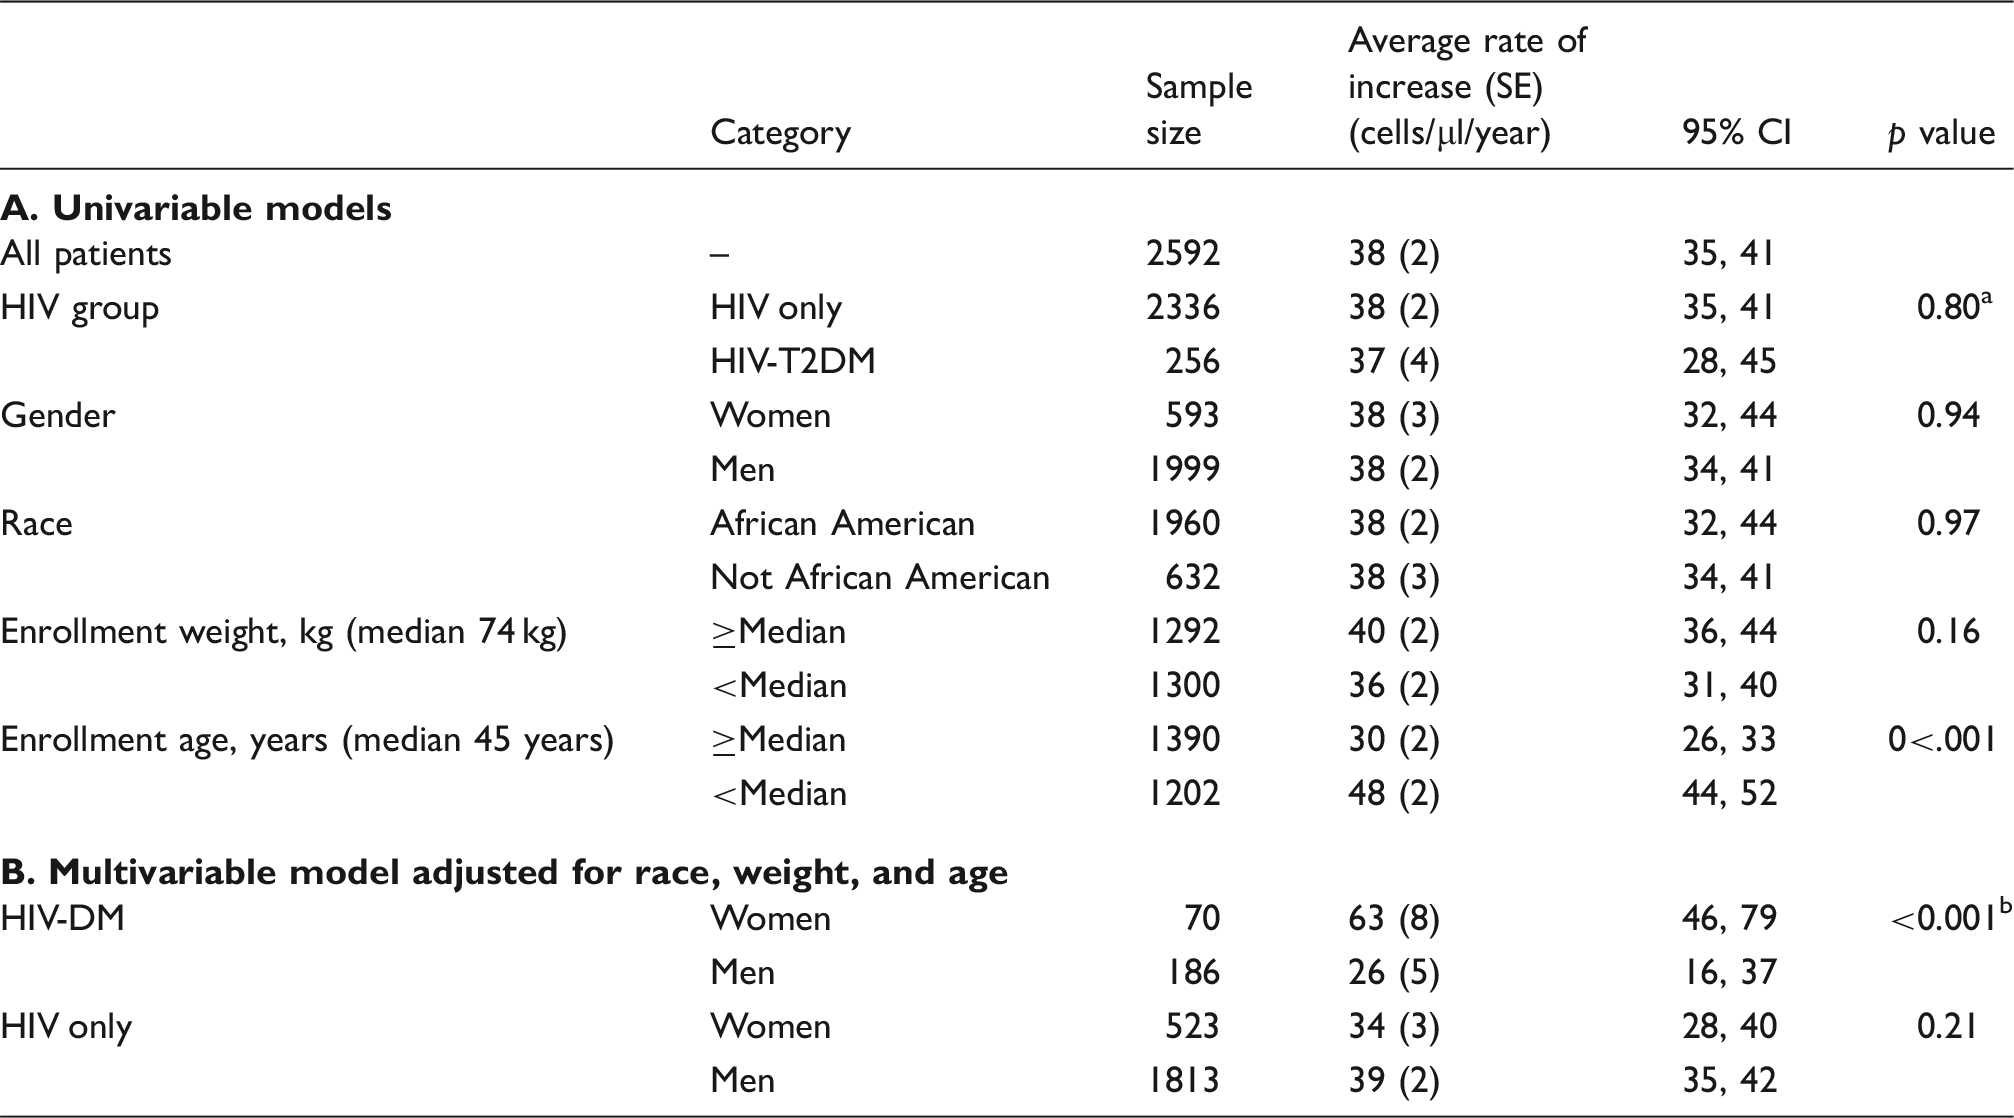
The p value is from the statistical test for interaction between years on study and HIV study group. The CD4 T cell count in the two HIV study groups changed in similar ways during follow-up (p = 0.80) indicating a similar temporal increase over time in the two HIV study groups (the mean rate of increase of CD4 was 38 cells/µl/year in the HIV-only group and the mean rate of increase was 37 cells/µl/year in the HIV-T2DM group.
CD4 T cell increase was significantly faster for HIV-DM women than for HIV-T2DM men (p < 0.001).
CD4 T cell increase was statistically faster (63 cells/µl/year) for HIV-T2DM women than for all other HIV-infected patients (33 cells/µl/year; mean difference = 30 cells/µl/year, 95% CI: 13–47; p < 0.001).
Discussion
This analysis identified important CD4 cell count trends in persons with HIV and DM. The demographic differences between the HIV-only and HIV–T2DM groups were expected. We expected the HIV–T2DM group to be older, with women and African Americans overrepresented; diabetes incidence increases with age. 28 The higher proportion of African American women with HIV–T2DM also reflects the general population: women and minorities have higher incidences of DM, 29 and African American women have one of the highest incidence rates of diabetes in comparison with other combinations of gender and ethnicity. 29 However, we did not expect to find a higher CD4 cell count trend in persons with HIV–T2DM than in persons with HIV only. The HIV–T2DM group had higher CD4 at baseline, 5 and their counts were above 500 at the final point, although counts for both groups improved at the same rate. Moyo et al. 30 reported higher recovery of CD4 rates in persons with HIV and diabetes starting on ART compared to persons with HIV only. 30 Persons with HIV and diabetes showed significantly faster CD4 cell count recovery. They postulated that antidiabetic medication may play a role as an anti-inflammatory which enhanced the immune system recovery because of the release of interleukins. Further research is needed to understand the pharmacological effects of antidiabetic medication and CD4 recovery.
In the present study, women had higher mean CD4 levels than did men. Men have to have a CD4 cell count below 200, and women do not (because postpartum HIV-positive women are included). However, this finding agrees with other studies that have shown a difference between men and women’s CD4 levels. Abioye et al. 31 recently conducted a meta-analysis of disease progression of HIV in men and women. After reviewing all current literature, they concluded that men have poorer outcomes when compared to women. In contrast to the present study, they reported that the change in CD4 rates did not differ by gender. 31 In the present study, though the trajectories of the CD4 cell counts for women and men were the same, with the exception of one group, African American women with HIV–T2DM had not only the highest CD4 cell count levels but also a faster recovery rate than did any other group. The African American women were the only group to achieve the steady recovery outlined by the AIDS guidelines (between 50 and 100 cells/µl) at 63 cells/µl/year. 32 The average for all other groups was 33 cells/µl/year, which is below the 50 cell/µl goal.
Multiple factors might be account for the higher trend of CD4 cell count in African American women with DM, including psychosocial and genetic variables that were not measured in the database that we used. African American women with HIV–T2DM have many risk factors for DM: age, gender, ART use, and ethnicity. The women in this study were older, and older adults tend to be more adherent to ART treatment than younger adults, which might account for the improved CD4 cell count. 33 Adherence to HIV treatment improved their long-term outcomes, as shown by improved CD4 cell counts, but it might have had an unintended consequence, with the cumulative effects of treatment putting them at risk for DM. The database did not capture the year of DM diagnosis in a discrete field and it is also possible they were diagnosed with diabetes first, and already had the skill set to manage their health. Further research is needed to assess the variables not available in this database to further explore adherence to HIV and DM.
Limitations
This study was a practical, retrospective longitudinal chart audit, which might limit the generalizability of its results. In addition, missing data for CD4 cell counts caused the usual statistical analysis of all available data to be subject to bias. All potential confounders could not be accounted for in the analysis and confounding of the outcome estimates by unmeasured variables such as year of diagnosis and start date of ART is possible. We were able to include only weight, not BMI, which would give a more accurate measurement. Height data were often omitted in the charts or recorded inaccurately. Prospective studies are necessary to better characterize the natural history of CD4 cell count trajectories over time in HIV-infected African American men and women.
Conclusions
We conducted an analysis of CD4 cell counts in a sample of 2661 HIV–T2DM and HIV only who received care at a large urban HIV clinic over a period of three years. After adjustment for race, age, and weight, HIV–T2DM patients had higher CD4 T cell counts than HIV-only patients but the rates of increase were similar for the two HIV cohort groups. The rate of increase in CD4 T cell count was significantly faster for women with HIV–T2DM compared to all other HIV-infected patients. Because this was not a randomized trial, we cannot exclude the possibility that these differences may have been due to other factors for which we could not control.
Footnotes
Declaration of conflicting interests
The authors declared no potential conflicts of interest with respect to the research, authorship, and/or publication of this article.
Funding
The authors disclosed receipt of the following financial support for the research, authorship, and/or publication of this article: This work was supported by the Emory Center for AIDS Research (P30AI050409) through an opportunity grant. Editorial support with manuscript development was provided by the Cain Center for Nursing Research and the Center for Transdisciplinary Collaborative Research in Self-management Science (P30, NR015335) at The University of Texas at Austin School of Nursing.
References
Supplementary Material
Please find the following supplemental material available below.
For Open Access articles published under a Creative Commons License, all supplemental material carries the same license as the article it is associated with.
For non-Open Access articles published, all supplemental material carries a non-exclusive license, and permission requests for re-use of supplemental material or any part of supplemental material shall be sent directly to the copyright owner as specified in the copyright notice associated with the article.
