




Abstract
Although eligibility for antiretroviral treatment is no longer based on CD4 thresholds, CD4 testing remains important. Variation in CD4 cell count complicates initiation of antibiotic prophylaxis, differential diagnoses and assessments of immunological recovery. Five hundred and fifty-three HIV-positive antiretroviral-naïve adults, recruited from inner-city clinics, had three serial CD4 cell count tests. Test 1 was mostly done in a laboratory network supporting primary care clinics, while Tests 2 and 3 were performed in a tertiary-level laboratory. Reproducibility was assessed through Bland–Altman limits of agreement and coefficients of variation. Participants, a mean age of 34 years and mostly female (57%), had a median 203 CD4 cells/μL (Test 1). Seventeen per cent classified as having advanced HIV disease (CD4 cell count < 200 cells/µL) on Test 1 had a CD4 cell count > 200 cells/µL on Tests 2 and 3. Mean differences between tests were <10 cells/µL for all comparisons. Limits of agreement for Tests 1 and 2 were −106.9 to 112.7 and coefficient of variation 15. Corresponding figures for Tests 2 and 3 were −88.2 to 103.4, and 13. Means of tests were similar, suggesting no systematic measurement differences, despite testing being done at different times. Variations were, however, considerable in many instances, though smaller in testing done in the same laboratory. CD4 cut-offs must not be applied rigidly, but rather constitute one amongst many factors used to guide patient care. Moreover, given the difficulties in determining whether CD4 changes are due to HIV disease, or other biological and laboratory factors, CD4 laboratory reports should include a range of plausible values, not only the absolute count.
Keywords
Background
Initiation of antiretroviral therapy (ART) in HIV-positive patients, regardless of CD4 cell count, is recommended by WHO and has been adopted by most countries worldwide, including South Africa. 1 Tenofovir (TDF) and emtricitabine (FTC) or lamivudine (3TC), in combination with efavirenz (EFV), is the most commonly used first-line ART regimen in most settings, 1 where patients take a single-tablet, fixed-dose formulation each day. 2
CD4 strata for ART initiation have been a continually moving target, with recent WHO guideline iterations arguing for a move to 350 cells/µL in 2010, 3 500 cells/µL in 2013, 4 and removal of the threshold altogether in 2015. 1 CD4 cell count measurement, however, is still included in WHO and national guidelines as part of tests done prior to ART initiation.5–7 A CD4 cell count is an accurate predictor of disease status and immediate risk of death, and thus is used to identify those who have advanced HIV disease and whose care needs to be prioritized. 8 While the Department of Health guidelines in South Africa strongly recommend ART for all HIV-infected people, regardless of CD4 cell count, it states that CD4 cell count is still useful for prioritising ART initiation in patients with a CD4 cell count ≤ 350 cells/µL and in fast-tracking ART in those with a CD4 cell count ≤ 200 cells/µL. 6 The Department also notes that CD4 cell count should be used to determine the need for opportunistic infection (OI) prophylaxis (at a CD4 cell count ≤ 200 cells/µL) and for testing for cryptococcal antigenaemia (at a CD4 cell count ≤ 100 cells/µL).
The role of CD4 cell count in monitoring patients once they have initiated ART has also evolved. WHO recommends that in settings where viral load testing is not routinely available (estimated as about half of ART patients worldwide), 9 a CD4 cell count, together with clinical monitoring, should be used to diagnose treatment failure. 10 However, in settings where routine viral load monitoring is available, CD4 cell count monitoring can be stopped in those who are stable on ART and virally suppressed. Patients with unstable or advanced HIV disease require ongoing CD4 cell count monitoring, regardless of availability of viral load testing. 5
At a programmatic level, values of CD4 cell count at ART initiation are an important indicator of the performance of HIV programmes in a country, especially of a programme’s success in averting late ART initiation. 5 In well-performing programmes, the proportion of HIV-positive adults initiating ART who have a CD4 cell count ≤ 200 cells/µL will decline as HIV testing and ART coverage expands, and even approach zero if those infected with HIV are identified and receive ART soon after infection. Also, for programme monitoring, aggregate data on the CD4 cell count of those receiving ART could provide useful information for monitoring of the overall health status of patients attending ART services in different parts of the country. 11 Population-level trends over time in CD4 cell counts of patients taking ART, especially following modifications to the ART programme, could also be a useful marker for monitoring the performance of the programme. 12
The accuracy and reliability of CD4 cell count measures clearly have important implications for patients and for monitoring of HIV programmes. Perhaps most importantly, variation and/or errors can influence decisions about whether to screen for comorbidities, especially infectious disease, or to switch patients to second- or third-line treatment, particularly in settings where viral load testing is not available. Further, inherent variation in CD4 cell count measurement can cause unnecessary anxiety and repeat venepuncture in patients with inaccurate low readings; undermine provider and patient confidence in laboratory services and have cost implications when seemingly inaccurate tests are repeated. Given the importance of valid CD4 cell count, we thus assessed the reliability of CD4 cell count testing among adults presenting for routine HIV care in inner-city Johannesburg, South Africa. Procedures were part of screening for eligibility for a clinical trial, and each patient had three CD4 cell count tests. The findings could influence decisions about how CD4 cell count thresholds are applied in clinical practice, and the relative weight given to CD4 cell count when monitoring patient outcomes, especially in the absence of viral load measures.
Methods
Antiretroviral-naïve adults attending outpatient HIV testing and treatment services were evaluated by community workers for eligibility for an antiretroviral clinical trial (WRHI 001). The patients (n = 771) came mostly from clinics in Hillbrow (n = 717; 93%). The remaining 54 patients were recruited from Charlotte Maxeke Johannesburg Academic Hospital (CMJAH), a nearby referral hospital where the study was based. The community workers were asked to invite patients aged ≥18 years who were not known to be pregnant, and had CD4 cell counts < 400 cells/µL (at the time of the study, the CD4 initiation threshold in South Africa was 350 cells/µL). These CD4 cell counts had been done as part of routine outpatient care for determining eligibility for ART (Test 1).
Patients were then screened for eligibility for the trial, during which a second CD4 cell count was done (Test 2, n = 755). A total of 600 patients were eligible and enrolled in the trial, 593 of whom had another CD4 cell count prior to randomisation (Test 3; seven of those enrolled had a clotted blood sample). Having three tests allowed us to assess the reliability and agreement between CD4 cell counts done in outpatient clinics (Test 1), and two carried out as part of trial procedures (Test 2 and 3).
The trial explored two alternative first-line antiretroviral regimens: tenofovir versus low-dose stavudine (20 mg twice daily), in patients also receiving lamivudine and efavirenz. The study had sites in Uganda and India, but only data from the South African site are presented here. Results of other baseline laboratory tests are presented elsewhere. 13 The study was approved by the University of Witwatersrand Human Research Ethics Committee (Medical; ref. 111112).
CD4 cell count testing methods
Test 1 CD4 cell count would mostly have been done in the public-sector National Health Laboratory Service (NHLS) laboratories, but some may have been done on alternative point-of-care systems14,15 or within the private sector. The NHLS annually performs about 3.5 million CD4 cell count tests. The network comprises approximately 50 CD4 cell count testing laboratories that use the single platform bead-based PanLeucogated (PLG) CD4 method with a sample-to-sample quality control system.16–18 The PLG system is used in both high-volume fully automated testing laboratories16,17 as well as in low-end volume settings using a modified user-independent walk-away platform 18 facilitating testing of less than 150 tests a day and with limited operator skills.
The laboratories participate in the NHLS CD4 Proficiency (AFREQAS) Testing scheme 19 and all tiers of service laboratories 20 operate using identical standardised operating procedures 20 and quality control systems.16–18,20 Not all NHLS CD4 laboratories are accredited, but all are monitored through two-monthly outcomes reported on the NHLS CD4PT/AFREQAS external quality assessment program. Corrective action and follow-up training are coordinated through the tiered laboratory system harmonising tier. 20 Full details about the NHLS CD4 network, transportation and sample handling logistics are described elsewhere. 20
Tests 2 and 3 were done at the CMJAH NHLS, a SANAS and NIH/DAIDS accredited laboratory, with dedicated sample collection logistics coordinated through the local university contract laboratory service. Unlike in other parts of the NHLS, CD4 cell count testing here is performed as a dual platform PLG modification.21,22 This method uses the contract laboratory’s haematology analyser-derived total white cell count (WCC) as the basis to calculate the absolute CD4 cell count. Single platform bead counting was nonetheless still performed to assess the accuracy of the haematology analyser-derived WCC. Any discrepancies between these readings are checked before finalising results.
Dates of Test 1 were not recorded. Most of these tests, however, would have been done within a month of the study screening visit (Test 2), and almost certainly no more than two months before screening. All CD4 cell counts are reported as number of CD4 cells per μL.
Statistical methods
The primary comparison was of the reproducibility of the Test 1 result compared to Tests 2 and 3. This was done as decisions about OI prophylaxis, and patient care more generally, are mostly based on the first test that a patient has – which is often done in primary care settings as in this study – and we thus wanted to evaluate the validity of that test. Analyses were, however, also done to assess the reliability of Test 2 and 3, allowing us to assess the potential value of standardised testing, which may be especially important within a large network such as the NHLS, which uses a range of testing platforms.
Non-parametric paired Wilcoxon tests were used for comparison of CD4 cell count and the Chi square test used to compare CD4 categories. We report the proportion of patients that were misclassified at different CD4 cell count thresholds. Specifically, we considered those with a CD4 cell count below 350 in Test 1, but above 350 cells/µL in Test 2 or Test 3 as being misclassified. These patients would not have been eligible for cotrimoxazole prophylaxis had these later tests been used. Also reported are the number of misclassifications based on the CD4 cell count threshold of < 200 cells/µL (considered the cut-off for advanced HIV disease) 8 and < 100 cells/µL (the threshold for cryptococcal antigen testing). At each of these thresholds, we report the proportion misclassified on either Test 2 or 3, or on both tests. Misclassifications between Test 2 and 3 were also calculated.
Scatter plots were used to examine the correlation between counts and to identify outliers. The test re-test reliability was estimated by assessing the correlation between counts on Test 1 and those on Tests 2 and 3 using the Pearson product–moment correlation coefficient (r). Given the sensitivity of r to outliers, 23 for this calculation, we excluded values above 350 cells/µL in Test 1, or above 550 cells/µL in Tests 2 or 3. While the coefficient r measures the strength of the linear relation between two sets of measurements, it does not assess their agreement. 24 Correlation between two measures can be high, while agreement is low. Overall agreement between Test 1 and Tests 2 or 3, and between Tests 2 and 3, were evaluated using the Bland–Altman limits of agreement method. 25 The absolute difference between data pairs (Test 1 and comparator Test) is graphically represented on the vertical axis, against their average [(Test 1 + comparator test)/2] on the horizontal axis (Figure 1(a) and (b)). The mean difference between the pairs and the limits of agreement (mean difference ± 2 standard deviations) are shown as horizontal lines on the graph. This analysis excluded extreme outliers (mean differences between counts >150 cells/µL). The interpretation of whether there is acceptable agreement between the tests was based on an assessment of whether the range of the limits of agreement was considered to be clinically important. 25 We selected a cut-off of 100 cells for defining an acceptable level of agreement, based on the results of a modelling study which found that levels higher than this often lead to incorrect clinical decisions. 26 Lastly, percentage similarity (%SIM) analyses were used to assess the overall comparison between Test 1 and the subsequent tests, as well as between Tests 2 and 3. 23 This was calculated as (((Test 1 + comparator test)/2)/Test 1) × 100. Data pairs with the same values will be 100% similar. The average of the difference between the two tests notes if the test results are systematically higher or lower than each other, while the coefficient of variation of the %SIM denotes how much variation exists between the two values for each patient (or in other words, how consistent is the difference between matched CD4 cell count). A limitation of %SIM is that it overestimates the percentage difference at low CD4 cell count.27,28 Moreover, the clinical implications of variations in counts below 100 are low: all these patients require fast-tracking into care and screening for cryptococcal antigenaemia. Calculated %SIM outcomes were thus corrected to 100% similar in all matched pairs of test results where both CD4 cell counts were below 100, to avoid biasing the %SIM measure.27,28

(a) Bland–Altman agreement and limits of agreement between Test 1 and Test 2. The middle horizontal line represents the mean bias, while the upper and lower horizontal lines represent the limits of agreement (mean agreement ± 2 standard deviations). Sixteen with mean differences between cell counts >150 cells/µL were excluded. (b) Bland–Altman agreement and limits of agreement between Test 1 and Test 3. The middle horizontal line represents the mean bias, while the upper and lower horizontal lines represent the limits of agreement (mean agreement ± 2 standard deviations). Eighteen with mean differences between counts >150 cells/µL were excluded.
Results
Participants referred for screening for trial eligibility were predominately female (57%; 432/771) and a mean 34.5 years old (standard deviation = 7.6). The majority of the cohort were born in South Africa (57%, 439/771), with the remainder largely from Zimbabwe (38%, 293/771). Most patients had WHO Stage I disease (59%, 433); 22% Stage II (164); 16% Stage III (119) and 3% Stage IV (20).
A total of 553 participants had a CD4 cell count on all three measures. The median number of days between Tests 2 and 3 was 15 (inter-quartile range [IQR] = 13–17 days; range 0–54). Data were not available on time between Test 1 and the other tests. The median CD4 cell count at Test 1 was 203 cells/µL, Test 2, 206 cells/µL and Test 3, 199 cells/µL, similar to the mean values (Table 1). Though the medians and IQRs of Tests 1–3 were similar, differences were detected when comparing Tests 1 and 3 (P = 0.05), and Tests 2 and 3 (P < 0.001), but not Test 1 and 2 (P = 0.11). About half the participants had a decrease in CD4 cell count between Test 1 and Test 2 (48%; 263/553), with the remainder having identical or increased counts. In 21% of participants, the CD4 cell count decreased between Test 1 and Test 2, and also decreased between Test 2 and Test 3 (115/553). Conversely, 13% of participants had a rise in count with each test (74/553).
Distributions of CD4 cell count from tests performed in primary care (Test 1) and tests performed at a single laboratory using standardised methods (Tests 2 and 3) in the WRHI001 South African Cohort.
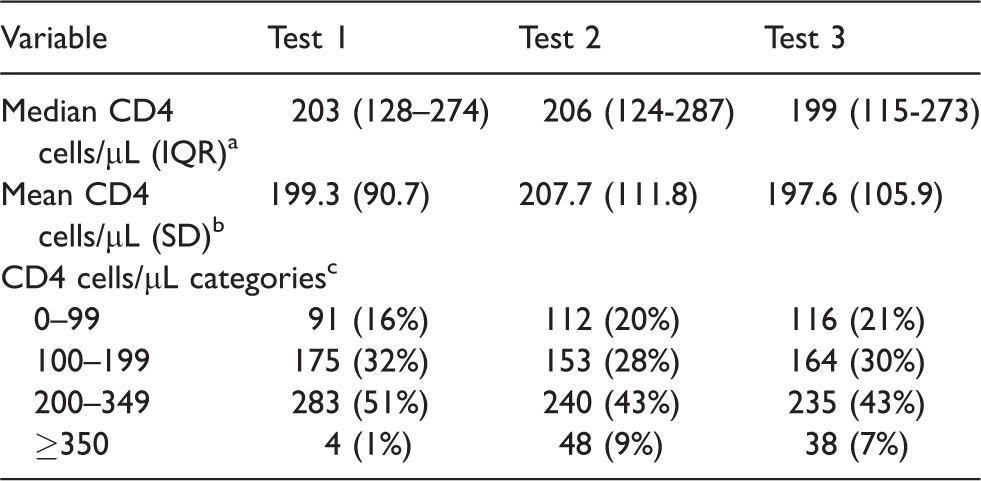
Five hundred and fifty-three patients had a CD4 cell count on Tests, 1, 2 and 3. IQR: inter-quartile range. SD: standard deviation.
aP<0.05 for comparison of Tests 1 and 3, and Tests 2 and 3, non-parametric paired Wilcoxon test. bP < 0.05 for comparison of Tests 1 and 2, and Tests 2 and 3, paired Student’s t-test. cP < 0.05 for comparison of Tests 1 and 2, Tests 1 and 3 and Tests 2 and 3, Chi square test.
Eight percent of patients who were classified as below the 350 cells/µL CD4 threshold on Test 1 had values above that level on Test 2, with a similar figure for Test 3 (Table 2). Overall, 12% were misclassified at this threshold based on a CD4 cell count above 350 cells/µL on either Test 2 or 3 (n = 64). Only 3% were misclassified on both Test 2 and Test 3 (n = 19). Seventeen percent of patients with a CD4 cell count below 200 cells/µL on Test 1 were above 200 cells/µL on Test 2. At this 200 cells/µL CD4 threshold, 24% were misclassified on either Test 2 or Test 3 (n = 63), but only 11% misclassified on both tests (n = 28). With a CD4 threshold below 100, 12–15% who had a CD4 cell count under 100 cells/µL on Test 1 had a CD4 cell count cell count above 100 cells/µL on Test 2 and 3. A total of 21% of patients were misclassified as under 100 cells/µL on either one of these tests (n = 19), and only 7% on both (n = 6).
Reproducibility of CD4 test results from tests performed in primary care (Test 1) and tests performed at a single laboratory using standardised methods (Tests 2 and 3).
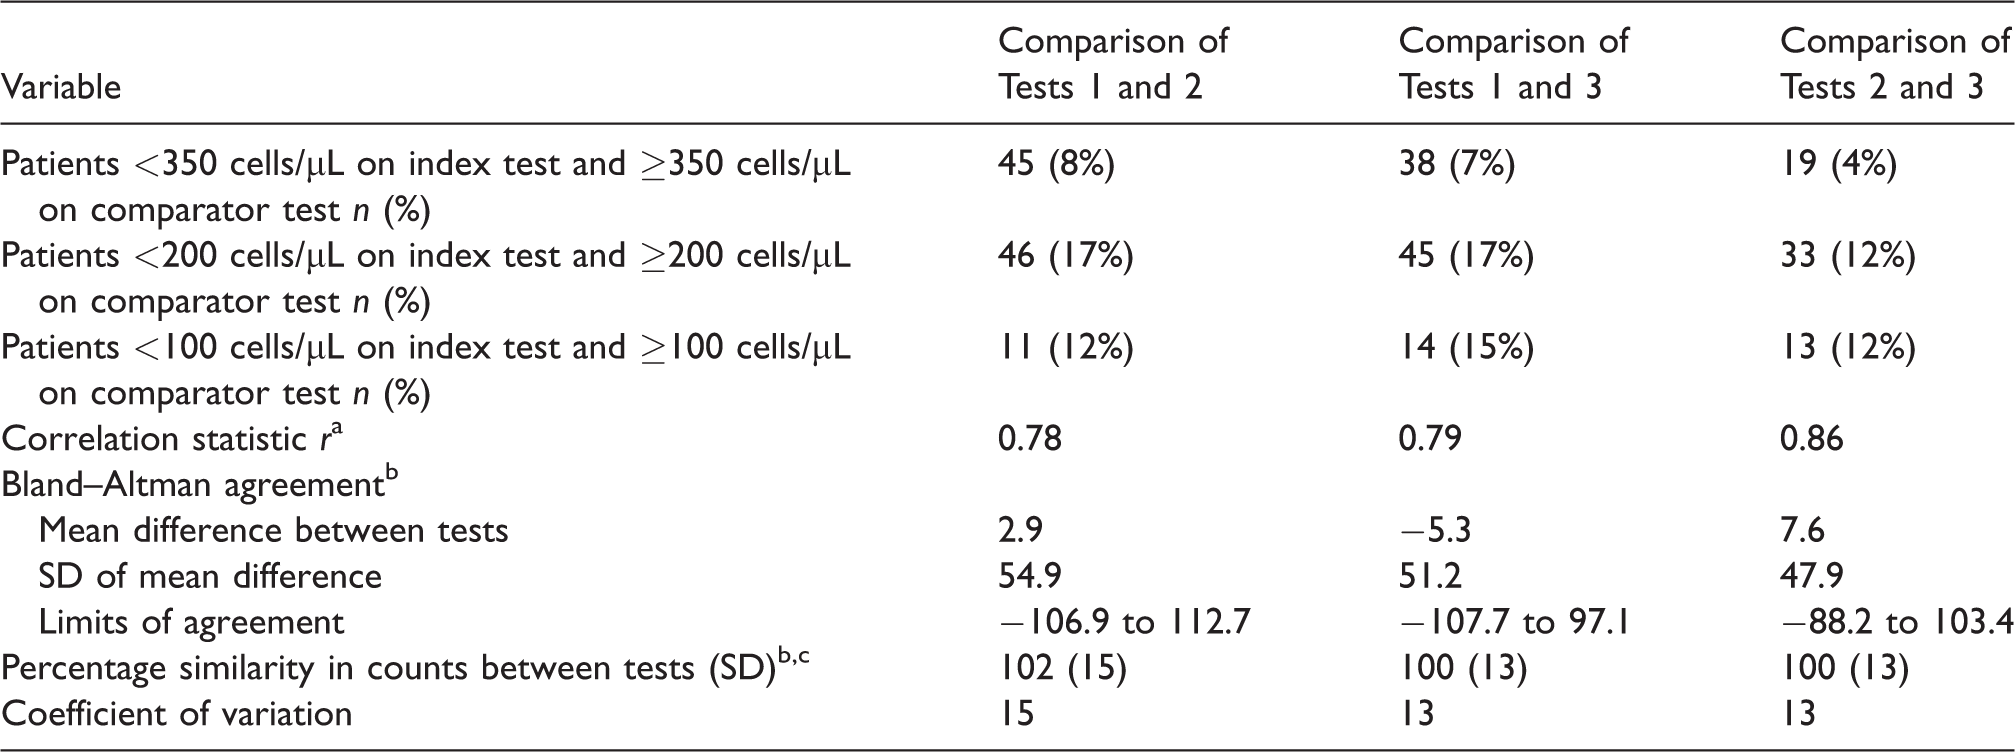
Five hundred and fifty-three patients had a CD4 cell count on Tests, 1, 2 and 3. SD: standard deviation. Test 1 is index test for comparison between Test 1, and Tests 2 and 3. Test 2 is index test for comparison of Tests 2 and 3.
aExcludes three values >350 cells/µL in Test 1, and 10 > 550 cells/µL in Tests 2 or 3.
bExcludes those with mean differences between counts >150 cells/µL: 19 in Test 1 versus 2, 21 in Test 1 versus 3; and 15 in Test 2 versus 3.
cMatched pairs of test results where both CD4 cell counts <100 cells/µL made 100% similar. Limits of agreement = mean difference ± 2 SD.
The Pearson’s correlation coefficient r for correlation of Test 1 and Test 2 was 0.78, 0.79 for Test 1 and Test 3 and 0.86 for Test 2 and Test 3. The mean Bland Altman bias between tests was <10 for all three comparisons, but limits of agreement were above 100 for Test 1 and 2 (−106.9 to 112.7, Figure 1(a)), and were from −107.7 to 97.1 for Tests 1 and 3 (Figure 1(b)). The mean difference between Tests 2 and 3 was 7.6, and limits of agreement −88.2 to 103.4. The coefficient of variation for the comparison of Tests 1 and 2 was 15; Test 1 and 3, 13 and Test 2 and 3, 13.
Discussion
The study tested the reliability of serial measures of CD4 cell count, with the first test done in primary healthcare. Tests 2 and 3 were performed by the same laboratory network where most of Tests 1 were done, using identical gating and quality-assurance systems, but different testing platforms. Mean differences between the readings were low, indicating that there was no systematic increase or decrease in the readings, even though done at different intervals. Bland–Altman analysis showed a mean bias of <10 overall and limit of agreement of around 100, which suggest acceptable method agreement between the different CD4 cell count methods or platforms. The two tests done within a controlled trial setting (Tests 2 and 3) were more similar than when these tests were compared to Test 1, taken at primary care level. This finding emphasises the importance of having standardised CD4 cell count testing methods and systems within a network of laboratories. Standardising the systems, at least within a geographical area, might enhance the ability to compare CD4 cell counts in the same patient over time.
Many studies report similar levels of reliability to this study22,29 and others even larger differences.30,31 Even repeated tests on the same samples, using the same technology and laboratory, can have coefficients of variation of around 10%. 29 Fluctuations in CD4 cell count are not surprising given the intra-individual variability in CD4 cell count, influenced by diurnal and seasonal fluctuations,32,33 intercurrent infections, changes in total WCCs and the effects of drugs such as corticosteroids and alcohol.34,35 Technical factors also impact on CD4 cell count measurement, such as sample logistics, including transportation of samples; sample collection methods 28 (vacutainer-based venepuncture vs. capillary or finger stick sampling); use of dual versus single platform counting methods,15,19,27,28,36,37 and flow cytometric gating strategies 38 as well as variations in reagents, sample preparation and operator skills. In addition to variability due to biological and technical factors, CD4 cell count is expected to change in HIV-infected patients, either as a steady decline with HIV disease progression or as a rise with ART. Several studies, including one in the study site, have shown that CD4 cell count increase by 100–150 cells/µL in the first year of ART and by an additional 20–50 cells/µL annually thereafter.39,40
Variations in CD4 cell count in the same HIV-infected patient can have substantial implications for patient care. 26 In a survey of clinicians from 16 countries, while most were aware that the CD4 cell count can vary for reasons other than disease progression or treatment failure, the respondents generally believed that changes of only around 50 cells were ‘acceptable’ fluctuations. 26 The United States Department of Health and Human Services (DHHS) guidelines define a ‘significant’ variation between two CD4 cell count tests in a patient receiving ART as an approximately 30% change in count. 7 These figures naturally also depend on the absolute CD4 cell count: the implications of a 50 cells/µL variation or 30% change differ markedly in patients with 500 cells/µL from those with 100/µL. In our study, one standard deviation of the percentage similarity of our tests was 13–15%, meaning that many results would be considered ‘significant’ variations by these definitions.
Based on the results of Test 1, as many as 17% of patients would have been classified as having advanced HIV disease and thus eligible for OI prophylaxis, but classified as ineligible on subsequent tests. Around one in eight patients would be misclassified at the 100 cells/µL CD4 cell count threshold, with implications for cryptococcal antigen testing. While some patients who are misclassified may benefit from prophylaxis and have reduced infections, others may experience unnecessary drug toxicities. Overall, clearly, unnecessary laboratory screening, drug prescription and drug toxicities incur substantial costs, as does the repeating of CD4 cell count tests that appear spurious or at odds with the patient’s clinical condition. Moreover, the lack of a unique patient number in South Africa means test results from different laboratories or networks are very difficult to trace, incurring massive expenditure, potential for error and patient harm from redoing of tests. Commendably, the Department of Health in South Africa is planning to introduce a unique identifier shortly.
While the study cannot directly compare CD4 cell count testing methods or ascertain the causes of variability, the relatively larger intra-patient variation between Test 1 and the other tests might be due to the use of different testing platforms in the NHLS network. Standardizing testing methods across the laboratory network could minimize variability of CD4 cell count reporting, where the whole network uses identical sampling methods, testing platforms and operating procedures. 19 Presently, the use of different platforms might incur substantial variation, despite standardisation of testing and quality assurance systems, as well as documented improved reproducibility of the NHLS predicate method, both within 37 and between laboratories.19,37 In addition to different platforms, difficulties in interpreting changes in a patient’s CD4 cell count will be further compounded by the increasing use of point-of-care CD4 cell count testing, which can have wide count variation and poor precision.28,30,36
There are several limitations that should be noted. Most especially, the dates of Test 1 were not recorded. However, time between tests is unlikely to account for the study findings: the rate of CD4 cell count decline in patients not receiving ART is only approximately 50 cells/µL per year.41,42 Based on our experience with HIV-infected patients in this setting, most patients enter care shortly after receiving their CD4 cell count result. Also, in only half the patients did the CD4 cell count decrease from Test 1 to Test 2 and only a fifth had a consistent step-wise drop in CD4 cell count across the three tests, making it unlikely that progressive immuno-suppression accounts for the study findings. The urban nature and high percentage of migrants of the study participants reflects the population in inner-city Johannesburg, 43 but differs from other parts of the country, limiting the generalisability of our findings. We also cannot extend our findings to pregnant women, given that they were excluded and considerable changes in CD4 cell count occur in pregnancy and postpartum.44,45 Finally, the results may also not hold true of patients with a CD4 cell count above 350 cells/µL, though arguably, differences in CD4 cell count in those patients are less clinically relevant.
Conclusions
Despite the diminishing role of CD4 cell count in ART programmes, these tests still impact on eligibility for antimicrobial prophylaxis, monitoring of immunological outcomes, differential diagnoses of ill patients (especially those with respiratory and neurological conditions) and priority setting for sicker patients. Clinicians need to consider that fluctuations in CD4 cell count measures of patients, oftentimes quite substantial, may be due to measurement error and the inherent variability of CD4 cell count testing, rather than effects of HIV disease or ART. The impact of CD4 cell count variability was most evident in the misclassification analysis at different CD4 cell count thresholds, which could affect the clinical care of a notable proportion of patients. This is especially important in the many settings where viral load measures are not available and decisions about switching to second- or third-line treatment are predicated on a patient’s CD4 cell count.
Clearly, CD4 cell count thresholds stipulated in ART and HIV care guidelines must not be applied rigidly and not used as the sole criterion for making decisions about patient care, but rather as one factor contributing to such decisions. To assist clinicians to interpret CD4 cell count, we suggest that the inherent variability of CD4 cell count be stated explicitly in laboratory reports. In this approach – long overdue and equally applicable to viral load and other tests – laboratories would report the absolute CD4 cell count result, together with the coefficient of variation of the laboratory and a corresponding ‘confidence interval’ around the absolute count. This might go a long way to improving interpretation of CD4 cell count, avoiding unnecessary changes to clinical care and anxiety in patients and incentivising laboratories to enhance the quality of their procedures.
Footnotes
Acknowledgements
We thank the participants, study team and the South African Department of Health for their help in the study.
Authors’ contributions
WDFV and MFC conceived of the study, did the primary analysis and first draft of the paper; GA, NA, M Majam, M Moorhouse and NM all helped in finalising the data sets and contributed to various drafts of the paper. DG provided senior scientific guidance and direction for the paper.
Declaration of conflicting interests
The authors declared no potential conflicts of interest with respect to the research, authorship, and/or publication of this article.
Funding
The authors disclosed receipt of the following financial support for the research, authorship, and/or publication of this article: The study was largely funded by the Bill and Melinda Gates Foundation, with support from PEPFAR.
Ethics approval and consent to participate
The study was approved by the University of the Witwatersrand’s Human Research Ethics Committee (Medical; ref. 111112). All screened participants provided written informed consent.
Consent for publication
Not applicable.
Availability of data and material
Excel spreadsheets are available from the corresponding author.