
Abstract
Identifying people living with human immunodeficiency virus (PLHIV) in human immunodeficiency virus (HIV) care who are at particular risk of non-retention in care is an important element in improving their HIV care outcomes. The purpose of this study was to develop a risk prediction tool to identify PLHIV at risk of non-retention in care over the course of the next year. We used stepwise logistic regression to assess sociodemographic, clinical and behavioral predictors of non-retention in HIV care. Retention in care was defined as having evidence of at least two encounters with an HIV care provider (or CD4 or viral load lab tests as a proxy measure for the encounter), at least three months apart within a year. We validated the risk prediction tool internally using the bootstrap method. The risk prediction tool included a total of six factors: age group, race, poverty level, homelessness, problematic alcohol/drug use, and viral suppression status. The total risk score ranged from 0 to 17. Compared to those in the lowest quartile (0 risk score), those who were in the middle two quartiles (score 1–4) and those in the upper quartile (>4 risk score) were more likely not to be retained in care (odds ratio [OR] 1.63 [confidence interval, CI: 1.39 – 1.92] and OR 4.82 [CI: 4.04 – 5.78], respectively). The discrimination ability for the prediction model was 0.651. We conclude that increased risk for non-retention in care can be predicted with routinely available variables. Since the discrimination of the tool was low, future studies may need to include more prognostic factors in the risk prediction tool.
Introduction
The navigation of people living with human immunodeficiency virus (PLHIV) across the human immunodeficiency virus (HIV) care continuum includes being diagnosed with HIV, linked to care, engaged in care, retained in care, adhering to antiretroviral therapy (ART), and having a suppressed HIV viral load. 1 A goal of the United States (US) National HIV/AIDS Strategy is to increase the percentage of persons with diagnosed HIV infection who are retained in HIV medical care to at least 90% by 2020. 2 The Centers for Diseases Prevention and Control (CDC) monitors retention in care using laboratory data from jurisdictions with complete reporting of CD4 and viral load test results. In 2015, only 57.2% of PLHIV were retained in care. 3 Among 38 states with complete lab reporting for 2015 and 2016, none met the National HIV/AIDS Strategy 2020 target of 90%, 21 made progress toward the 2020 target, and 17 made no progress. 3
Factors related to demographics, behavior, psychosocial, and physical health affect retention in HIV care. 4 Those factors include substance use, 5 – 7 belonging to a racial ethnic minority group, 5 , 8 , 9 mental health problems, 6 , 7 young age,5,10–12 female gender, 9 , 11 injection drug use (IDU) as the vector for infection, 8 – 10 having public health insurance, 13 health literacy, 14 intimate partner violence, 15 low socioeconomic status, 7 , 9 past-year missed treatment visits, 16 and greater unmet socioeconomic needs such as housing, food, or transportation. 7 , 9 Some studies have synthesized these factors and devised a risk prediction tool to identify people who might be poorly retained in HIV care. A study attempted to develop a clinical decision tool to estimate the probability of being lost to follow-up among adults initiating ART in resource-limited settings. 17 The study found that young age and advanced WHO disease stage were significant predictors of being lost to follow-up, but the model had weak ability to discriminate those who will remain in care from those who will be lost to follow-up. Another study developed a risk score to identify HIV-infected women who are most likely to be lost to follow-up in the postpartum period. 18 Parity, education, employment status, WHO clinical stage, duration of combination ART during pregnancy, and number of antenatal care visits were found to predict being lost to follow-up. Woodward et al. developed a risk prediction tool for medical appointment attendance among HIV-infected persons with unsuppressed viremia. 19 They found that active substance abuse, poor adherence to daily medications, history of missing HIV care appointments, prior treatment failure, prior exposure to ART (defined as any prior exposure to nucleot(s)ide reverse transcriptase inhibitor, non-nucleoside reverse transcriptase inhibitor, and protease inhibitor classes OR a current regimen containing enfuvirtide), most recent CD4 + lymphocyte count <100 cells/mm3, and most recent viral load > 200 copies/mL predicted poor medical appointment attendance. 19
Poor retention in care can lead to undesirable HIV outcomes at the individual and population levels. 9 Poor retention in care has been found to be associated with higher viral loads, lower CD4 cell counts, 12 higher rates of ART failure, decreased likelihood of receiving ART, increased HIV transmission risk behavior, increased hospitalization rates, and worse survival. 9 Therefore, retention in HIV care is a key step to improve HIV outcomes and overall health of PLHIV. The aim of this study was to identify people in HIV care who are likely to be poorly retained in care over the course of the following year using sociodemographic, clinical, and laboratory information.
Methods
We used retrospective data from the Miami-Dade County (Florida) Ryan White Program (RWP) Part A/Minority AIDS Initiative (MAI) for the calendar years 2016–2017 to assess the relationship between sociodemographic, clinical and behavioral variables, and risk of non-retention in HIV care, with a primary focus on routinely available variables. The RWP Part A provides core medical, medical case management, pharmaceutical, and related support services to low-income people with HIV in metropolitan areas heavily impacted by HIV/AIDS (“Eligible Metropolitan Areas,” or EMAs), to improve their access to HIV care and their health outcomes; the MAI program provides additional support for a subset of these services, targeted toward ethnic and racial minorities in these EMAs.
Study population
The population was PLHIV who were actively enrolled in (and receiving services from) the RWP Part A/MAI program in the Miami-Dade EMA in 2016. Enrollment was defined as having received at least one medical case management encounter or peer education support network service in 2016. We measured risk factors in 2016, and the outcome (non-retention in care) was measured in 2017. Risk factors were obtained from the RWP’s comprehensive health assessment, patient intake assessment and laboratory results entered into the patient’s electronic medical records. The comprehensive health assessment is a health and social needs assessment of RWP patients that is completed every six months to determine the plan of care and needs for referrals to other services. Patient intake assessment includes demographic data collected at time of entry into the RWP. We excluded people who had no comprehensive health assessment in 2016, or were <18 years old in January 2016, who died in 2016 or 2017, or were out-of-network referrals in 2016 or 2017. Out-of-network referrals are people who were referred to the RWP from a non-RWP provider, receiving a single service but not receiving regular medical case management, and for whom assessments of retention would not be available. We also excluded clients if their case was closed because of movement to another state/county, financial ineligibility, or incarceration for greater than six months in 2016 and 2017. Moreover, clients diagnosed with HIV infection in 2016 and those who received their first RWP care in 2016 but who had no viral load measurement in 2016 were excluded from the analysis. We deleted four people who had missing information about problematic alcohol/drug use in 2016.
Measurements
The following variables were considered in the development of the risk prediction model: age (18–24, 25–39, and ≥40 years), gender assigned at birth (male/female), race (Black/other), transgender status (yes/no), Hispanic ethnicity (yes/no), homelessness (includes homeless patients and patients in transient or transitional housing) (yes/no), CDC-defined AIDS status as of 2016 (yes/no), viral suppression in 2016 (yes/no), getting the food he/she needs (yes/no), access to transportation for healthcare/dental/social service appointments (yes/no), alcohol/drug use resulting in any problem in patients daily activity or legal issue or hazardous situation (yes/no), history of IDU, including IDU as the self-reported vector for the original HIV infection (yes/no), self-reported feelings of depression or anxiety (yes/no), and income <100% of the federal poverty level (FPL) (yes/no). FPL <100% in 2016 was defined as having a household income less than $11,880 for a single person. 20 Problematic alcohol/drug use was derived from three questions, namely (a) Has alcohol/drug use resulted in a hazardous situation? (b) Has alcohol/drug use resulted in legal problems? and (c) Is your alcohol/drug use preventing you from carrying out your daily activities? History of IDU includes injection drug users and men who have sex with men who are also injection drug users.
Outcome
The outcome of the study was non-retention in HIV care in 2017. We defined retention in care as having evidence of at least two occurrences of any combination of (a) face-to-face encounter(s) with a Ryan White Program medical care professional or (b) laboratory tests (CD4 or viral load) at least three months apart during 2017.
Analysis
First, we selected risk factors to be included in the bivariate analysis based on evidence from literature and completeness of information in the dataset, and we estimated unadjusted odds ratios. Variables associated with non-retention in HIV care at p-value <0.1 in bivariate analysis were included in the initial multivariate logistic regression model. We used stepwise backward elimination, retaining variables which maintained significance at p < 0.05 in the final model. We used Akaike information criterion to check the model fit. 21 We checked for any confounding effect of the excluded variables in the final model. Discrimination was assessed using concordance statistic or C-statistic (which is equal to the area under the receiver operating characteristic [ROC] curve), and calibration was assessed using calibration plots by dividing subjects into deciles of risk. 22
We validated the risk score tool internally using the bootstrap method with the original derivation data set. A total of 1000 samples were created by sampling with replacement, and each bootstrap sample was the same size as the original derivation sample. For each sample, the model was refitted following the same method adopted in the derivation process. We computed model performance (C-statistic) on each bootstrap sample and compared with the model performance in the original data to calculate optimism (magnitude of bias). The optimism adjusted C-statistic was computed by subtracting the optimism from the original C-statistic. 23
Finally, we generated a simple integer-based risk score for each predictor variable by multiplying the beta coefficients by 10 and rounding to the nearest integer. 18 , 23 The total risk score was calculated by adding each component together. We divided the population into strata based on quartiles of the total risk score by placing cut points at the 25th, 50th, and 75th percentiles. 24 , 25 We also calculated the sensitivity and specificity at each risk score cutoff point. The predictive performance of the risk score was evaluated by means of discrimination and calibration. All analyses were conducted using SAS software V. 9.4 (SAS Institute Cary, NC). This study was approved by the Florida International University Institutional Review Board.
Results
Of the total 9011 PLHIV enrolled in RWP in 2016, 7439 people were included in our analysis. A total of 1572 PLHIV were excluded for various reasons (Figure 1). About 24% (1759) of the 7439 were not retained in HIV care during 2017. The mean age and standard deviation of the study population was 44.4 ± 11.9 years. About 64% of the population were older than 40 years, 59.7% were Black, 76.2% were male, and 55.7 were Hispanic (Table 1).
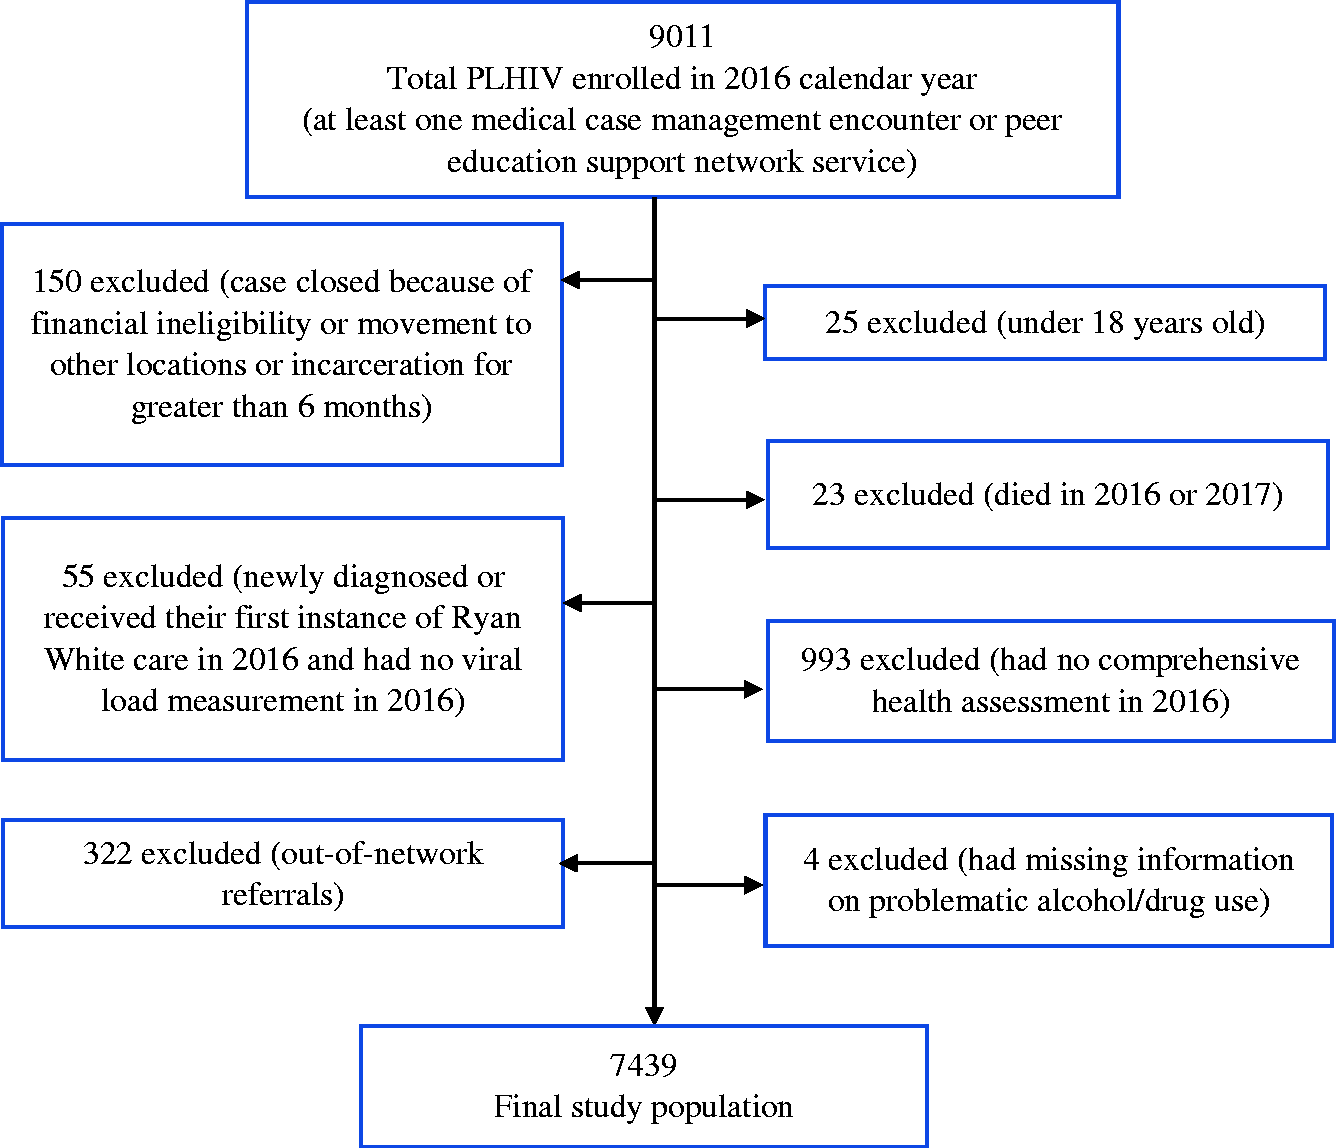
Diagram for exclusion of participants from the present study.
Population characteristics and model of risk variables associated with non-retention in care among PLHIV (N = 7439).
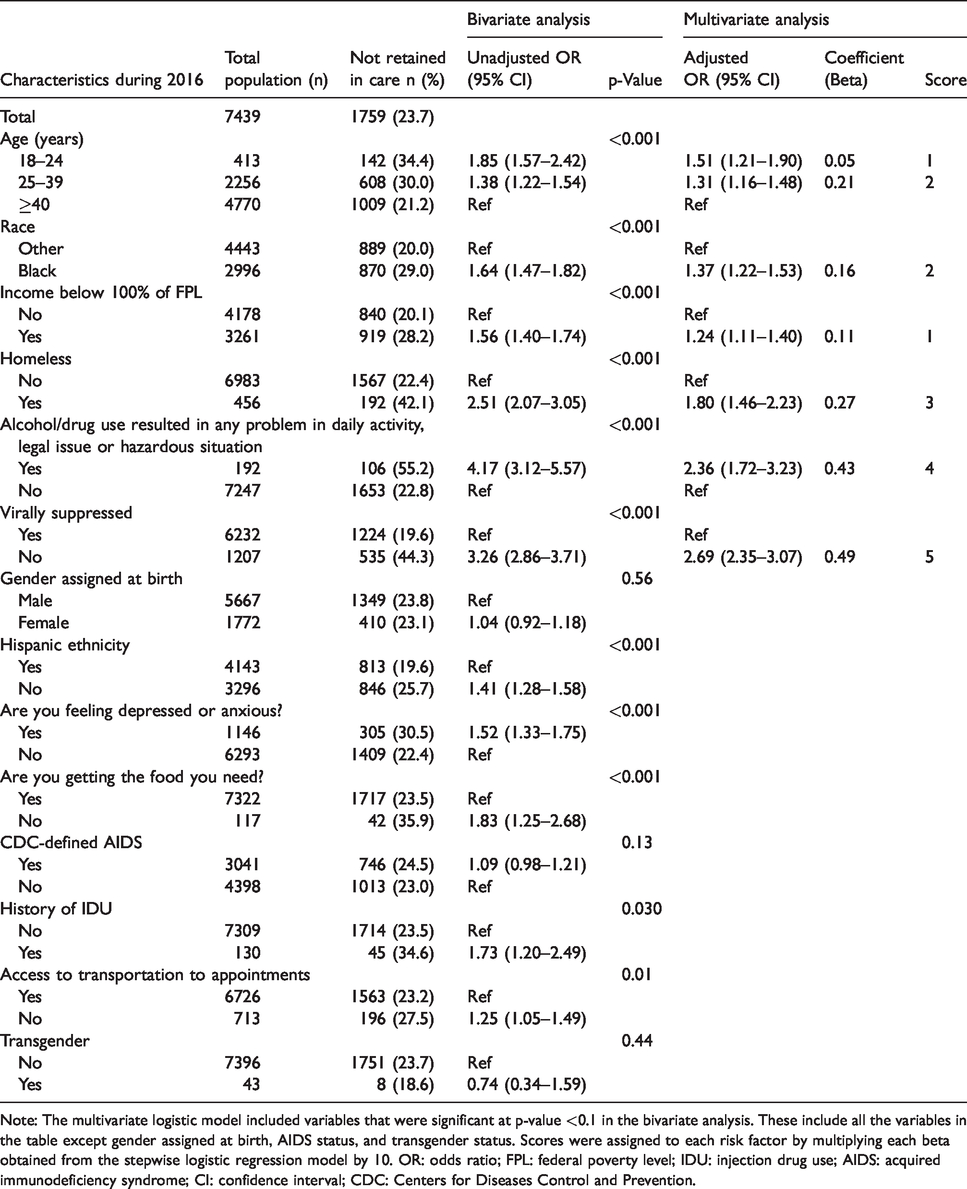
Note: The multivariate logistic model included variables that were significant at p-value <0.1 in the bivariate analysis. These include all the variables in the table except gender assigned at birth, AIDS status, and transgender status. Scores were assigned to each risk factor by multiplying each beta obtained from the stepwise logistic regression model by 10. OR: odds ratio; FPL: federal poverty level; IDU: injection drug use; AIDS: acquired immunodeficiency syndrome; CI: confidence interval; CDC: Centers for Diseases Control and Prevention.
Of the 14 potential variables considered, 11 variables were associated with non-retention in HIV care at p-value <0.1. In the bivariate analysis, age in 2016, race, poverty level, homelessness, alcohol/drug use resulting in any problem in daily activity, legal issue or hazardous situation, viral suppression status, Hispanic ethnicity, feeling depressed or anxious, and food need were significant at p-value <0.001, whereas history of IDU and access to transportation were significant at p-value <0.05 (Table 1). Gender assigned at birth, transgender status, and AIDS status as of 2016 were not associated with retention in care in 2017 (p-value > 0.1). In the stepwise logistic regression analysis, six variables maintained significance level at p-value <0.05 level in the final model (Table 1). The six variables were age, race, poverty level, homelessness, alcohol/drug use resulting in any problem in daily activity, legal issue or hazardous situation, and viral suppression status. The discrimination of the overall model with the six variables was 0.654 (Figure 2(a)), and after adjusting for optimism, the discrimination was 0.651. Based on the calibration plot, the agreement between the observed and predicted proportion of events of non-retention in HIV care showed good apparent calibration (Figure 2(b)).
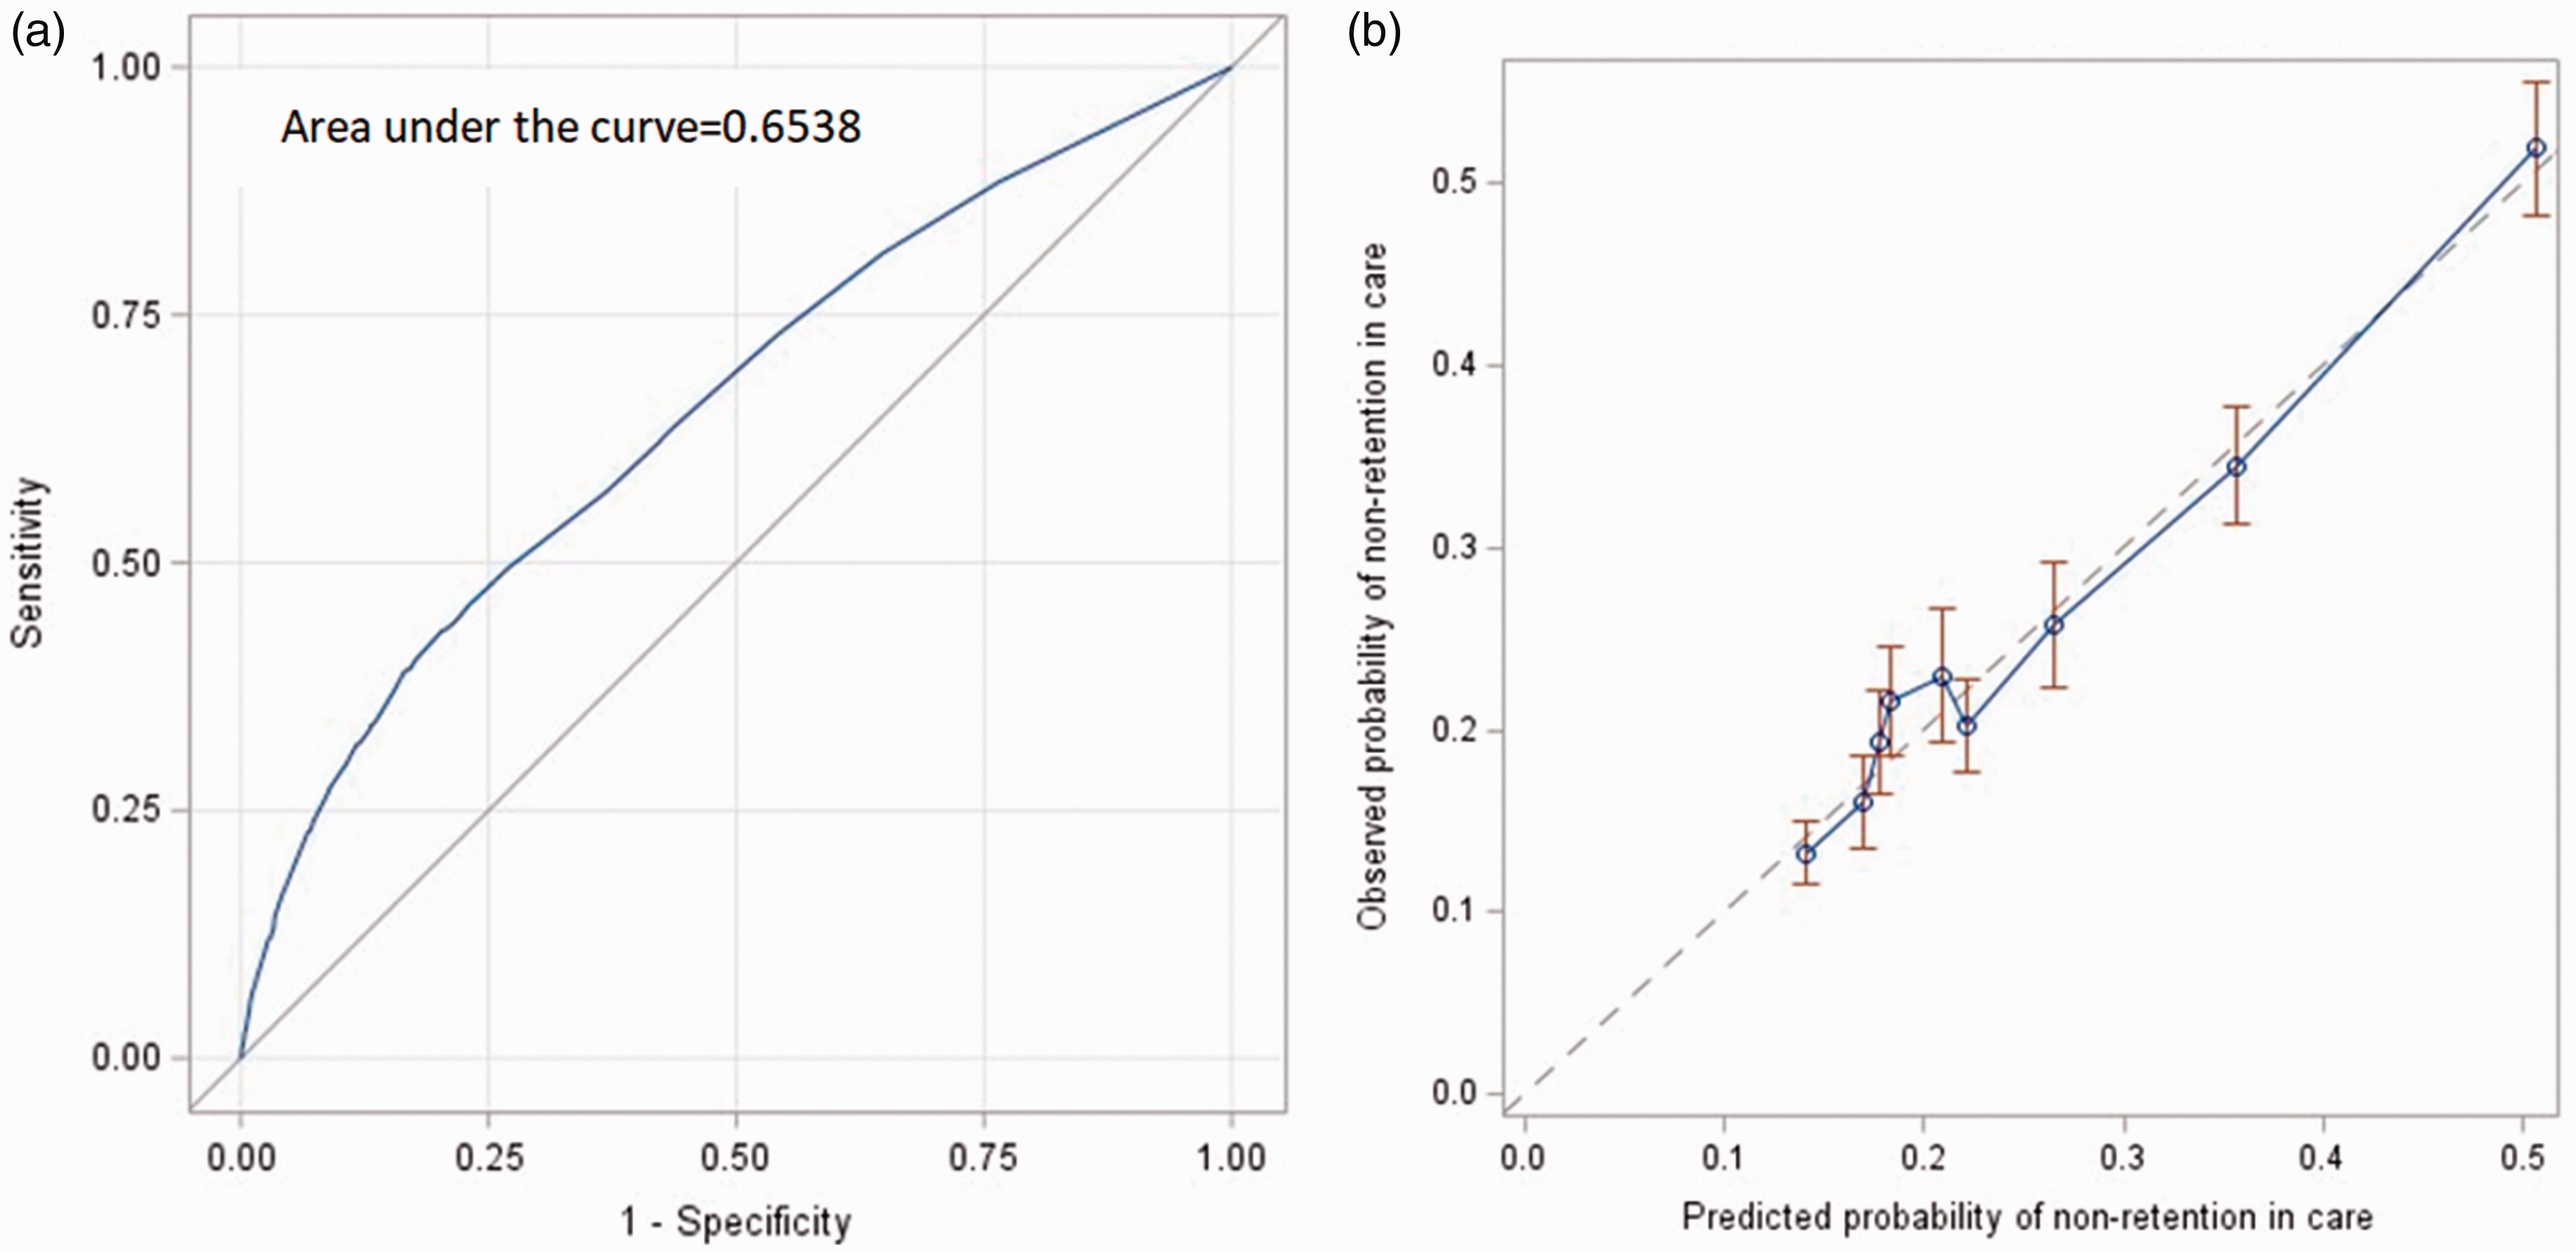
(a) Discrimination of the final model and (b) calibration of the final model.
The final risk prediction tool included six risk factors present in 2016 that can be used to predict non-retention in HIV care over the course of 2017 (Figure 3). Each risk factor contributed additively to an overall risk score, as follows: having unsuppressed viral load had a risk score of 5, being homeless had a risk score of 3, being Black had a risk score of 2, being in the age group 18–24 had a risk score of 1, being in the age group 25–39 had a risk score of 2, having income below 100% of the FPL had a risk score of 1, and alcohol/drug use resulting in any problem in daily activity, legal issue, or hazardous situation had a risk score of 4. The minimum total risk score was 0 for a person without any of the risk factors and the maximum possible risk score was 17. A person with a total risk score of 0 had 14.4% probability of not being retained in HIV care in 2017, and a person with a total risk score of 17 had 82.5% probability of not being retained in HIV care. As the risk score increased, the probability of non-retention in care increased. Every one-point increase in the risk score scale was associated with OR 1.22 (95% confidence interval, CI: 1.20 – 1.24) increase in non-retention in care. The discrimination of the risk score was 0.650. We divided the risk scores into three categories based on quartiles placing cut points at the 25th and 75th percentiles. There were 1559 (21.0%) people in the first quartile (0 risk score), and 211 (13.5%) of these were not retained in HIV care. In the second and third quartiles (score 1–4), there were 4331 (58.2%) people; in the upper quartile (>4 risk score), there were 1549 people (20.8%). About 20% (882) of those in the second and third quartiles and 43.0% (666) of those in the upper quartile were not retained in HIV care. Compared to those in the first quartile, those who were in the middle two quartiles and those in the upper quartile were more likely not to be retained in care (OR 1.63 [CI: 1.39 – 1.92] and OR 4.82 [CI: 4.04 – 5.78], respectively). The cutoff value of 4 had a sensitivity of 43% and specificity of 80% and a cutoff value of 5 had a sensitivity of 38% and specificity of 84%. Similarly, a cutoff value of 3 in the risk score had a sensitivity of 56% and specificity of 65%.
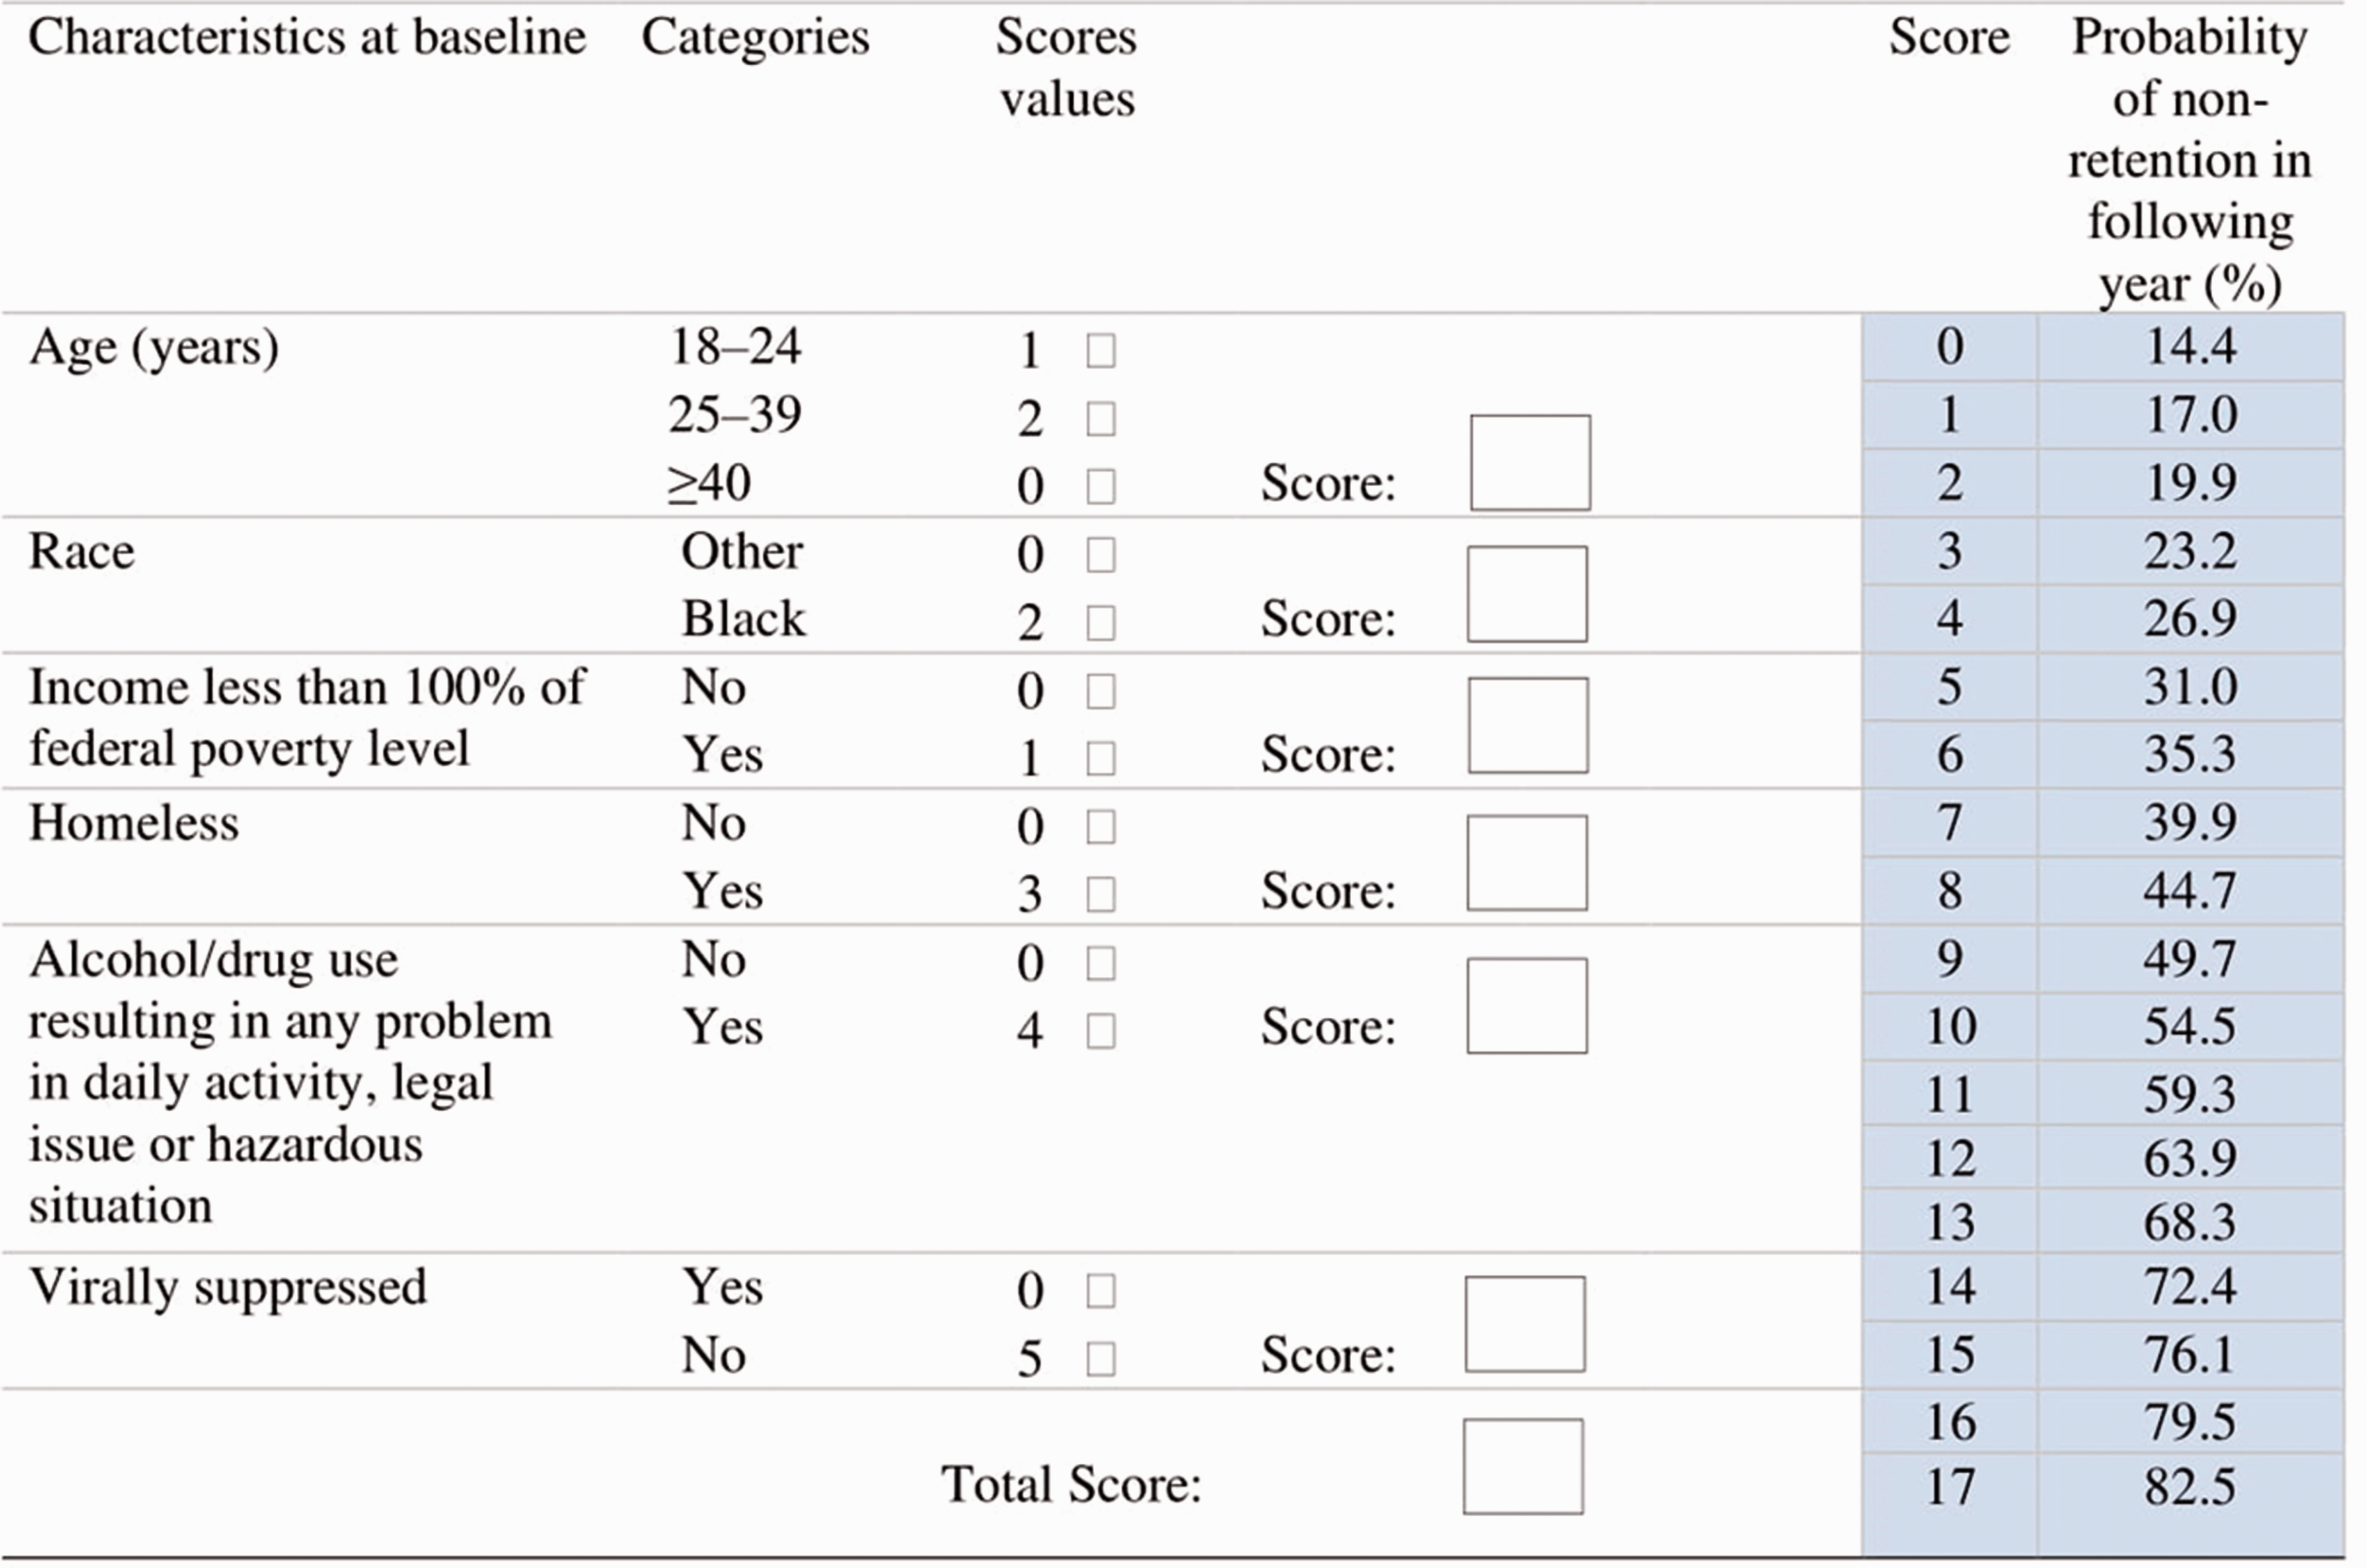
Point scores for all risk factors in the logistic regression model. The predicted probabilities of non-retention in HIV care for the total risk score ranged from 14.4% for a patient with 0 total score to 82.5% for a patient with 17 total score. To get the total score for individual person, we should add the scores of the six variables. For example, for patient who is 20 years old (score = 1), White (score = 0), income equal to or higher than 100% of FPL (score = 0), homeless (score = 3), with no problematic alcohol/drugs use (score = 0), and has unsuppressed viral load (score = 5), the total score will be 9 (1 + 0 + 0 + 3 + 0 + 5). A person with total score of 9 had 49.7% probability of not being retained in care in the next year.
Discussion
In this study, we derived and internally validated a risk prediction tool for non-retention in HIV care in the next year using retrospective data from Miami-Dade County RWP Part A/MAI. This risk prediction tool can be used in clinical settings by HIV care providers to identify PLHIV who will not be retained in HIV care in the next year. We found that the risk score constitutes age group, race, poverty level, homelessness, problematic alcohol/drug use, and viral suppression status. These variables can be extracted easily from medical records or by interviewing the patient and can be implemented in a variety of settings.
The individual factors included in our risk prediction tool have been previously found to predict retention in care. Consistent with findings in previous studies, unsuppressed viral load and age group predict retention in HIV care.5,10–12,17,19 Similarly, persons living with HIV who are homeless or have low economic status have been found to be poorly retained in care. 7 , 9 , 26 , 27 This is likely due to unmet social service needs. 27 People who use alcohol/drugs are at increased risk of poor adherence and non-retention in HIV care. 28 – 31 This may be due to the behavioral factors associated with alcohol/drug use. Moreover, being Black/African American has been identified as a risk factor increasing non-retention in care. Historical and cultural factors as well as structural racism may affect the retention of African Americans in HIV care. 32 Therefore, inclusion of Black race in the risk prediction tool is likely a proxy for underlying social, cultural, and economic factors. Inclusion of race in the risk prediction tool may lead to unconscious bias by healthcare providers about Blacks. Addressing racial bias needs comprehensive, multifaceted, and evidence-based interventions at the individual and organizational level including leadership commitment to a cultural inclusion, diversity training, self-reflection on personal biases, mentorship and sponsorship, and cultural competency. 33
We stratified the population into quartiles, and patients with a total risk score >4 were classified in the fourth quartile. The risk of non-retention in care showed a graded increase across the quartiles. Those who were in the fourth quartile were about five times as likely not to be retained in care compared with those who were in the first quartile. A cutoff value of 5 in the risk score had a sensitivity of 38% and a specificity of 84%. This cutoff identified 20.8% of our study population with the highest likelihood of non-retention in care for intervention. Based on this risk score cutoff, non-viral suppression, independent of other factors in the risk score, contributes to one-third of the total risk score. Thus, viral suppression is a good predictor to use for identifying patients that may benefit from a retention intervention. Alternatively, a lower cutoff point in the risk score would yield higher sensitivity and lead to targeting a larger proportion of the population for a retention intervention.
Previous risk prediction tools developed to predict patient adherence to appointments or retention in care were either restricted to specific populations or had different outcome definitions. The study by McNairy et al. measured lost to follow-up based on a single clinic or pharmacy visit during 365 days after ART initiation. 17 Our definition of retention in care was based on two or more clinic visits or laboratory tests at least three months apart during a year. Bengtson et al. developed a risk prediction tool among HIV-infected women and they included different predictors specific to pregnant women such as parity and number of antenatal care visits. 18 Woodward et al. used a tool previously developed for virologic failure to stratify patients based on medical appointment attendance (defined based on a single visit) among persons with unsuppressed viremia. 19 The definition of the outcome and the target population are different from ours. Some factors such as substance use and viral suppression were common predictors in our risk prediction tool and theirs. However, Woodward et al. included additional predictors such as prior treatment failure, adherence to daily medications, history of missing HIV care appointments, and prior exposure to ART which may be better predictors of retention in care but are not readily collected in our study.
The risk prediction tool is intended to be used in HIV care settings where the characteristics of the target population are similar to ours. Upon arrival of a patient to the HIV care setting, an HIV care provider could assess the probability of a patient not being retained in HIV care in the next year using this checklist. Depending on the availability of resources, HIV care providers may arrange for an intervention to support retention based on severity of risk in order to improve HIV outcomes34,35 and reduce HIV transmission.36,37 Retention in HIV care can be improved by incorporating informational, motivational, and behavioral skill components. 9 Peer navigators and clinic-wide marketing (e.g. posters, brochures) including targeted messages on staying in care which were delivered at minimal effort and cost have been found to be effective in improving clinic attendance.7,38,39 Designating a staff person to help with appointments, referrals, system navigation, service coordination, and transportation may improve retention in HIV care.7,40 Enhancing personal contact with patients and asking open-ended questions in regular conversations at every office visit may help to identify specific ART adherence and retention support services.7,41
Our study has several limitations. First, in our analysis, we included variables that are routinely collected and easily available to care providers. However, these variables were not strong predictors of non-retention in care. The discriminative ability of our study is low (0.651), 42 although it is higher than that of the study by McNairy et al. 17 Moreover, we were not able to find a risk score cutoff with higher sensitivity and specificity. This indicates that other predictive variables could have been included in the risk prediction tool to improve its discriminative ability. Factors such as adherence to daily medications, sexually transmitted infections, previous appointment attendance, prior treatment failure, 19 and other unmet needs7,9 may increase the discriminative ability of the risk prediction tool. However, information about these factors may not be routinely accessible to the HIV care providers, or collecting these factors may require additional resources and increase the workload for HIV care providers or support staff. Although the discrimination level is relatively low, this tool can be used in situations where these additional variables are not available. Second, we used RWP Part A/MAI data to develop and internally validate our risk prediction tool. The Ryan White Program provides medical care, medical case management, anti-retroviral prescription drugs and other support for PLHIV without health insurance. Thus, Ryan White Program participants may not be representative of all PLHIV. Third, people newly diagnosed with HIV infection may behave differently due to experiencing additional challenges related to acceptance of their diagnosis and stigma. Therefore, they may require a different risk prediction tool. Finally, of those enrolled in 2016, we were not able to find laboratory results for 917 people during 2017. In a separate analysis, we excluded those people and the results were similar with the model that included those 917 people.
In summary, we developed a relatively simple prediction tool that can be used to identify PLHIV who are at risk of non-retention in HIV care. This tool includes characteristics that are routinely collected in healthcare settings. These factors include age group, race, poverty level, homelessness, problematic alcohol/drug use and viral suppression status. The risk prediction tool has low discrimination power but could be a good alternative tool in situations where additional data are not available. Further research should include better predictive variables to enhance the accuracy of this risk prediction tool.
Footnotes
Declaration of conflicting interests
The authors declared no potential conflicts of interest with respect to the research, authorship, and/or publication of this article.
Funding
The authors disclosed receipt of the following financial support for the research, authorship, and/or publication of this article: This research was supported in part by the National Institute on Minority Health and Health Disparities (NIMHD) under Award Numbers R01MD012421, R01MD013563, 5S21MD010683, K01MD013770, U54MD012393, and Florida International University graduate school dissertation year fellowship. The content is solely the responsibility of the authors and does not necessarily represent the official views of the National Institute on Minority Health and Health Disparities or National Institutes of Health.