
Abstract
We examined the association between alcohol consumption, adherence and viral load (VL) in a cohort of 940 alcohol-consuming, human immunodeficiency virus (HIV)-positive men receiving antiretroviral therapy in Mumbai. Some of the participants (16.7%) had missed >1 doses in the last four days and 17.6% reported >1 treatment interruptions in the last 12 months; 60.8% of the participants consumed alcohol >2 times/month, 62.8% consumed >3 drinks/typical day and 11.5% reported binge drinking >1 times/month; 76.4% of the participants had VL<200 copies/mL. Higher alcohol consumption was associated with nonadherence (odds ratio [OR]: 1.21; 95% confidence interval [CI]: 1.11–1.31) and treatment interruptions (OR: 1.20; 95% CI: 1.11–1.31). We found no association between alcohol use and VL. There was, however, a significant interaction effect of alcohol use and nonadherence on virological failure (Adjusted Odds Ratio [AOR]: 1.23; 95% CI: 1.03–1.47) implying that alcohol negatively impacts VL outcomes but mediated through adherence. Alcohol use was associated with poor adherence, which in turn was a strong predictor of virological failure.
Introduction
In 2004, India introduced the free provision of antiretroviral therapy (ART) through government-run ART centers (ARTCs) for people living with human immunodeficiency virus (PLHIV).1,2 Central to India’s ART program is the need for PLHIV to maintain high adherence to medication. A key factor in non-adherence is alcohol consumption. 3 However, it has not been a focus area of the national treatment program, despite considerable evidence from studies in India that alcohol negatively affects adherence.4–6 These studies have measured adherence through self-reports but have not examined the relationship between alcohol and viral load (VL) because VL is not yet available for routine treatment monitoring in India’s ART program. This paper examines the relationship between alcohol, adherence and VL among alcohol-consuming PLHIV receiving treatment in five ARTCs in the greater Mumbai area.
HIV viral load (VL) and CD4 lymphocyte (CD4) count are the two surrogate markers of ART response and HIV disease progression that have been used to manage and monitor HIV infection. 7 A patient’s pre-ART VL level and the magnitude of VL decline after ART initiation provide prognostic information about the probability of disease progression.8–11 The goal of ART is to suppress viral replication to levels undetectable by laboratory assays, thereby preventing further deterioration of the immune system.8–12 Thus, VL is the established surrogate marker of response to ART. 7
However, VL varies over time, rising temporarily as blips due to transient bursts of immune activation, periods of poor adherence or assay variability, or more permanently with treatment failure and the development of viral resistance to antiretroviral medications.13–15 Treatment/virological failure (VF) when identified, necessitates a change in antiretroviral medications. However, the criteria used to define VF differ. The WHO uses a public health approach to define VF as persistently detectable VL exceeding 1000 copies/mL (two consecutive VL measurements within a three-month interval) after six months of starting a new ART regimen. 16 A more conservative clinical approach, used by the US Department of Health Human Services (DHHS) and the AIDS Clinical Trials Group, defines VF as a confirmed VL > 200 copies/mL—a threshold that eliminates most cases of apparent viremia caused by VL blips or assay variability.8,17 Persistent HIV RNA levels ≥200 copies/mL is often associated with viral evolution and accumulation of drug-resistance mutations.18,19 In this study, we have used the DHHS criteria as the definition of VF.
For ART to be effective, it is necessary for patients to take their medications regularly without interruptions. The association between non-adherence and higher risk of VF is well established and both research and clinical experience have emphasized the need for high levels of adherence (>95%) to obtain optimal viral suppression. 20 Given the challenges in accurately measuring adherence using self-reports, pill counts and Medication Event Monitoring System (MEMS), VL was touted as a measure of adherence with an undetectable VL indicating adequate adherence. 20 More recently, there is evidence to suggest that with more potent treatment regimens, the adherence threshold required to achieve durable viral suppression has declined (>50%).21–23 Given that resistance to ART medications can produce a high VL despite high adherence,8,16 and the variability of VL described above, questions have been raised about VL’s viability as a dependable biomarker for adherence.
With combination treatment offered in once-a-day formulations, the problems of high pill burden and dosing frequency are no longer relevant; however, medication-related side effects continue to contribute significantly to inconsistent adherence, even discontinuation of treatment.24,25 Positive perceptions among patients about their health-related quality of life have been found to be important predictors of better adherence.24,26 Other factors that influence adherence include mental health conditions such as depression, disclosure- and stigma-related concerns, alcohol use and access to services (distance from centers, timing of services, frequency of pickups).4,6,16,27,28 Of these, the presence of alcohol and depression are consistently associated with poorer adherence across studies.6,27,29
Alcohol use is common among PLHIV30–32 and the deleterious effects of alcohol consumption on ART adherence and treatment interruptions (TIs) are well known.6,33,34 High levels of alcohol consumption predict an increased risk of poorer mental health, liver dysfunction and all-cause mortality among PLHIV.35–38 The literature, however, is not conclusive about the effect of alcohol use on VL outcomes, nor is it conclusive on CD4 outcomes, a direct marker for immune function and predictor of VL. While some studies document a negative effect of alcohol on these two biological outcomes,32,36,38,39 others have found no association.34,40–42 Given the well-documented association between adherence and VF, and that between alcohol use and non-adherence, it is possible that adherence falls along the causal pathway between alcohol use and VF. However, studies have used differing criteria for alcohol use, adherence and VF. A recent review suggests that using measures that assess both quantity and frequency of alcohol consumption, and the use of higher cutoff criteria for adherence may yield stronger effect sizes. 33 With regard to VL, most studies have tended to use the conservative criteria of undetectable VL. At the same time, the definition of VF has been variable across studies, ranging from >75 to >400 copies/mL.34,39,41 Newer studies are increasingly using >200 copies/mL.13,17
To explore the associations between alcohol consumption, adherence and VL, this paper draws on baseline/enrollment data from a structured survey and VL test results from an intervention research project with 940 male PLHIV receiving treatment at five ARTCs in the greater Mumbai area. The project provides VL values for a unique population of alcohol-consuming HIV-positive men on ART and offers an opportunity to examine alcohol use, adherence and other factors associated with VL.
Methods
Study design
The five-arm randomized controlled study evaluates the outcomes of three different counseling interventions delivered separately and sequentially, and in combination (integrated intervention), to promote adherence and reduce alcohol use among alcohol-consuming male PLHIV receiving ART using a crossover study design. The three counseling approaches are delivered in differing sequences at three ARTCs over three time cycles, and as an integrated package at the fourth site (cycles 1–2: no intervention, cycle 3: integrated intervention), and compared with a control community at the fifth site (cycles 1–2–3: no intervention). To identify the five study sites, all ARTCs in the greater Mumbai area were listed out and a shortlist of 11 high-volume ARTCs was prepared in consultation with Maharashtra State AIDS Control Society. Five comparable centers were selected from this list based on high client volume and core services offered; these centers were randomly allocated to the five study arms.
Study population
An anonymous screener was administered to 9954 male PLHIV in the waiting rooms of the five centers to determine study eligibility. Male PLHIV who had been on ART for ≥6 months were ≥18 years old, and had consumed alcohol ≥1 times in the last 30 days were eligible to participate. The sample size was set at 188/site (N = 940) to allow for multilevel effectiveness analysis with 80% power while accounting for intra-cluster correlation (coefficient: 0.01–0.02) and attrition rate (cycle 1: 20%; cycle 2: 15%; cycle 3: 10%).
Outcome variables and covariates
Structured surveys were used to collect data on sociodemographic characteristics, ART, medication adherence, alcohol use, other predictors of nonadherence and HIV-treatment-related symptoms at baseline. Alcohol use was assessed using the ten-item Alcohol Use Disorders Identification Test (AUDIT) to measure alcohol consumption and identify the risks of alcohol use, dependence and associated problems. Scores were categorized as low risk: 0–7, moderate risk: 8–15, high risk: ≥16 as per AUDIT guidelines.
43
Scores from AUDIT-C, consisting of the first three items in the AUDIT that assess alcohol consumption (frequency and quantity) were used in multivariate analysis. Binge drinking was defined as consuming ≥6 drinks on one occasion. Adherence was assessed in two ways: a self-reported-four-day recall of missed medications that is widely used in ACTG studies calculated as follows (
CD4 testing using flow cytometry is routinely conducted every six months in ARTCs. CD4 values were obtained from patients’ records. VL testing was assessed using Polymerase Chain Reaction (PCR)-based RNA testing (Roche Cobas Taqman, 2.0, Japan); the lower limit of detection for this assay was 20 copies/mL. Phlebotomists from Super Religare Laboratories (SRL) Ltd. collected blood samples from study participants at the ARTCs during study visits. VF was defined as VL > 200 copies/mL. 8
The Indian Council for Medical Research and National AIDS Control Organization approved the study. Ethical approval was obtained from the Institutional Review Boards of the University of Connecticut, School of Medicine, and the Institute of Community Research in Connecticut, the Population Council in New York, the International Center for Research in Women in Washington, DC, and from the three teaching hospitals in Mumbai where ARTCs were located. All participants provided written informed consent.
Data analysis
Data were analyzed using Intercooled STATA 10.0 (STATA Corporation, College Station, TX). We explored the association between alcohol consumption, adherence and VL outcomes among all study participants (N = 940) at enrollment, irrespective of their study group. Unpaired Student’s t test was used to compare continuous variables with normal distributions, Chi square test to compare categorical variables and Pearson correlation to explore linear correlations. Using logistic regression, we first examined the association between the measures of alcohol use (AUDIT-C scores indicating alcohol consumption (model 1) and AUDIT scores reflecting the risk of dependence (model 2), non-adherence (self-reported-four-day recall <95%; TIs) and VF (VL > 200 copies/mL). To elucidate the relationship between alcohol and VL outcomes as potentially mediated by adherence, an interaction effect between alcohol and adherence was examined. To determine factors associated with VF, logistic regression analyses were conducted. Variables with a significant association (p < 0.05) on bivariate analysis were included in the multivariate model that was controlled for age and education. We included depression and alcohol use (AUDIT-C scores) in the multivariate model, even though they were not associated on bivariate analysis, to control their effect on adherence.
Results
Between October 2015 and April 2016, 9954 ART patients were screened, and of those 1807 (18.1%) met the eligibility criteria (Figure 1). Of these, 940 (52.1%) agreed to participate (188/center). Table 1 details the background characteristics of study participants at recruitment.
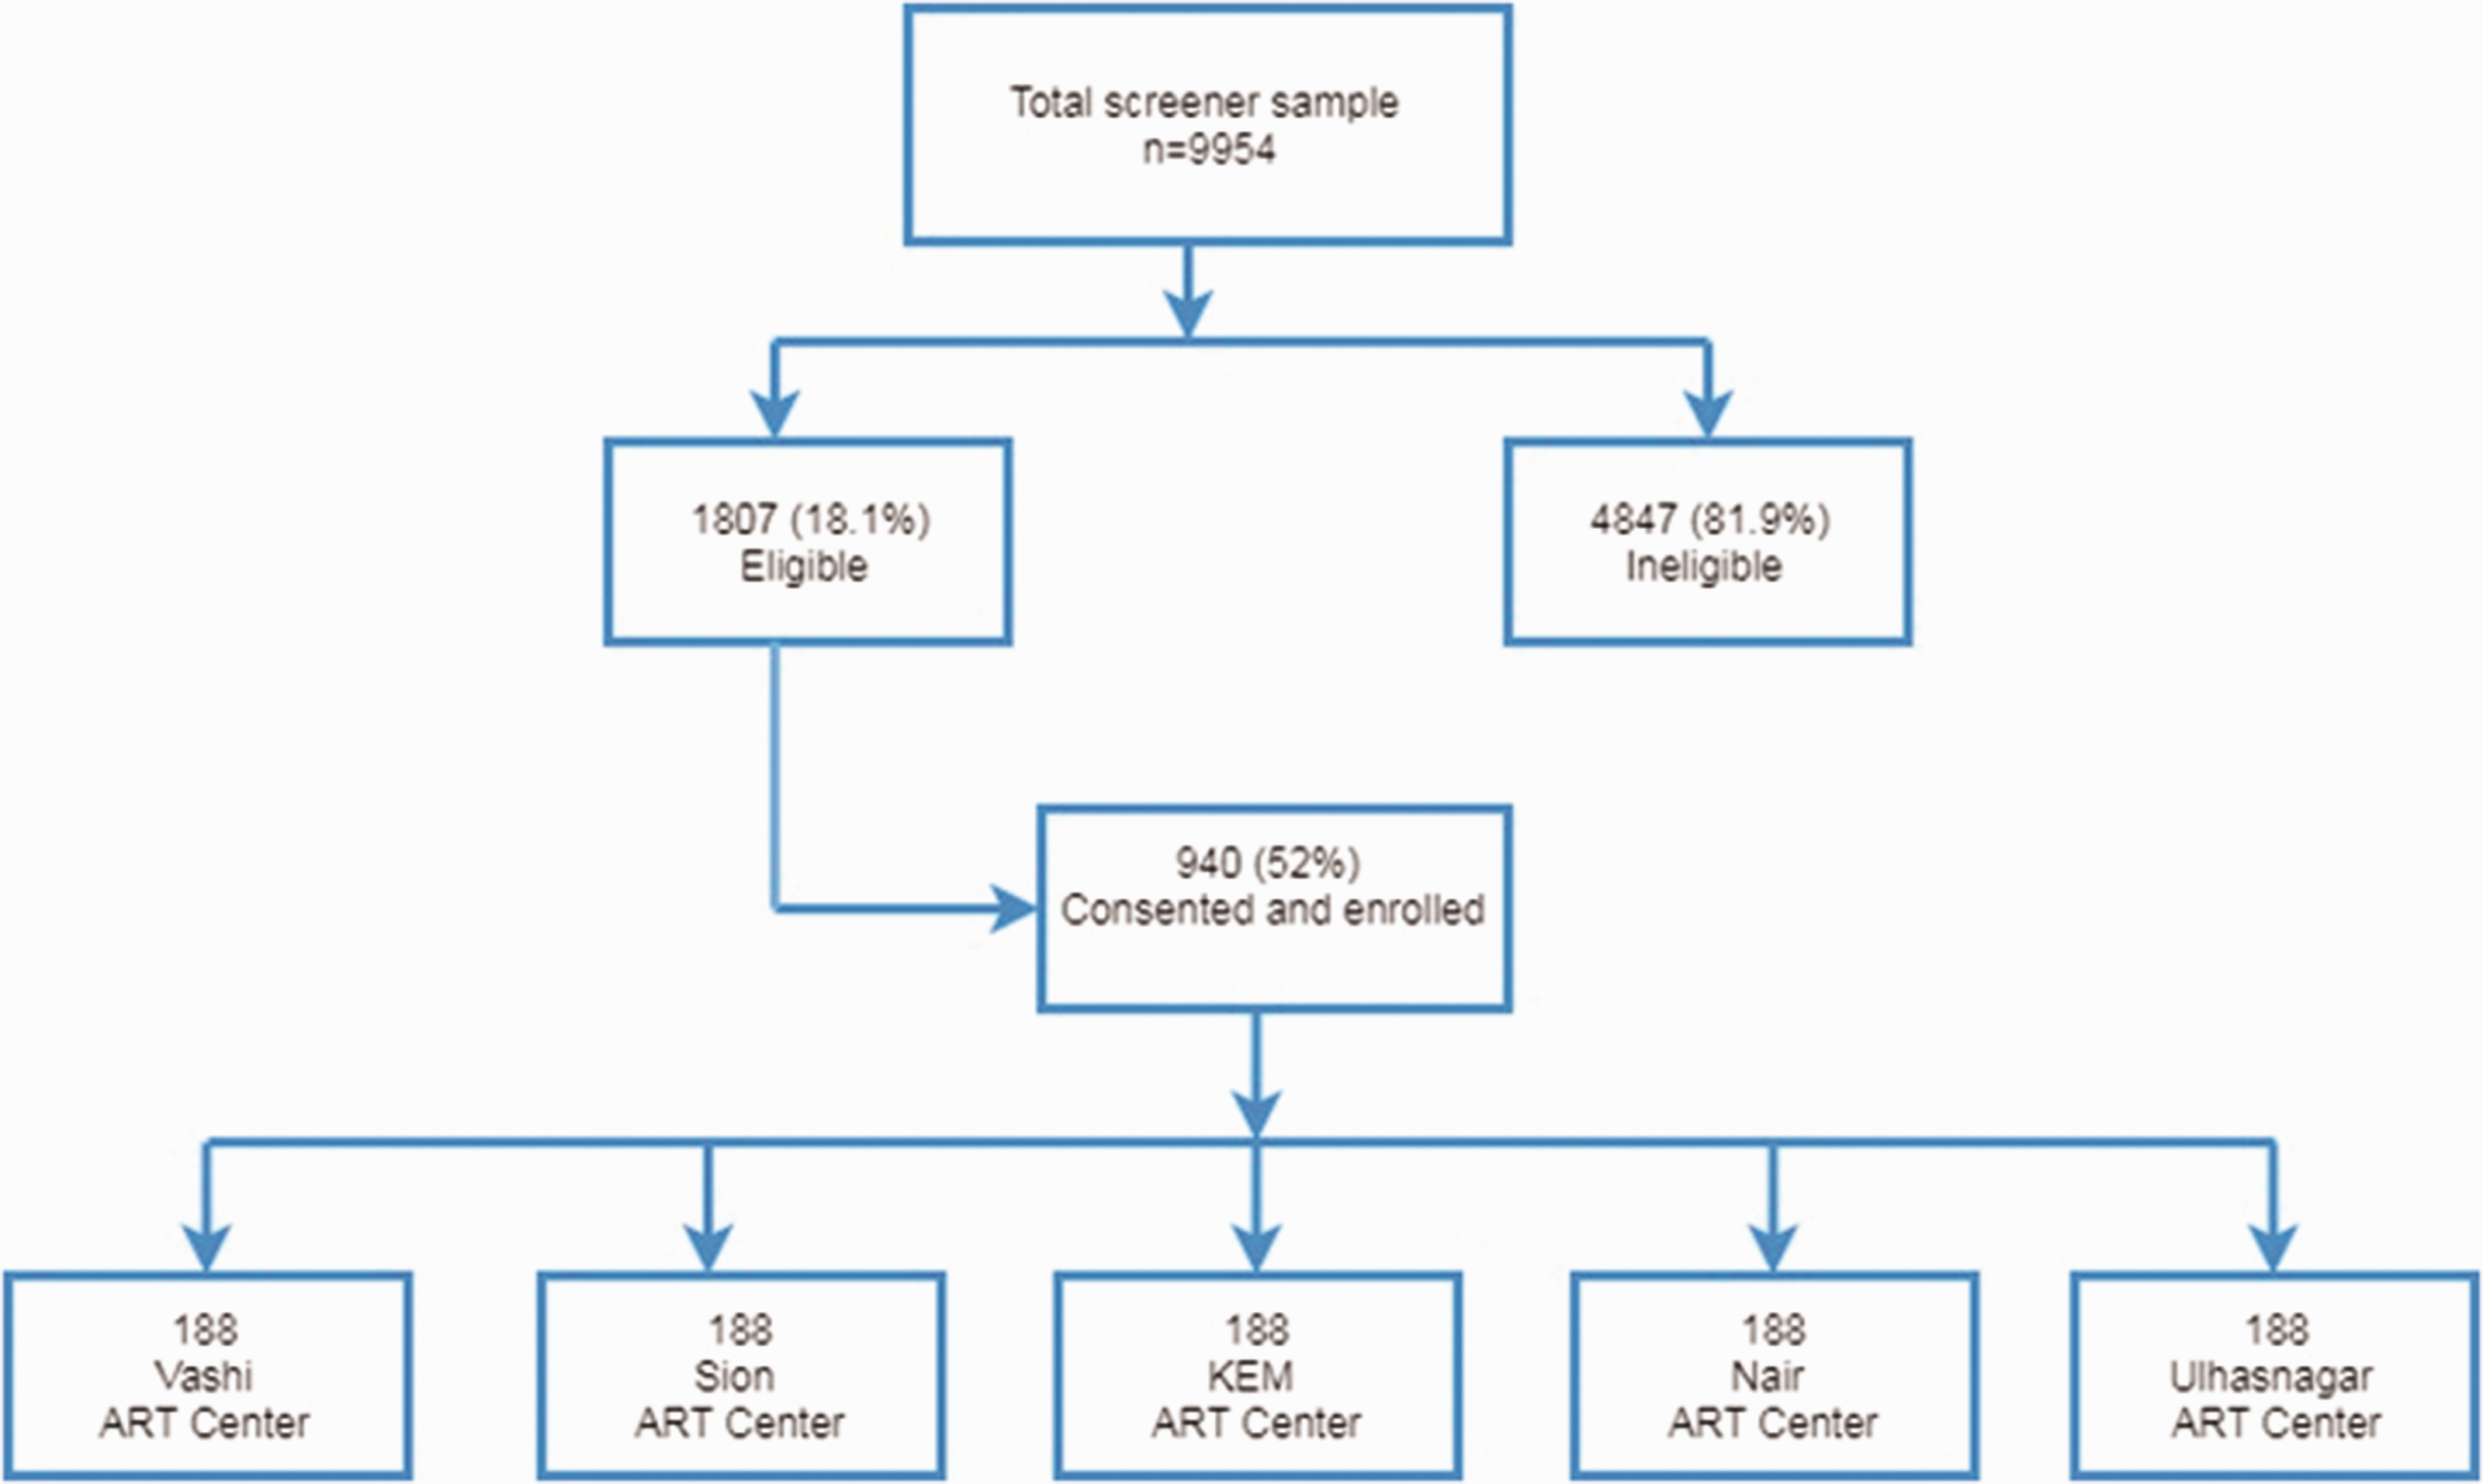
Flowchart showing the selection of the participants in the study.
Background characteristics of study participants at enrollment (2016).
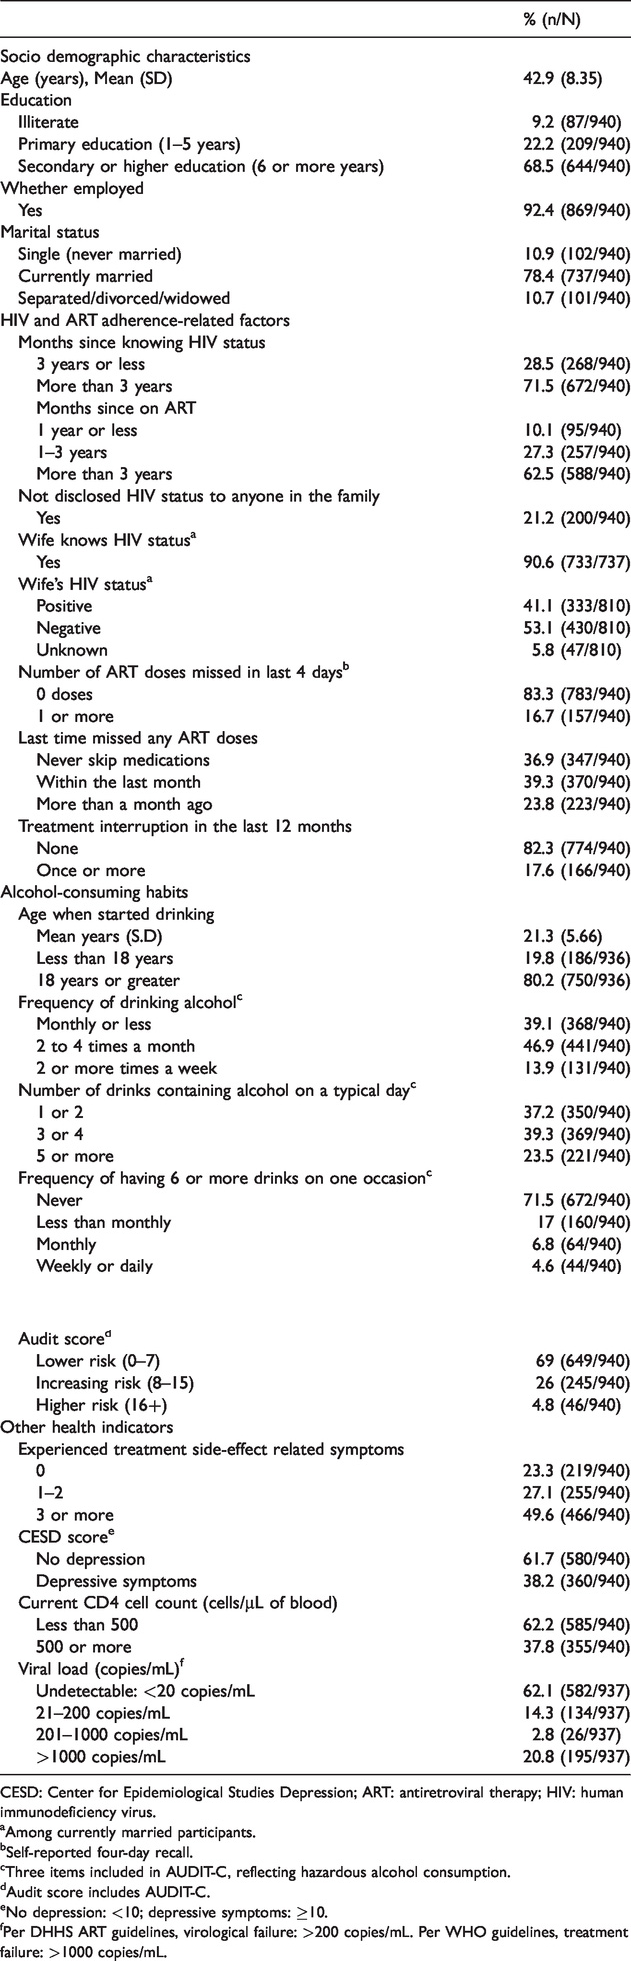
CESD: Center for Epidemiological Studies Depression; ART: antiretroviral therapy; HIV: human immunodeficiency virus.
aAmong currently married participants.
bSelf-reported four-day recall.
cThree items included in AUDIT-C, reflecting hazardous alcohol consumption.
dAudit score includes AUDIT-C.
eNo depression: <10; depressive symptoms: ≥10.
fPer DHHS ART guidelines, virological failure: >200 copies/mL. Per WHO guidelines, treatment failure: >1000 copies/mL.
Alcohol use
The mean age at which participants initiated alcohol use was 21.3 (SD: 5.66) years. And 60.8% of the participants consumed alcohol ≥2 times a month, 62.8% consumed ≥3 drinks on a typical day and 11.5% reported binge drinking at least once a month (Table 1); 30.9% of the participants exhibited a moderate or higher risk of hazardous alcohol use and dependence (AUDIT score > 8).
Viral loads
Almost all participants (937/940) agreed to undergo VL testing. VLs ranged from undetectable to 4,480,000 copies/mL; 62.1% of the participants had undetectable VL, and overall, 76.4% of the participants had VL < 200 copies/mL. And 23.5% (221/937) of the participants had VL indicative of VF (Table 1).
CD4 cell counts
A corresponding assessment of immune status shows that 62.2% (n = 585) of the participants had CD4 cell counts <500 cells/µL; of these, 14.1% had CD4 cell counts <200 cells/µL. CD4 cell counts were negatively correlated with VL but at a low effect size (Pearson’s r –0.15, p < 0.001). With worsening HIV disease, VL is the first to rise followed by a reduction in CD4 cell counts. 16 The mean CD4 cell count among participants with VL > 200 copies/mL (mean CD4: 332.8 cells/µl; SD: 183.6) was significantly lower than those with VL < 200 copies/mL (mean CD4: 508.9 cells/µl; SD: 224.9; p < 0.001) (Figure 2). There was no association between AUDIT scores and mean CD4 cell counts.
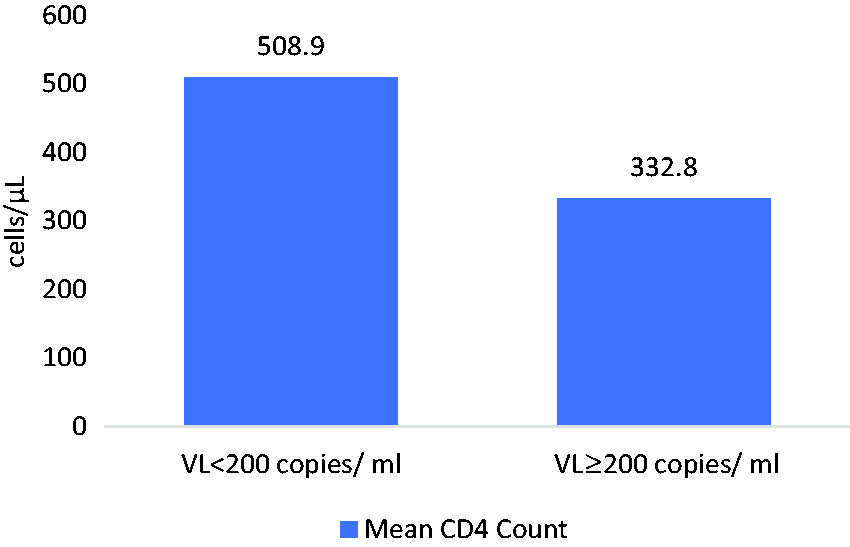
Mean CD4 cell counts by viral load among HIV-positive males on ART.
ART and adherence
Some of the participants (71.5%) had been diagnosed HIV-positive >3 years prior to being interviewed (mean 68.2 [SD: 42] months). The mean duration on ART was 54.05 months (SD: 31.72). All participants were receiving first-line ART; 49.6% of the participants reported ≥3 ART-related symptoms in the past four weeks. Although 83.3% of the participants reported no missed doses in the last four days, 39.3% of the participants reported having missed ≥1 doses within the last month and 17.6% reported at least one TI in the last 12 months. Participants who engaged in binge drinking were more likely to report TIs than those who did not (odds ratio [OR] = 2.99, 95% confidence interval [CI]: 2.11, 4.22; p < 0.001) and poor adherence (OR = 2.38, 95% CI: 1.70, 3.32; p < 0.001).
Adherence and VL
A higher proportion of participants with VL > 200 copies/mL reported missed doses in the past four days (24.4% vs. 14.3%) and TIs in the past 12 months (31.2% vs. 13.5%) or ever missing any dose (73.3% vs. 60.1%) than participants with VL < 200 copies/mL (Table 2). However, among those with VL > 200 copies/mL, 75.5% of the participants had reported no missed doses in the past four days, 26.7% had never missed any medications and 68.7% reported no TIs in the past 12 months.
Viral load levels among adherent and non-adherent participants.
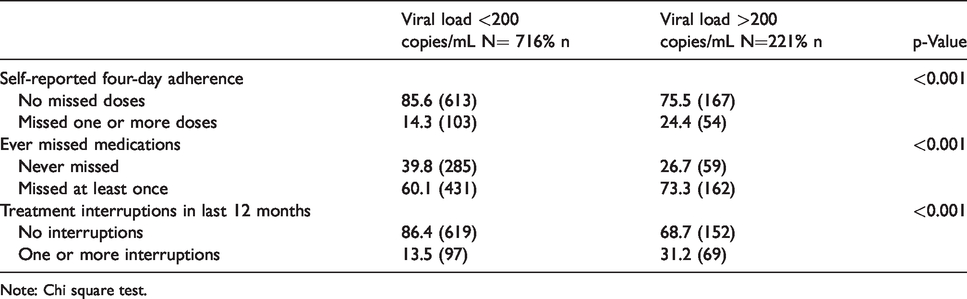
Note: Chi square test.
Correlates of VF
We observed a strong association between the adherence and VL outcomes (Table 3). Higher four-day-self-reported adherence was associated with lower odds for VF (AOR: 0.98; 95% CI: 0.98, 0.99). Participants reporting any TI were twice as likely to have VF (AOR: 2.1; 95% CI: 1.39, 3.16). Additionally, participants who had a positive assessment of their health were less likely to have VF (AOR: 0.98; 95% CI: 0.97, 0.99). Longer duration on ART predicted a lower risk of VF on bivariate analysis, but the association was not sustained in the multivariate model. Treatment-related symptoms were associated with VF: for each additional symptom reported, there was an increased risk of VF (AOR: 1.06; 95% CI: 1.0, 1.13).
Factors associated with virological failure (>200 copies/mL).

Note: Control variables age, education, months on ART. ART: antiretroviral therapy; HIV: human immunodeficiency virus; CI: confidence interval.
aContinuous data used in logistic regression.
bMean (SD).
Alcohol use, adherence and VL
AUDIT-C scores reflecting alcohol consumption were associated with a greater risk of non-adherence based on both measures of adherence: four-day-self-report <95% (AOR: 1.21; 95% CI: 1.11, 1.31) and TIs (AOR: 1.20; 95% CI: 1.11, 1.31) (Table 4, Models 1a and 1 b). However, we did not observe any association between alcohol use and VL (AOR: 0.99; 95% CI: 0.91, 1.07; Model 1c). Similar associations were observed with the full AUDIT score (Table 4, Models 2a, 2b and 2c). We did, however, observe a significant interaction effect of alcohol use (AUDIT-C) and adherence on VF (AOR: 1.23; 95% CI: 1.03, 1.47) (Table 5). A similarly significant interaction effect was observed when using AUDIT scores (AOR: 1.1; 95% CI: 1.03, 1.19).
Association adherence measures and virological failure with alcohol use.

aModels 1 uses AUDIT-C which includes only first three items of the AUDIT scale, a measure of quantity and frequency of consumption, reflecting hazardous alcohol use, regressed with (1a) self-reported adherence, (1b) treatment interruptions and (1c) viral load. Each regression was controlled for age, education and months on ART.
bModels 2 uses AUDIT which includes all ten items reflecting alcohol abuse and dependence, regressed with (2a) self-reported adherence, (2b) treatment interruptions and (2c) viral load. Each regression was controlled for age, education and months on ART.
Interaction between alcohol and adherence related to virological failure.

Note: Controlled for age, education and months on ART.
Discussion
This is one of the few studies from India to provide a VL profile for PLHIV receiving ART at public health facilities. It is also one of the few studies focussed on alcohol-consuming HIV-positive men on ART.
A majority of study participants were optimally suppressed with undetectable VL (62%), and three-quarters had VL < 200 copies/mL, suggesting stable therapy over a long treatment duration. This outcome is encouraging for the national program. Nonetheless, 23.5% had VL > 200 copies/mL and correspondingly low CD4 cell counts suggesting VF. Based on the WHO criteria, the proportion with VF (>1000 copies/mL) was marginally lower at 20.8%. Although self-reported-four-day adherence was high, 17.6% of the participants reported TI of a week or more that negatively impact HIV treatment outcomes.47,48 Poor adherence emerged as a strong, independent predictor of VF. Thus, while the majority of patients remain adherent and stable, clinic staff need to be alert to the negative effect of poor adherence and make early efforts to identify and intervene with non-adherent patients.
The study population consisted primarily of long-standing alcohol consumers who had been drinking for an average of around 20 years. Heavy drinking was not uncommon: 23.5% had five or more drinks on a typical day, while 11.5% binged at least once a month. Participants who engaged in binge drinking were more likely to have TIs and poor adherence.
We found a strong association between alcohol consumption and adherence, but no association between alcohol and VL. The lack of association between alcohol use and VL parallels research by other researchers.34,40–42 We did however, document a significant interaction effect between alcohol use and adherence, implying that alcohol negatively impacts VL outcomes but mediated through adherence. Baum et al. 39 report that the effect of alcohol on VL appears to be mediated through poor adherence among alcohol-consuming PLHIV receiving ART. Kahler et al. 38 also report a natural indirect effect of alcohol use on detectable VL mediated through poor adherence. Our results support the findings from both studies and provide some evidence for the mediatory role played by adherence.
Although we were able to demonstrate a clear association between adherence and VF statistically, on a patient level, some ambiguities remain. Among those with VL > 200 copies/mL, 26.7% of the participants reported never having missed any medications and 68.7% reported no TIs in the past 12 months. While there may be some social desirability bias in these responses, there may be additional mechanisms for HIV persistence that need examination, such as past episodes of non-adherence resulting in viral mutation and resistance, primary infection with a resistant viral strain, underlying liver pathology due to alcohol use or others.
Our study population comprises only alcohol-consuming HIV-positive males on ART which limits our ability to compare with a non-drinking HIV-positive population or those who drink but are not on ART. Our findings are, however, very relevant to the national program where alcohol use is not discussed during counseling.
In conclusion, we found that VL values add to the assessment of health status among PLHIV and are required for effective clinical monitoring of HIV treatment. In the case presented here, VL, much more than CD4 cell count, assisted us in explicating its association with alcohol use and adherence. This study also highlights the need for routine alcohol screening and counselling as an integral component of HIV care. PLHIV with elevated VLs should be counselled for alcohol use reduction and nonadherence. The parent study integrates these topics along with VL testing into three different counseling interventions to promote adherence and reduce alcohol use among PLHIV on ART.
Footnotes
Ethics approval and consent to participate
Government of India approval was provided by the Indian Council for Medical Research and National AIDS Control Organization. Ethical approval was obtained from the Institutional Review Boards of the University of Connecticut, School of Medicine, and the Institute of Community Research in Connecticut, the Population Council in New York, the International Center for Research in Women in Washington, DC, and from the Ethics Committees of three teaching hospitals in which ART centers were located: King Edward Memorial Hospital, Lokmanya Tilak Municipal Hospital and B.Y.L. Nair Ch. Hospital. All participants provided written informed consent.
Authors’ contribution
Avina Sarna conceptualized and wrote the paper and directed the analysis; Roopal J Singh and Toan Ha conducted the data analysis; Bidhubhushan Mahapatra and Stephen Schensul guided the data analysis and reviewed the article. Sushma S Gaikwad, Kavita Joshi, Rupal Malye and Jean J Schensul reviewed and edited the article.
Acknowledgments
We are grateful to our partners at B.Y.L. Nair Ch. Hospital, KEM Hospital, LTMG (Sion) Hospital, Vashi Municipal General Hospital and Ulhasnagar Central Hospital. We are thankful to our investigators: Deepak Sonawane, Triloki Nath, Sachin Sakpal, Purna Kumal, Santosh Surve, Dnyaneshwar Khandekar, Santosh Salunke, Gopal Gujar, Jagdeep Bansod, Vijay Pawar; and our facilitators: Ramchandra Salunke, Ashok Dhokle, Vaijnath Mane and Ashok Gheware. This study could not have been implemented without the support of Maharashtra States AIDS Control Society. Lastly, we would like to thank the study participants who willingly gave us their time and attention. These data have not been presented at any national or international meeting or conference.
Declaration of conflicting interests
The authors declared no potential conflicts of interest with respect to the research, authorship, and/or publication of this article.
Funding
The authors disclosed receipt of the following financial support for the research, authorship and/or publication of this article: This work was supported by the NIH/NIAAA, grant: U01-AA021990.