
Abstract
Perceptions of time and space are subject to strong contextual effects. Like their physical counterparts, they appear to be bound together. The perceived spatial extent of a constant retinal extent increases with its perceived distance from the observer. The perceived duration of a moving object increases with its covered angular trajectory. It follows that the perceived duration of moving objects covering identical angular trajectories should also increase with distance. Using three-dimensionally rendered balls rolling for 600 ms, 900 ms, and 1,200 ms and covering 5.5°, 11°, and 22° trajectories in fronto-parallel planes of a linear-perspective scene, we showed that perceived duration dilates by up to 50% as the fronto-parallel plane of the rolling ball recedes from the observer. Such time dilation is mostly contributed to by the smaller size of the distant ball. As in a three-dimensional world, objects’ sizes and their covered trajectories per time unit decrease with distance, and as the two factors lead to opposite perceived-duration effects, the results suggest a form of time constancy in a three-dimensional world.
Keywords
Many psychological studies have shown that perceived duration depends on a multitude of factors related both to the stimulus (e.g., size, spatial and temporal frequency, speed, pattern complexity, filled vs. empty intervals, saccades) and to observers’ internal states (e.g., attention, expectation, adaptation, motor activity, intentionality, task difficulty, emotion, drugs; see reviews by Buhusi & Meck, 2009; Burr, Ross, Binda, & Morrone, 2010; Eagleman, 2008; Fraisse, 1963, 1984; Gorea, 2011; James, 1890/2007; van Wassenhove, 2009). Among the former, the most dramatic and consistent dependence appears to be on stimulus speed, hence on covered space (e.g., Brown, 1931; Kaneko & Murakami, 2009).
In as much as space and time are inseparable dimensions—as noted at least since Aristotle (350 B.C./1941) and formulated scientifically by Einstein (1905)—it is not surprising that perceived space (or size) also shows contraction and dilation effects equivalent to those observed for perceived time. Perhaps the most striking example is Emmert’s law (Emmert, 1881; Epstein, Park, & Casey, 1961): The perceived size of an object increases with its perceived distance from the observer. This size constancy phenomenon (e.g., Holway & Boring, 1941; McKee & Welch, 1992; Thouless, 1931) is usually invoked to account for the moon illusion (Hershenson, 1989). A number of studies have demonstrated an inverse relationship between the size of static three-dimensional models (cardboard lounges) and the estimated time it would take to explore them (i.e., the larger the models, the less time it would take to explore them; e.g., Bobko, Bobko, & Davis, 1986; DeLong, 1981; Mitchell & Davis, 1987; Zäch & Brugger, 2008). Studies using temporally displayed two-dimensional objects in the absence of a three-dimensional environment found a positive correlation between the size and the perceived duration of these objects (e.g., Mo & Michalski, 1972; Ono & Kawahara, 2007; Thomas & Cantor, 1975, 1976; Xuan, Zhang, He, & Chen, 2007).
In 1911, Ponzo described an illusion in which the perceived size of an object with a constant retinal size increased as it was displaced toward the vanishing point of a two-dimensional, linear-perspective representation of a three-dimensional scene. The illusion is typically interpreted in terms of size constancy and relates to Emmert’s law (Boring, 1942). In 1935, Abe (also Cohen, Hansel, & Sylvester, 1953) observed that the perceived temporal interval between two stimulations at two spatial locations increases with the distance between these locations. Cohen et al. (1953) named this phenomenon the Kappa effect, which is a mirror image of Helson’s (1930) tau effect, in which shorter temporal intervals between two stimuli result in shorter perceived spatial intervals.
Logic suggests that, when taken together, the Ponzo and Kappa effects should result in an overestimation of the perceived duration of objects moving in the farther plane of a two-dimensional perspective scene relative to the perceived duration of the same objects moving in a closer plane (see also Suto, 1941). Objects that are farther away and the distances between them will appear to be larger and longer, respectively, than objects and distances of equal retinal size that are closer to the observer (the Ponzo effect). Likewise, perceived duration increases with perceived distance (the Kappa effect), and therefore, the perceived duration of faraway moving objects should appear dilated in comparison with that of closer objects covering the same retinal trajectory. We refer to this new space-time perceptual distortion as the time-dilation-with-distance effect. In the real world, objects that are farther away but moving at a constant physical speed yield slower retinal speeds (cover shorter trajectories) than moving objects that are nearer; thus, according to the Kappa effect, their perceived duration should contract. Hence, in a real three-dimensional environment, the two perceived-duration effects should cancel out, at least partially yielding a form of time constancy.
Method
We conducted seven experiments to test these effects. In each experiment, a pair of balls (one above fixation and one below fixation) rolled successively along horizontal paths in a fronto-parallel plane. In all but one experiment, observers were asked to judge which ball rolled for the longest duration; in the remaining experiment, observers were asked which ball covered the largest distance. In Experiments 2 through 5, we appraised the contribution to the main effect of the Kappa effect with moving (rather than flashed) stimuli (Experiment 2), the size of the moving objects (Experiment 4), the perceived trajectory length in the linear-perspective scene (a dynamic version of the Ponzo effect; Experiment 3), and the background-foreshortening effect (Experiment 5).
All these experiments were run with a two-alternative forced-choice plus adaptive-staircase method. In Experiments 6 and 7, we replicated Experiments 1 and 2, respectively, except that we used the method of constant stimuli (see Table 1 for a comparison of materials and method for all experiments).
Stimuli, Background, and Method of the Seven Experiments
Note: CIE = Commission Internationale de l’Éclairage; 2AFC = two-alternative forced choice.
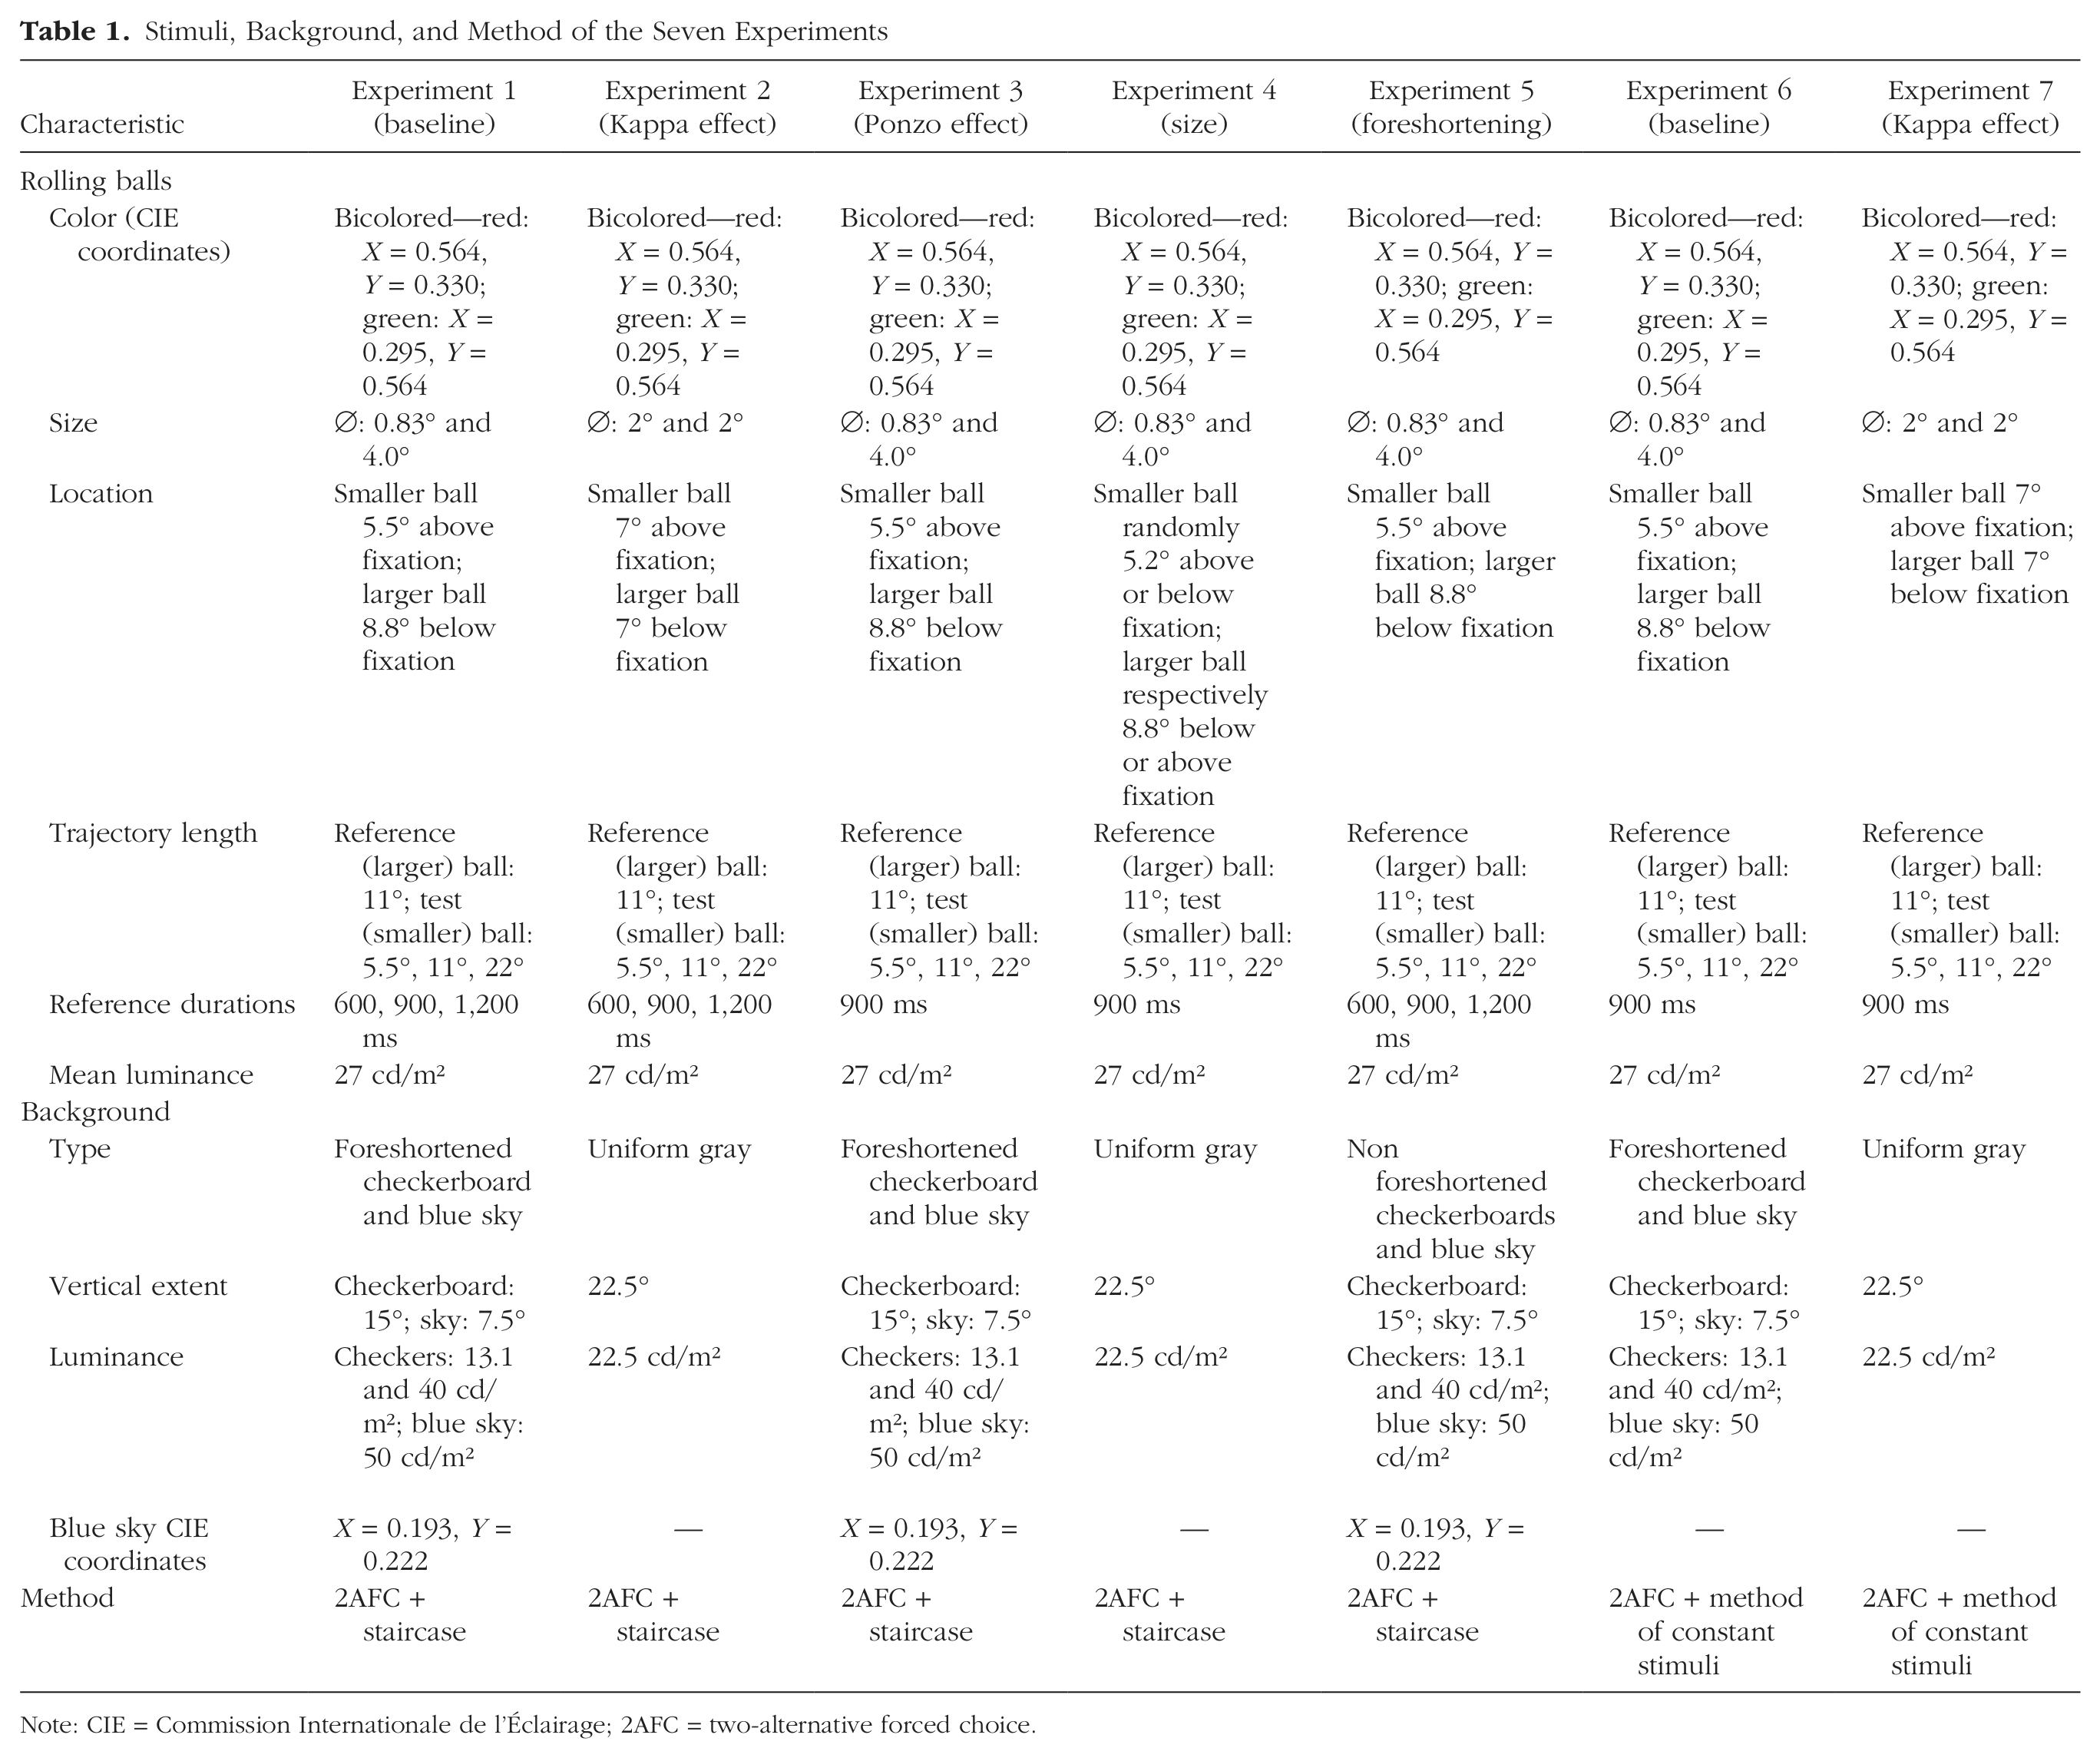
Figure 1 illustrates the spatial displays used to assess the dynamic variant of the Ponzo illusion (bearing on the perceived length of the trajectories covered by the rolling balls of different size) and the time-dilation-with-distance effect (Fig. 1a), and the contribution of therein comprised factors, namely the trajectory length (Kappa effect with equal size rolling balls; Fig. 1b), the relative size of the rolling balls (Fig. 1c), and the rendering of the scene’s background with and without foreshortening (also tested with different size rolling balls; Fig. 1d). All configurations were rendered with daylight (parallel) illumination using the graphics software OpenGL Version 3.1 (Silicon Graphics, 2009).
Illustration (at scale) of the four spatial setups used in the seven experiments. In each experiment, observers saw two balls, one above and one below fixation. These balls rolled successively along horizontal paths randomly either to the left or to the right. In Experiments 1, 3, and 6 (a), each ball was differently sized, and both balls moved on a three-dimensional checkerboard surface with a blue sky above. In Experiments 2 and 7 (b), the two balls were of equal sizes, and both moved on a uniform gray background. In Experiment 4 (c), the balls were of different sizes, with the placement of the smaller and larger ball above or below fixation varied across trials. Balls in this experiment moved on a uniform gray background. Experiment 5 (d) was similar to Experiment 1, except that the checkerboard surface was two-dimensional.
Stimuli
The stimuli were presented using a Dell Precision T3500 computer and a 19-in. E96f+SB ViewSonic monitor (1024 × 768 pixels, 100 Hz) set at about 60 cm from observers’ eyes (30° × 22.5°). The presentation of stimuli and response recording were controlled in MATLAB (The MathWorks, Natick, MA) using the Psychophysics Toolbox (Brainard, 1997; Pelli, 1997). Precision in the timing of stimuli was ensured by linking the duration of stimulus presentation to a counter of screen refreshes. Two red-green balls (Commission Internationale de l’Éclairage, or CIE, coordinates—red: X = 0.564, Y = 0.330; green: X = 0.295, Y = 0.564; luminance: 27 cd/m2) that rolled successively along horizontal paths in randomized directions were rendered three-dimensionally using OpenGL. The rotation speed of the balls was commensurate with their retinal linear displacement. One ball was presented above and one ball was presented below a white fixation cross (0.87° × 0.87°; 0.13°-thick lines of 108 cd/m2). The balls’ sizes in Experiments 1, 3, 4, 5, and 6 were identical in their virtual dimensions, so that when projected on the regular two-dimensional-perspective scene (in Experiments 1 and 3), their angular size scaled with distance. Diameters were 4° and 0.83° for the nearest and more distant ball, respectively. The balls were highlighted from a single spotlight source that cast a shadow on the checkerboard floor. The smaller ball was either systematically presented above fixation (Experiments 1, 3, 5, and 6) or randomly above and below fixation (Experiment 4). In Experiments 2 and 7, the two balls had equal sizes (2° in diameter).
In Experiments 1, 3, and 6 (Figs. 1a and 1d), the balls rolled on a linear two-dimensional perspective-rendered checkerboard floor composed of two shades of gray (13.1°, 40 cd/m2). In Experiment 5, balls rolled on two frontally displayed checkerboards (no perspective) of the same two gray shades (Fig. 1d), and in Experiments 2, 4, and 7, the balls rolled on a uniform gray background (22.5 cd/m2).
In the perspective rendering, the bases of the largest and smallest checkers along the fixation meridian were respectively 10.5° and 2.3° wide. For the frontally presented checkerboards, the small and large checkers were 2.3° × 2.3° and 10.5° × 10.5°. Both the perspective-rendered and the frontally presented checkerboards extended vertically to two thirds of the screen up to the “horizon,” beyond which the screen was a uniformly bright (50 cd/m2) blue (CIE coordinates: X = 0.193, Y = 0.222). The locations of the balls were hence 15° and 1° below the horizon for the near and far balls, respectively. In all experiments using differently sized balls, the location of the fixation cross was chosen (based on preliminary trials) to approximately equalize their salience (closer by a factor of 1.68 to the smaller ball). This translates into a vertical distance from fixation of 5.2° and 8.8° for the small and large ball, respectively).
Observers
Six observers (including the 2 authors) participated in all experiments. Five of the observers were graduate psychology students (age = 24–27 years; 5 female, 1 male) of which 4 were naive to the purpose of the experiments. All had normal or corrected-to-normal vision. Data from a seventh naive observer who consistently confounded duration with speed judgments (and for whom, as a consequence, the adaptive staircases did not converge) were discarded before this observer completed the whole experimental sequence.
Procedure
Observers completed each of the experiments in separate blocks of trials. In each experiment, they were asked to judge which of the sequentially presented (in random order) top and bottom rolling balls covered either a longer distance (Experiment 3) or a longer time interval (all remaining experiments, with the exception of a replication of Experiment 3 using static lines). The five staircase experiments (Experiments 1–5) were run according to a Latin-square design to control for order effects across observers. Once these experiments were completed, all observers were run with a limited set of experimental conditions using the method of constant stimuli. The full set of experiments was completed in three sessions, each lasting about an hour and a half with short (5 min) breaks at the convenience of the observers and with longer breaks (20–30 min each) every half an hour.
Each ball appeared at a randomly jittered horizontal location (±1°) on a randomly selected side of the fixation cross (with the average midtrajectory centered on the screen). Then, each ball rolled horizontally toward the other side and disappeared after a given time interval. In all experiments, the bottom rolling ball covered a fixed fronto-parallel trajectory of 11°. In Experiments 3, 4, 6, and 7, the top and bottom balls always covered this trajectory length within 900 ms. In Experiments 1 and 2, the two balls were randomly presented for time intervals of 600, 900, and 1,200 ms, with the top (smaller) ball randomly covering trajectories of 5.5°, 11°, or 22°. In Experiment 5, the top ball covered the same three trajectories but, together with the bottom ball, was always displayed for only 900 + ϵ ms (where ϵ is the difference needed to perceptually equalize the probe and standard durations).
With two exceptions (Experiments 6 and 7), observers’ perceived trajectory length (in the fronto-parallel plane of the screen) or duration was assessed with a staircase procedure monitoring the duration (or trajectory length) of the probe ball that was displayed randomly across trials in the first or second temporal interval at the bottom or top of the screen. There were two interleaved staircases for each condition (i.e., for each standard duration and trajectory length), one for the top probe and the other for the bottom probe. The staircases monitored the duration or the trajectory length of the probe following a one-up/one-down rule contingent on the observer’s judgment (“longer” or “shorter”). Incremental and decremental steps were 4 dB for the first four response reversals and 2 dB steps for the last eight reversals, with the point of subjective equality (PSE) computed as the mean of the last six reversals. There were 18 interleaved staircases in Experiments 1 and 2 (3 durations × 3 trajectory lengths × 2 standard ball locations), 2 in Experiment 3 (1 duration × 1 trajectory length × 2 standard ball locations), 8 in Experiment 4 (1 duration × 1 trajectory length × 2 standard ball locations × 2 locations of the small ball), and 6 in Experiment 5 (1 duration × 3 trajectory lengths × 2 standard ball locations). Each condition was repeated once so that each PSE was computed as the mean of four staircases. Each experiment was run in separate blocks repeated twice and randomized over observers. Each block lasted 30 to 45 min (Experiments 1 and 2), 10 to 15 min (Experiment 3), or 20 min (Experiments 4 and 5), including short breaks.
The method of constant stimuli used in Experiments 6 and 7 consisted in randomly displaying one of four probe durations equally spaced on a log scale (1.84 dB), two shorter and two longer than observers’ PSEs (as assessed in the corresponding staircase experiments for the 900-ms standard duration). Participants were asked to make the same perceived-duration judgments as in the staircase experiments. Each probe duration was presented 50 times so that one full experiment consisted of 600 trials (50 trials × 4 probes × 3 trajectory lengths) and lasted about 50 min (including breaks). Percentages of “shorter” responses were fit with a cumulative Gaussian function. All other conditions were identical to those in the corresponding staircase experiments.
Results
All data are expressed as ratios between the perceived trajectory duration (or length) of the top versus the bottom ball, so that ratios larger than 1 indicate an overestimation of the trajectory (or duration) of the top ball. The plots in Figure 2 show these ratios geometrically averaged over repeats and observers.
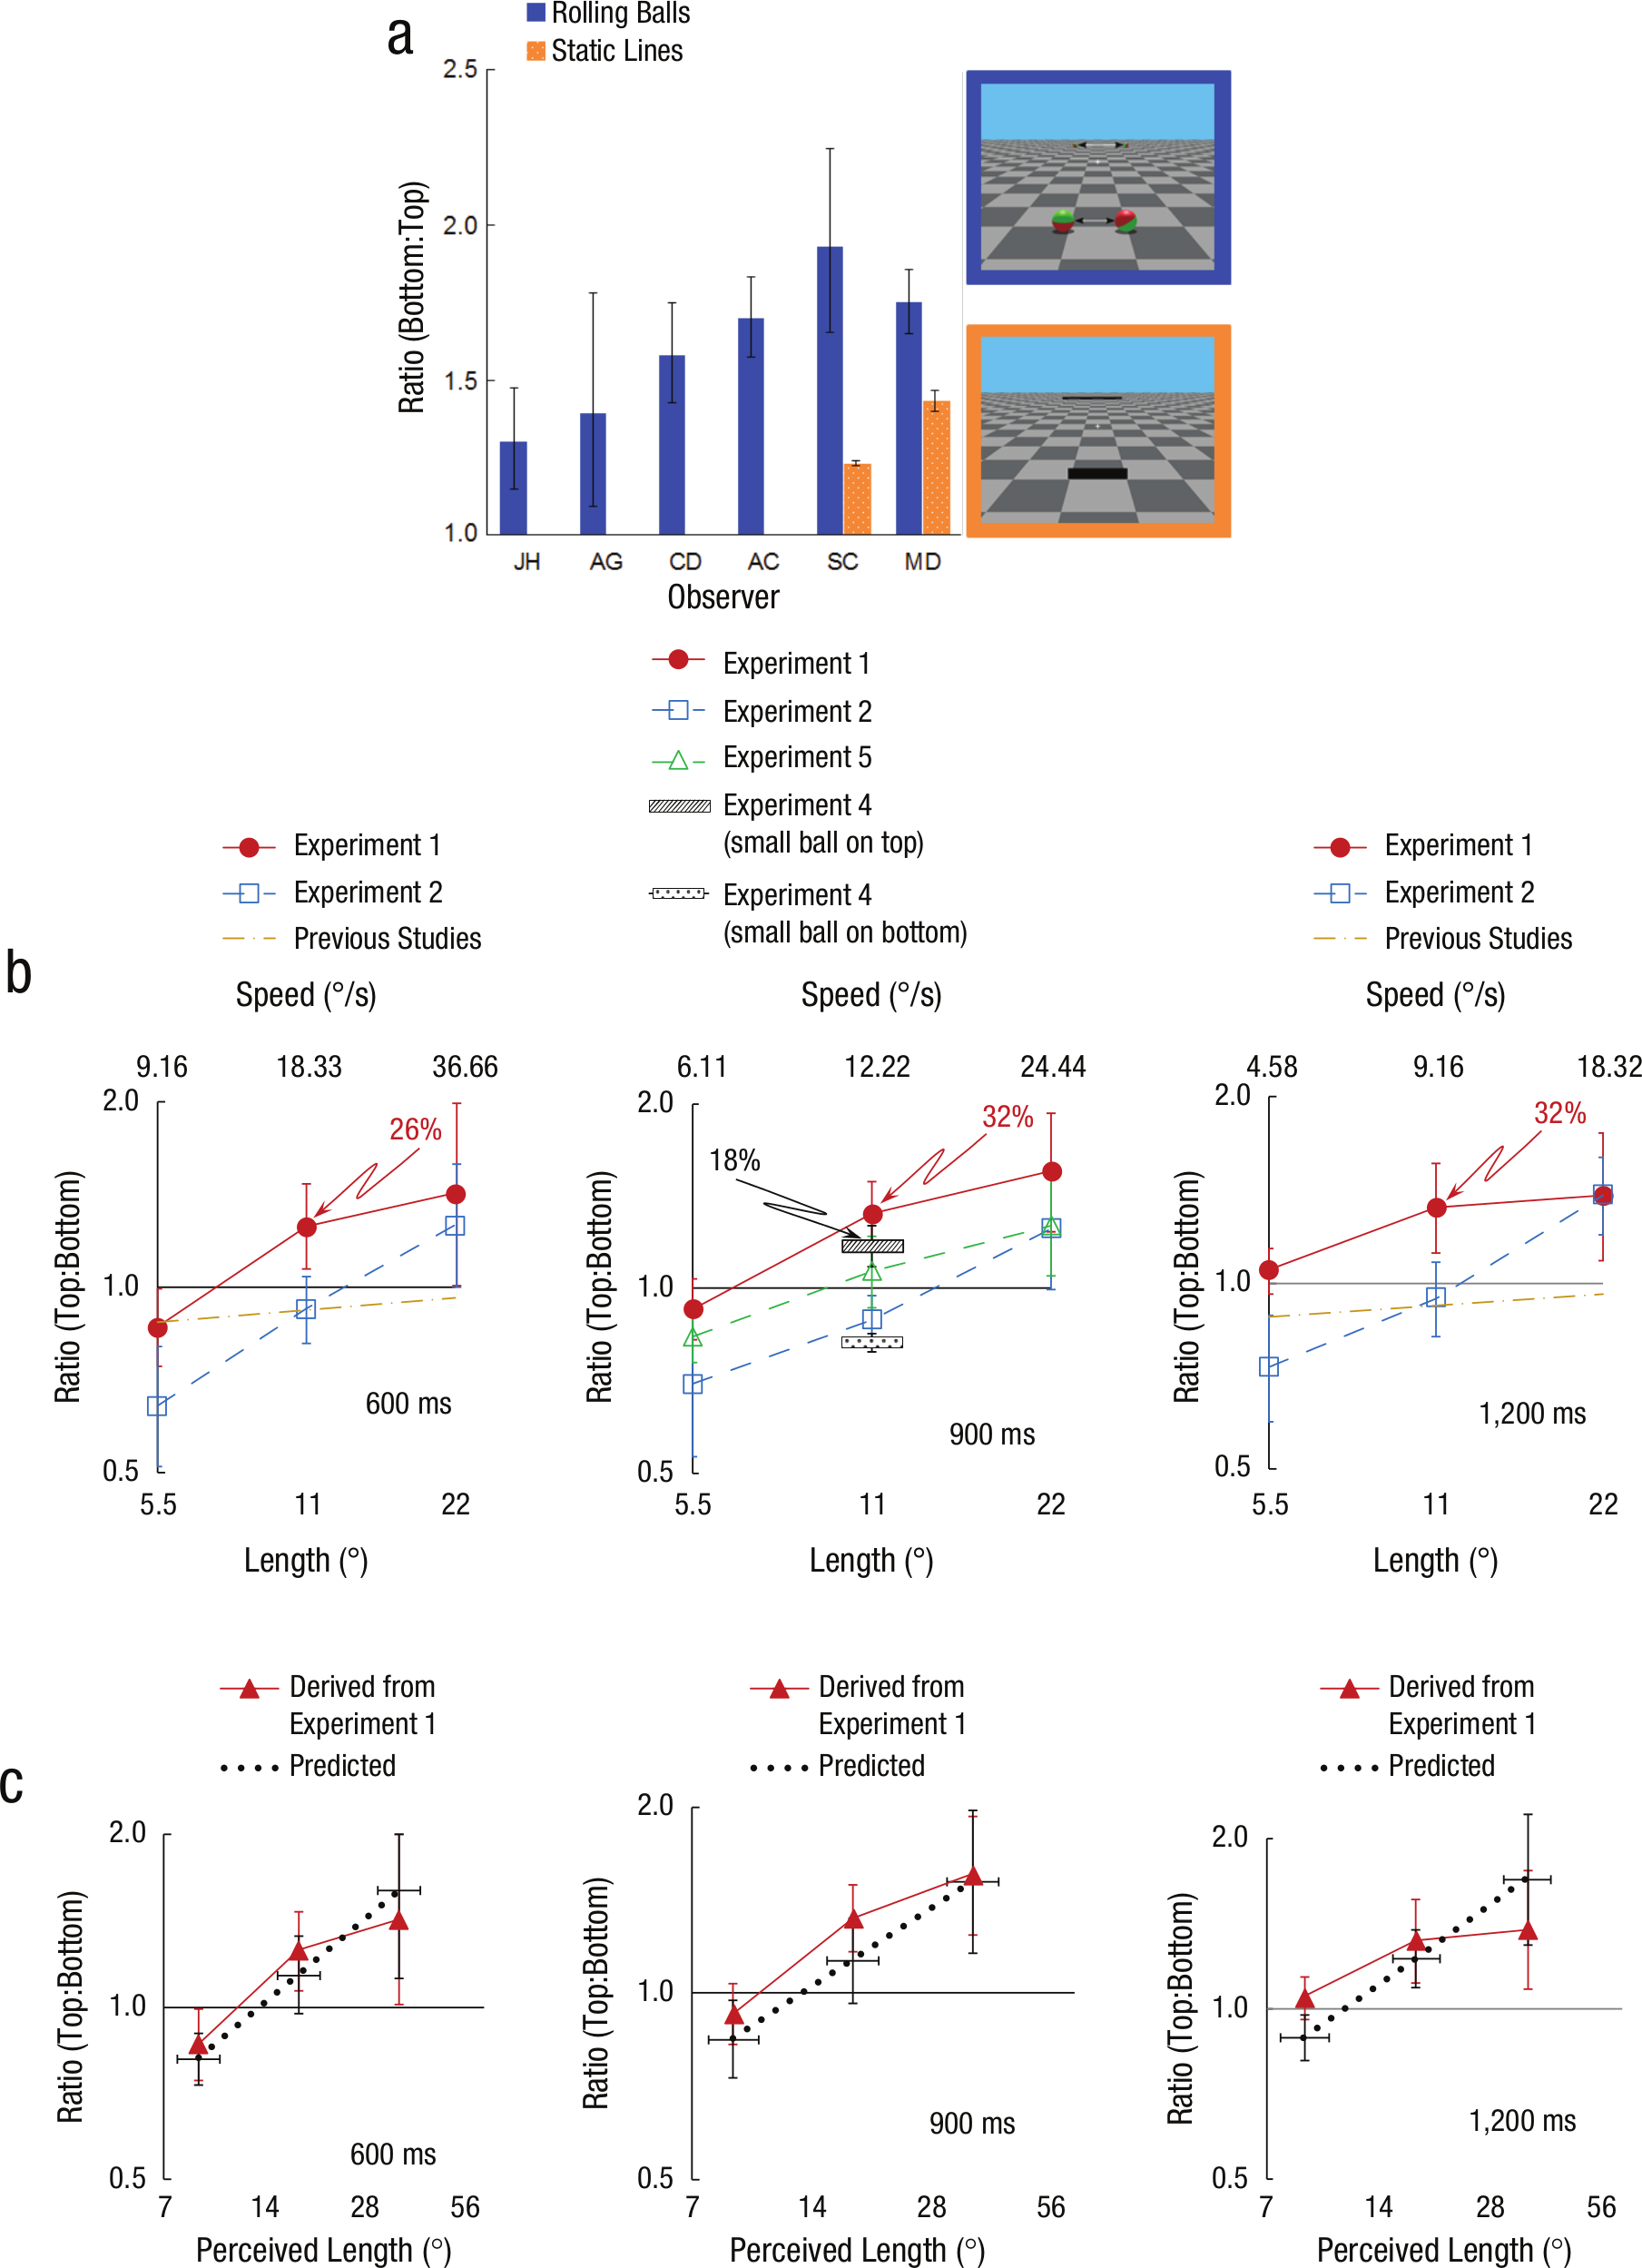
Mean perceived trajectory length (a) and perceived duration (b, c) in Experiments 1 through 5. Results are expressed as ratios between the perceived trajectory duration or length of the top versus the bottom ball. Ratios larger than 1 indicate that the top stimulus was perceived to have covered a longer trajectory or to have lasted longer than the bottom stimulus. The graph in (a) shows perceived trajectory length in Experiment 3 (rolling balls: upper inset) and a follow-up experiment (static lines of different thicknesses: lower inset) as a function of observer and stimulus type. Perceived duration in Experiments 1, 2, 4, and 5 (b) is shown as a function of trajectory length, separately for stimuli presented for 600, 900, and 1,200 ms. The left graph in (b) also shows perceived duration as a function of speed in previous studies (Kanai, Paffen, Hogendoorn, & Verstraten, 2006; Kaneko & Murakami, 2009). The graphs in (c) show perceived duration as derived from the data in Experiment 1 (see note 4) as a function of perceived trajectory length as assessed in Experiment 3 together with predicted perceived durations inferred from the results of Experiment 2. All values in (b) and (c) are plotted on logarithmic axes. Error bars show ±1 SE.
Figure 2a shows mean perceived trajectory-length ratios obtained in Experiment 3. As these ratios (range: 1.30–1.92; geometric mean: 1.59) were much larger (~1.1–1.3 times) than usually reported in the literature with static lines (Jordan & Randall, 1987; Leibowitz, Brislin, Perlmutrer, & Hennessy, 1969; Leibowitz & Judisch, 1967; Roncato, Parlangeli, & Farfaneti, 1998), we reassessed the Ponzo illusion with such static lines, but we used thicknesses proportional to their distance for the two observers (S. C., M. D.) who showed the largest Ponzo effects on the perceived trajectory of the rolling balls. Under such static conditions, the Ponzo effect was much smaller (ratios of 1.23 and 1.43), which indicates that motion, the three-dimensional rendering of the differently sized balls, or both variables were major contributing factors. 1 McGraw, Roach, Badcock, and Whitaker (2012) have shown that the perceived distance between two Gaussian blobs (or Gabor patches) of equal luminance decreases linearly with the standard deviation of their envelopes.
Fig. 2b shows the perceived duration of each standard duration assessed in the four duration experiments (1, 2, 4, and 5) as a function of the trajectory length of the top ball. These results confirm that our prediction of a time-dilation-with-distance effect was fulfilled: For equal covered trajectories and for each of the three standard durations, the perceived duration of the top (smaller) ball was dilated by an average of 30% (with up to 50% in 1 observer). If this dilation is considered relative to the equivalent conditions in Experiment 2, then the mean time dilation with distance rises to an average of 43%. The second main result is the perceived-duration dependence on the trajectory length observed in all three experiments in which the trajectory length was varied (1, 2, and 5). For any fixed physical duration, trajectory length correlates with the object’s physical speed, which, in turn, is known to correlate with perceived duration (Brown, 1931; Kanai, Paffen, Hogendoorn, & Verstraten, 2006; Kaneko & Murakami, 2009). We therefore derived the perceived speeds associated with the presently assessed perceived trajectory expansion with distance (Experiment 3) and inferred the corresponding speed effect on perceived duration from Kanai et al.’s (2006) and Kaneko and Murakami’s (2009) studies. Clearly, the present trajectory effect as it translates into a speed effect is much stronger than in the previous studies. Here again, the three-dimensional rendering and the relative sizes of the rolling balls—the primary differences between our study and the two cited ones—must account for the enhanced Kappa/speed effect.
The third main observation is that the time-dilation-with-distance effect is mostly due to the size difference between the top and bottom balls: In the absence of any other perspective cue, it accounts for more than half of this effect (size effect/time-dilation-with-distance effect: 18%/32% or 32%/48%, depending on whether time dilation is computed relative to the physical—i.e., an unbiased observer—or to the Kappa-distorted duration, respectively). 2 (The symmetrical perceived-duration distortions observed with the smaller ball on top and on bottom validate the equal salience of the balls when projected on the upper and lower hemifields.) Finally, the observation that perceived durations measured in the non–perspective-rendered scene were significantly shorter than in Experiment 1 despite the use of the same rolling balls, and not significantly different from the perceived durations assessed in the comparable condition in Experiment 4 (i.e., small ball on top) implies that the flat checkerboards counteracted the perspective effect induced by the differently sized three-dimensionally rendered balls and that, contrary to suggestions in the literature (Fraisse, 1963; Poynter, 1989), the number of visible changes (here, the number of checkers crossed by the balls) is not a critical modulator of perceived duration (see also Binetti, Lecce, & Fabrizio, 2012; Kaneko & Murakami, 2009). It is worth noting that out of the 6 observers who completed the full set of experiments, 1 (C. D.) showed none of these perceived-duration effects despite his large dynamic Ponzo illusion (57%). This observer’s perceived duration showed no dependency on either trajectory length (or, equivalently, speed), size, or foreshortening cues.
All observations were confirmed in a statistical analysis using the log of the observed ratios. A three-way analysis of variance (ANOVA; 3 durations × 3 trajectory lengths × 2 experiments, i.e., Experiments 1 and 2 only 3 ) yielded the expected duration effect, F(2, 33) = 121.96, p < .0001, and confirmed both the observed trajectory effect, F(2, 33) = 58.18, p < .0001, and the longer perceived durations in Experiment 1 than in Experiment 2, F(1, 52) = 40.51, p < .0001. The interaction between trajectory length and experiment was also significant, F(2, 48) = 3.35, p = .04, with steeper slopes for Experiment 2 than for Experiment 1. The observed size effect was also confirmed by a one-way ANOVA—small versus big ball on top, F(1, 4) = 51.15, p < .0001. To assess the perceived-duration effects across Experiments 1, 4, and 5 (all run with the small-big ball pair, unlike Experiment 2), a one-way (three experiments) ANOVA with multiple comparisons was run with the perceived-duration ratios obtained for the 11° trajectory and the 900-ms standard duration. It showed a significant main effect, F(2, 3) = 4.32; p = .03). Post hoc Tukey comparisons revealed a significant difference only between Experiments 1 and 5 (p < .03), which suggests that perspective cues other than size do increase perceived-duration distortions.
Figure 2c replots the perceived-duration ratios from Experiment 1 together with the predicted ratios based on each observer’s Ponzo and Kappa effects. 4 This time the abscissa displays the perceived trajectory lengths assessed in Experiment 3 (Fig. 2a). As hypothesized, the combination of the spatial (Ponzo effect) and temporal (Kappa effect) perceptual distortions provide a reasonable fit of the time-dilation-with-distance effect obtained in Experiment 1. Predictions yielded a quasilinear increase of these ratios (in log-log coordinates) with the perceived trajectory length because the same illusory trajectory-length enhancement (Ponzo effect) was applied to all trajectory lengths. It is fair to assume that the systematic flattening of the actually measured perceived duration as a function of trajectory length was due to the fact that the Ponzo illusion decreases with physical extent, presumably flattening out beyond some critical value. It should be pointed out that the Ponzo effect, as tested, included the ball-size effect so that the time dilation with distance appears to result from and be fully accounted for by the sum of the Ponzo, size, and Kappa effects.
The percentage of “shorter” responses obtained using the method of constant stimuli (Experiments 6 and 7) were fit with cumulative Gaussian functions and yielded PSEs very similar to the ones obtained in the equivalent staircase experiments (1 and 2). The average slopes of the fit Gaussian functions (i.e., their standard deviations that inform the accuracy of observers’ duration judgments) were 600 ms, 720 ms, and 990 ms in Experiment 6, and 450 ms, 630 ms, and 720 ms in Experiment 7 for trajectory lengths of 5.5°, 11°, and 22°, respectively. Despite the observed increase in slope (i.e., decrease in accuracy) with trajectory length, and the overall larger slopes in Experiment 6 (710 ms) than in Experiment 7 (600 ms), none of these trends reached statistical significance (two-way ANOVA).
Discussion and Conclusion
The present main finding is the perceived-duration increase with the distance from the observer of visual objects moving in the fronto-parallel plane of a linear-perspective two-dimensional scene. The average time dilation was 30% and reached 50% in 1 observer. One of the 6 observers showed no perceived-duration distortion with any of the present manipulations. Such strongly idiosyncratic perceived time distortions are not unlike many other spatial and spatio-temporal illusions (e.g., Coren & Porac, 1987; Haans, Kaiser, Bouwhuis, & IJsselsteijn, 2012; Happé, 1996; Schwarzkopf, Chen Song, & Rees, 2011; Stevenson, Zemtsov, & Wallace, 2012). Depending on the illusion type, inter- and within-individual differences appear to relate to cultural factors, cognitive abilities (including spatial, temporal, field independence, and working memory capacities), neurobiological characteristics, and clinical conditions (such as autism). The strongly deviant observer was not available for further scrutiny.
The perspective-related time dilation appears to be a direct consequence of three previously reported space- and speed-related time-distortion effects, namely the Ponzo illusion, the perceived-distance dependence on size, and the Kappa effect. As such, the present effect could have been predicted from the literature a long time ago. The present study is the first to reunite these well-known effects into a unique ecological perspective: their joint contribution to the perception of time in a three-dimensional environment. It also revealed that, when tested separately, these three effects were much larger than previously reported (Ponzo with static lines: Jordan & Randall, 1987; Leibowitz et al., 1969; Leibowitz & Judisch, 1967; Roncato et al., 1998; distance and size: McGraw et al., 2012; Kappa: Abe, 1935; Casasanto & Boroditsky, 2008; Cohen et al., 1953; Cohen, Hansel, & Sylvester, 1955; Masuda, Kimura, Dan, & Wada, 2011). The main difference between the present and previous studies is that the objects whose duration was to be judged were three-dimensionally rendered and moving. The Ponzo illusion presently replicated with static lines of thicknesses proportional to their distance from the observer was also significantly larger than its standard version (with equal thickness lines) though smaller than its dynamic version tested with rolling balls. It must then be the case that perspective rendering and motion factors play a crucial role in time perception. Experiment 5 demonstrated that the checkered background’s foreshortening per se contributes only mildly, if at all, to the perceived time dilation, as the perceived durations assessed with a foreshortened (in Experiment 1) and not foreshortened background were not significantly different. This was also the case when the time-dilation effect in Experiment 1 was compared with the size effect (~60% of the overall dilation observed in Experiment 1). These observations suggest that size reduction with distance, an intrinsic cue in perspective rendering, largely supersedes the effects of other perspective cues on time dilation.
It has been understood since Aristotle (350 B.C./1941) that time has meaning only with respect to motion, hence to space. Leibniz (1715–1716/1969) pointed out that time and space cannot be absolute dimensions. Einstein (1905) translated Leibniz’s philosophy into principled mathematics, and ever since, experiments have proven him right. At a metaphorical level, the present finding echoes Einstein’s (and Leibniz’s) space-time relativity: Farther-away galaxies are moving faster than closer ones, hence their associated time as measured at the observation point also unfolds faster. Here, we showed that humans (with one exception out of six cases) also experience such an effect as they perceive the duration of farther-away moving objects to be longer than that of closer moving objects. Whereas “psychological relativity” (Helson & King, 1931) was signaled in the experimental literature at least since the first half of the last century (see Fraisse, 1963) and more recently revived in relation to eye movements (Morrone, Ross, & Burr, 2005), the present study is the first to show how it is modulated by spatial (and speed) cues in a two-dimensional, perspective-rendered environment.
Our main finding was that, for trajectories of equal retinal size (hence equal retinal speeds), objects that are farther away appear to last longer than objects that are closer. This perceived time dilation is mostly due to these objects’ decreasing size with their distance from the observer and to their perceptually enhanced trajectory length, hence increased perceived speed. Because perceived time dilates with decreasing size but contracts with the shortening of the covered trajectory (or, equivalently, with decreasing speed), the two effects should cancel out at least partially, so that, in a real three-dimensional environment, the perceived duration of dynamic events should be more or less independent of their location in depth. Testing whether such time constancy is indeed achieved requires further parametric experiments.
Footnotes
Declaration of Conflicting Interests
The authors declared that they had no conflicts of interest with respect to their authorship or the publication of this article.
Funding
This work was supported by an ANR-BLANC Grant PeDu 2012 to A. Gorea.