



Abstract
In this study, we sought to elucidate both stable and changing factors in the longitudinal structure of neuroticism using a behavioral genetic twin design. We tested whether this structure is best accounted for by a trait-state, a trait-only, or a state-only model. In line with classic views on personality, our results revealed substantial trait and state components. The contributions of genetic and environmental influences on the trait component were nearly equal, whereas environmental influences on the state component were much stronger than genetic influences. Although the overall findings were similar for older and younger twins, genetic influences on the trait component were stronger than environmental influences in younger twins, whereas the opposite was found for older twins. The current findings help to elucidate how the complex interplay between genetic and environmental factors contributes to both stability and change in neuroticism.
Keywords
In the current study, we investigated the longitudinal structure of neuroticism using a behavioral genetic twin design. Such a design can be used to examine how genetic and environmental sources of variance influence stability and change over time. Neuroticism is an important broad high-order trait in the Big Five model of personality (H. J. Eysenck & Eysenck, 1975; McCrae & Costa, 1997) and has been shown to be the strongest correlate of psychopathology (Kotov, Gamez, Schmidt, & Watson, 2010; Lahey, 2009; Ormel, Riese, & Rosmalen, 2012). Not surprisingly, neuroticism accounts for a substantial proportion of current and lifetime comorbidity (Clark, 2005; Khan, Jacobson, Gardner, Prescott, & Kendler, 2005; Kotov et al., 2010). A substantial overlap has been found between genetic influences on neuroticism and common mental disorders (Hettema, Neale, Myers, Prescott, & Kendler, 2006). Thus, quantification of the genetic and environmental influences on both stability and change in neuroticism may contribute to an understanding of the association between neuroticism and mental disorders, as well as the etiology of the latter.
Stability and change in both the mean level of and individual differences (differential stability) in neuroticism have been extensively studied (Bleidorn, Kandler, Riemann, Angleitner, & Spinath, 2009; Conley, 1984; Hopwood et al., 2011; Ormel, 1983; Roberts, Walton, & Viechtbauer, 2006; Watson & Walker, 1996). Although small decreases with time and age (maturation) have been found, longitudinal studies have reported substantial mean-level stability during middle and late adulthood. Regarding differential stability, meta-analytic evidence has firmly established increasing stability across the life course, reaching a peak in later adulthood, but also decreasing stability with increasing time intervals between measurement occasions (Fraley & Roberts, 2005). Recent studies not included in the meta-analyses confirm these findings (Kandler et al., 2010; Lüdtke, Trautwein, & Husemann, 2009). Differential stability (r) seems to reach a moderate asymptote at about .40 over more than 20 years (Ormel & Rijsdijk, 2000; Wray, Birley, Sullivan, Visscher, & Martin, 2007).
Less agreement exists regarding the mechanisms that underlie differential stability in neuroticism. Traditionally, neuroticism has been decomposed into a stable component that is due to genetic effects and a change component, which is environmental. Over the last decades, growing evidence has begun to suggest that this view may be overly simplistic. For example, decreasing genetic influences have been reported with increasing age (Viken, Rose, Kaprio, & Koskenvuo, 1994). Three etiological theories have been proposed to explain differential stability in neuroticism. The genetic-set-point hypothesis posits that genetic factors determine individual set points to which individuals will return after environmentally influenced, short-term changes in personality scores (Carey, 2002). The genetic-maturation hypothesis assumes that rank-order stability is exclusively mediated by genetic factors and suggests that significant environmental effects on personality traits mainly result from short-term influences and systematic as well as random measurement error (McCrae et al., 2000). The genotype-environment-transaction hypothesis proposes that stability results from transactions between genetic and environmental factors contributing to estimates of both genetic and environmental effects on phenotypic stability and change (Caspi, Roberts, & Shiner, 2005).
Kandler and colleagues (2010) have referred to these three hypotheses in their three-wave study on genetic and environmental influences on personality traits. Their findings provided support for all three hypotheses. In line with the genotype-environment-transaction hypothesis, their results showed that personality change was primarily caused by environmental factors. In addition, influences on long-term stability were exclusively genetic, and innovation (occasion-specific) effects decreased with age, which provides support for the genetic-maturation hypothesis and, especially, the genetic-set-point hypothesis. However, attrition in their study was substantial (up to 79% in Wave 3), and although the authors suggested that dropout was random, it seems that the focus of the attrition analyses was on differences between responders and nonresponders at Wave 1 (and less at Waves 2 and 3). Consequently, it seems plausible that their attrition analyses did not provide information on differences between responders and nonresponders regarding long-term stability and change. Individuals with a stable personality are therefore likely to be overrepresented in their sample, resulting in an overestimation of personality stability, in particular the genetic influences on personality stability.
Our goal in the present study was to examine the longitudinal structure of neuroticism and reframe stability and change from the perspective of trait components (stability factors) and state components (change factors) using a genetic extension of the trait-state model. Genetic and environmental sources of the two components were estimated, which may contribute to an understanding of the etiology of mental disorders and their association with neuroticism. Moreover, we investigated whether heritability of neuroticism decreases with age, thereby providing evidence for the increasing importance of the environment. Finally, we tested whether the longitudinal structure of neuroticism was similar for older and younger twin pairs. Innovations of this study were the combination of a large sample, low attrition, and four assessment waves of neuroticism over a protracted period.
Method
Sample
The longitudinal sample for this study began with the 2,163 individual twins from female-female twin pairs who initially participated in the Virginia Adult Twin Study of Psychiatric and Substance Use Disorders (VATSPSUD). All twins were drawn from the population-based Virginia Twin Register (Kendler, Neale, Kessler, Heath, & Eaves, 1992; Kendler & Prescott, 2006). Twins who were born between 1934 and 1974 and who responded to the initial mailed questionnaire were eligible. The initial response rate was approximately 64%. Written informed consent was obtained before all face-to-face interviews, and verbal consent was obtained for all phone interviews. Zygosity was determined blindly using standard questions (Eaves, Eysenck, & Martin, 1989), photographs, and, when necessary, DNA analysis (Spence et al., 1988). Eight twins were dropped because of unresolved zygosity classification. This resulted in a sample that consisted of 597 complete and 48 singleton monozygotic (MZ) twin pairs and 433 complete and 47 singleton dizygotic (DZ) twin pairs.
After the initial questionnaire, twins were interviewed four subsequent times between 1988 and 1997. For the current study, we used data from the initial questionnaire (referred to here as Wave 1), Time 1 (here, Wave 2), Time 3 (here, Wave 3), and Time 4 (here, Wave 4); data from Time 2 were not used in this study. There was a mean of 17.3 months (SD = 3.8) between Waves 1 and 2, 45.0 months (SD = 4.0) between Waves 2 and 3, and 31.5 months (SD = 6.8) between Waves 3 and 4. Cooperation rates across waves ranged from 85% to 92%. The first wave was a face-to-face interview, whereas the other waves were predominantly completed by phone. At the time the participants completed the first interview, they ranged in age from 18 to 54 years (M = 29.3, SD = 7.7). For the current study, we included data from 1,125 twin pairs (57.3% MZ, 42.7% DZ), both complete and incomplete cases. Missingness at the individual level was about 4% at Wave 1, 15% at Wave 2, 12% at Wave 3, and 21% at Wave 4; missingness was due to nonresponse and attrition.
Neuroticism
Neuroticism was assessed on the initial questionnaire and in three of the four subsequent time points. In the initial questionnaire, neuroticism items were part of 54 items from the Eysenck Personality Questionnaire (EPQ; H. J. Eysenck & Eysenck, 1975). In follow-up Waves 1, 3, and 4, we included 12 items from the shortened EPQ (S. B. G. Eysenck, Eysenck, & Barrett, 1985) as either part of the main interview (Waves 3 and 4) or as a separate self-report questionnaire (Wave 2, the first time point after the initial questionnaire). For each occasion, a composite score was created by summing the 12 binary items (no = 0 and yes = 1). These sum variables displayed increasing positive skewness across waves. To address possible assumption violations (e.g., multivariate normality), we modeled variables as ordinal. Because of the prohibitive number of estimated thresholds (12 per occasion), variables were reorganized into five ordered categories jointly. Although variables were treated as ordinal, the parameterization proposed in Mehta, Neale, and Flay (2004) was used. By fixing the first and second thresholds to 0 and 1, respectively, and estimating the remaining thresholds, we ensured that the model could test change hypotheses using the normal continuous latent response variables (polychoric correlations). The test-retest stability (reliability) of neuroticism was .63 between Waves 1 and 2, .60 between Waves 2 and 3, and .67 between Waves 3 and 4.
Statistical analyses
Over the past decades, new methodologies have been developed to enable researchers to study longitudinal structures using a trait-state model (Duncan Jones, Fergusson, Ormel, & Horwood, 1990; Kenny & Zautra, 1995; Ormel & Schaufeli, 1991). Using a trait-state model, trait variance can be disentangled from state variance. Whereas trait variance reflects stable individual differences, state variance represents occasion-specific variation. The state component was further decomposed into both autoregressive (short-term stability across one time interval) and innovation (occasional specificity) parameters. In addition, to solve the model, it is necessary to assume that the trait and state components are statistically independent (Ormel & Rijsdijk, 2000). Here, we used a behavior genetic trait-state model, in which measurement error was subsumed under (and thus confounded with) the environmental-innovation component. In this specification, separate occasion-specific measurement errors as described by Kenny and Zautra (1995) were not included in the model because these parameters were not identified.
We extended the latent trait-state model to include genetic and environmental components in order to evaluate the extent to which observed phenotypic stability and change are determined by genetic and environmental effects. The model (Fig. 1) included genetic (A), shared environmental (C), and nonshared environmental (E) effects that influence the stable individual differences portion of neuroticism across the four waves, as modeled by a common latent trait factor. The model also included genetic and environmental effects that influenced the occasion-specific aspects of neuroticism through a state component consisting of genetic and environmental innovation (Waves 1–4) and genetic and environmental autoregression effects (Waves 2–4). Whereas the relative contribution of genetic and environmental trait influences are the same across waves, the contributions in the carryover and innovation effects within the state component can differ among the subsequent waves. To examine differences between older and younger twins, the sample was split based on the mean age (29.3 years). This resulted in a sample of young twin pairs (n = 627) and a sample of older twin pairs (n = 405). Data from complete twin pairs with information on age were used. No information on age was available for 23 twin pairs. We used z tests for independent samples to examine whether differences in the proportions of explained trait and state variance differed significantly between the two age groups. Tests of whether the proportions of trait and state variance significantly differed across waves (within each age group) were performed by means of one-sample z tests.
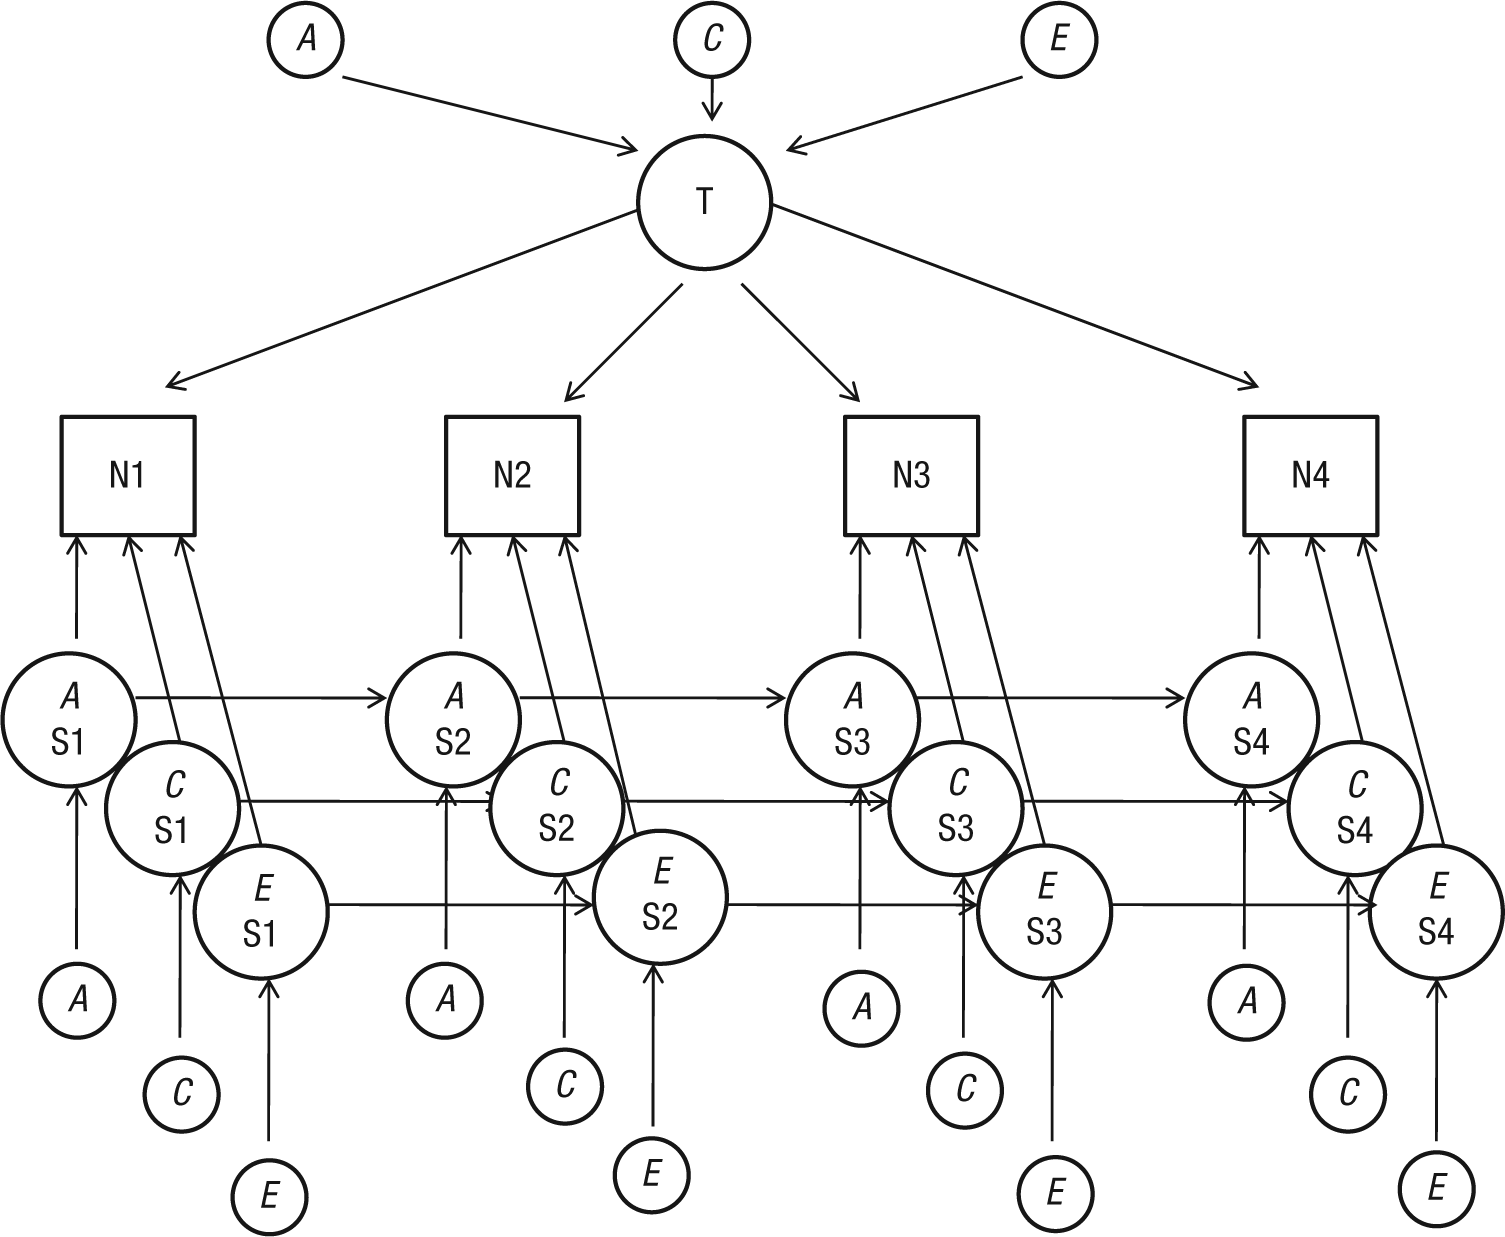
Schematic representation of the trait-state model of neuroticism (N). The model describes the influence of trait levels of neuroticism (T) and genetic (A), shared environmental (C), and nonshared environmental (E) influences of state levels of neuroticism (S) at four waves of measurement (1–4). Circles are latent variables, and squares are observed variables. All exogenous variables (without single-headed paths pointing to them) have variance fixed at unity.
This genetic extension of the classic trait-state model differs from the models used by Kandler and colleagues (2010), referred to in the introduction of this article, with regard to the autoregressive part of the model. Kandler et al. link the latent true-score variables by means of autoregression. Consequently, trait variance can be transmitted through autoregression. In our model, in contrast, the latent true-score variables are linked through separate state variables. Although our model and Kandler et al.’s model are both valid, our model enables a stricter decomposition between autoregressive and true trait variance.
Analyses were performed using the free OpenMx package developed within the R language (Boker et al., 2011). OpenMx offers a flexible structural-equation-modeling platform to specify and estimate longitudinal twin models using full-information maximum-likelihood estimation. With OpenMx, the additive A, C, and E components are estimated using an iterative search process that finds parameter values that reproduce the observed MZ and DZ twin variance-covariance matrices as closely as possible. Model fits were compared in order to select a best-fitting model based on the Akaike information criterion (AIC; Akaike, 1987). The lower the AIC value, the better the overall model fits the data.
Results
Descriptive statistics
Descriptive statistics for the total sample are presented in Table 1. Mean values were based on the rescaled neuroticism scores. From Wave 1 to Wave 4, mean neuroticism scores declined significantly (p < .001). Older and younger twin pairs did not differ with regard to changes in neuroticism (p = .465). Cross-twin correlations were higher in MZ than in DZ twins, which suggests the presence of genetic influences (Eaves et al., 1989). Overall, correlations declined as intervals between time points increased.
Results for Neuroticism Among Monozygotic (MZ) and Dizygotic (DZ) Twins: Descriptive Statistics and Correlations Between Scores at the Four Waves of Measurement
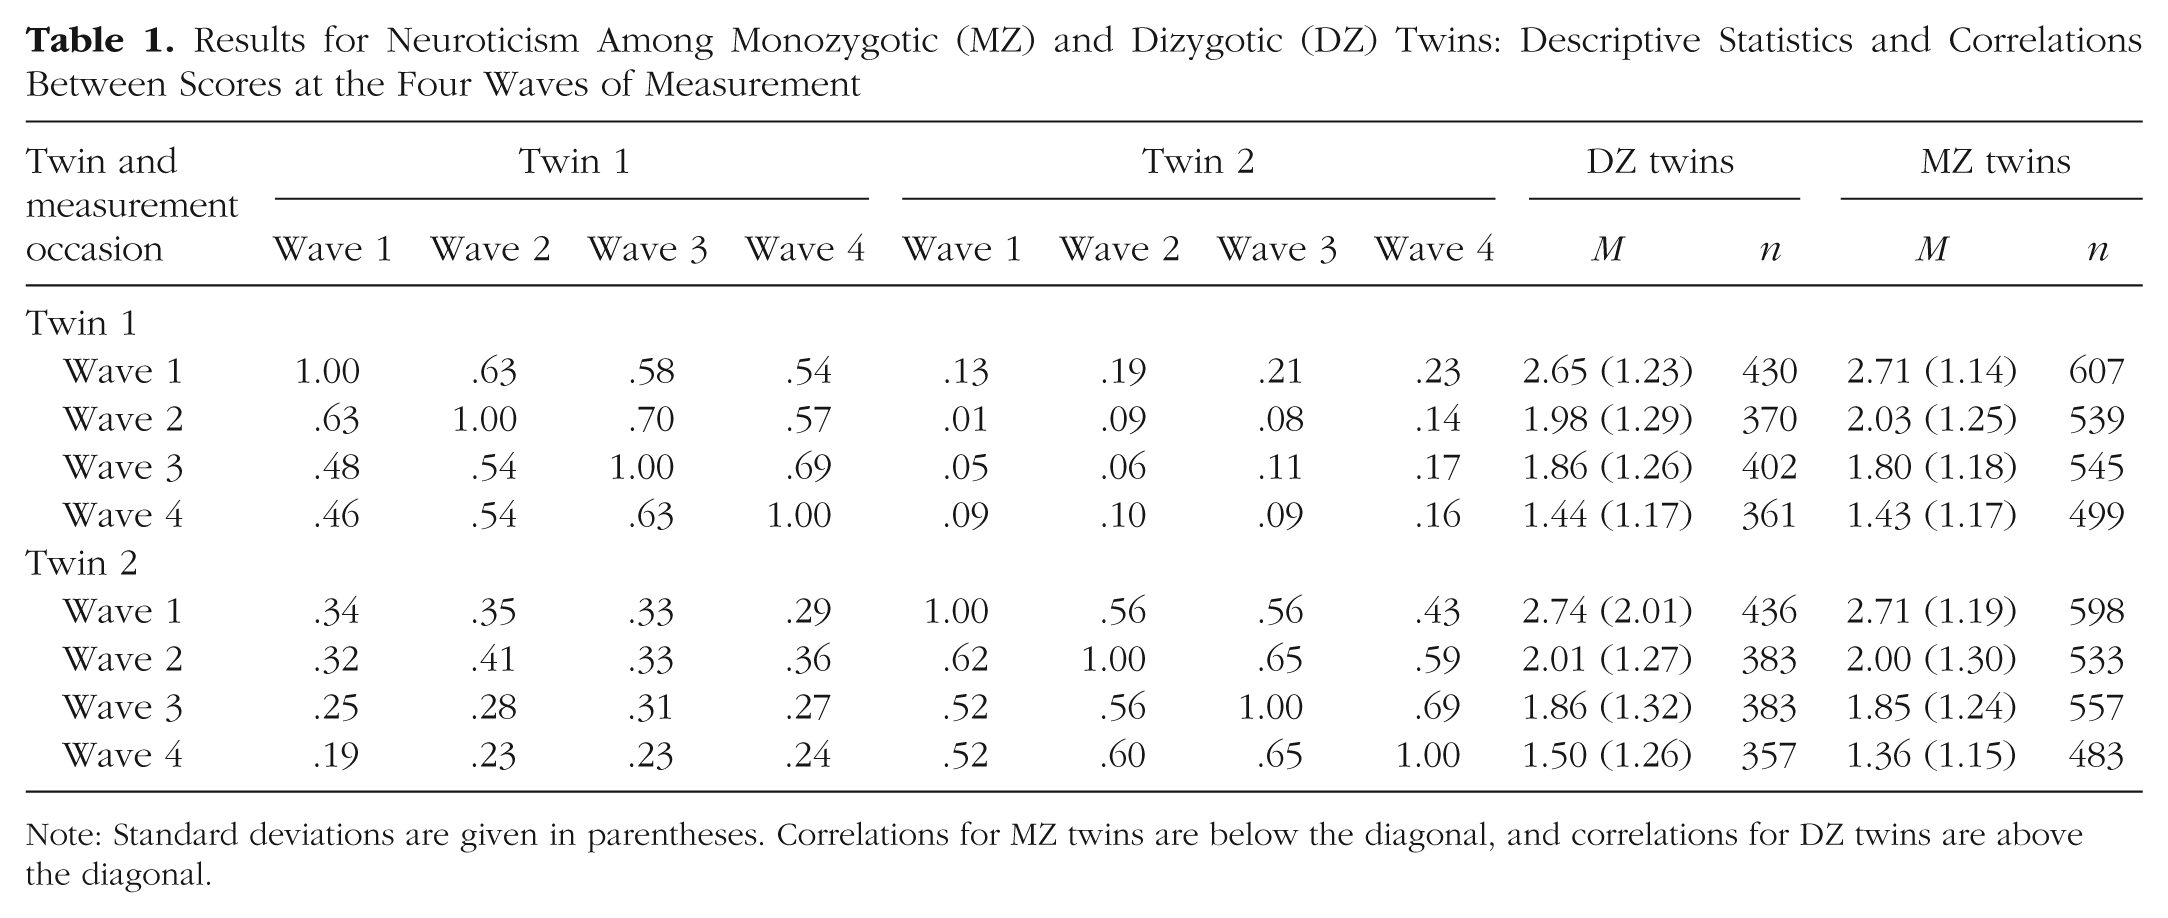
Note: Standard deviations are given in parentheses. Correlations for MZ twins are below the diagonal, and correlations for DZ twins are above the diagonal.
Model-fitting results
Our goal in this study was threefold. First, we wanted to determine to what degree the longitudinal structure of neuroticism could be attributed to trait versus state components. Second, we aimed to estimate the relative contribution of additive A, C, and E influences over the four waves of data collection, and, finally, we examined whether the longitudinal structure of neuroticism was similar for older and younger twins.
Trait versus state components
First, we tested the full ACE trait-state model, which included latent trait and state factors derived from the neuroticism scores at the four waves (Fig. 1). As proposed by Duncan Jones and colleagues (1990), factor loadings were constrained to be equal across waves. Although allowing factor loadings to vary at the different time points may have improved the fit of the data, equality constraints across time are a key feature for interpreting the single common factor as being a stable characteristic of individual differences in neuroticism covariation over time.
Subsequently, we compared the full ACE model with an AE model, in which all shared environmental components were dropped. Model-fitting results and comparative fit statistics are reported in Table 2. In line with the literature, the fit of this model was not significantly worse than that of the full ACE model, and the subsequent analyses were carried out using the more parsimonious AE model.
Results for the Models of Neuroticism Scores and Comparisons Between Models
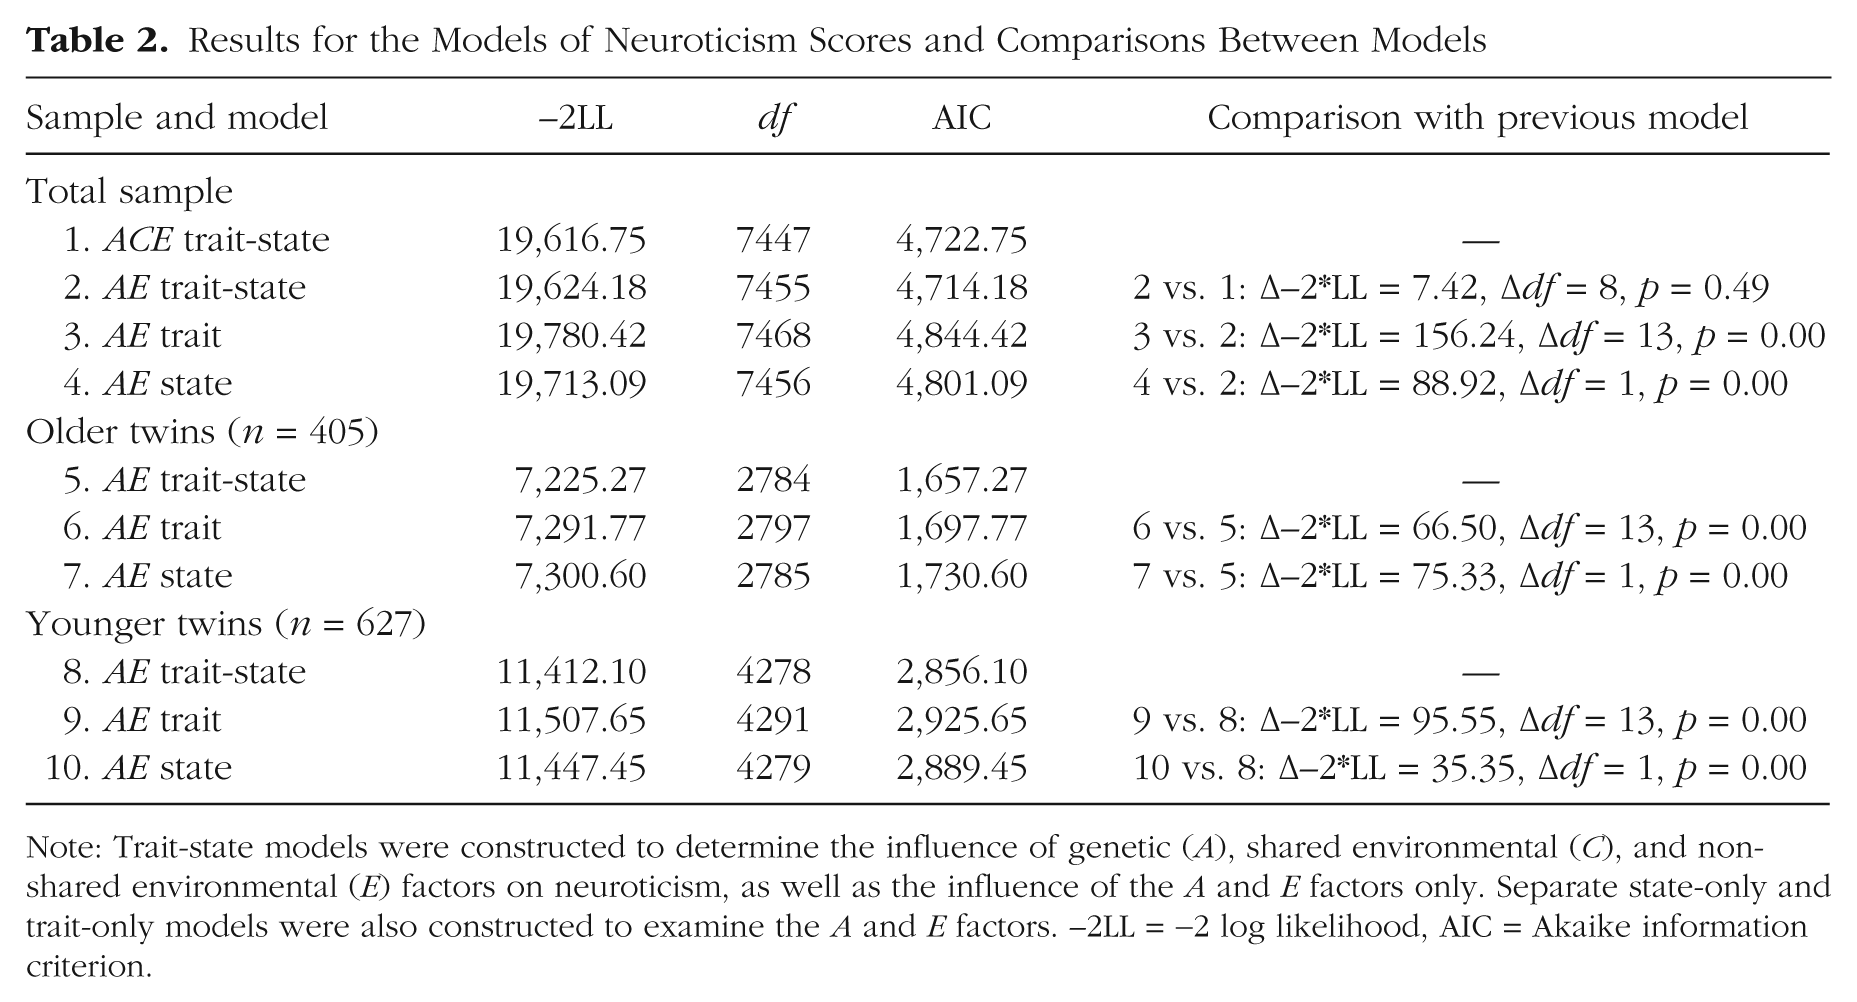
Note: Trait-state models were constructed to determine the influence of genetic (A), shared environmental (C), and nonshared environmental (E) factors on neuroticism, as well as the influence of the A and E factors only. Separate state-only and trait-only models were also constructed to examine the A and E factors. −2LL = −2 log likelihood, AIC = Akaike information criterion.
Comparison of the AE trait-state model with the AE trait-only model and the AE state-only model suggested that the covariance pattern of the neuroticism data could not be explained by either a trait-only or a state-only model (Table 2). Comparison of the AIC values indicated that the AE trait-state model fit the data better than the AE trait- and state-only models did. Figure 2 presents proportions of variance of the neuroticism scores explained by the state and trait components. Total trait and total state variance together equal 1.00. For reasons of parsimony, we have reported only the standardized solution. Unstandardized path estimates and confidence intervals are available from the corresponding author on request. Additionally, all relative A, E, trait and state components are presented in Table 3.
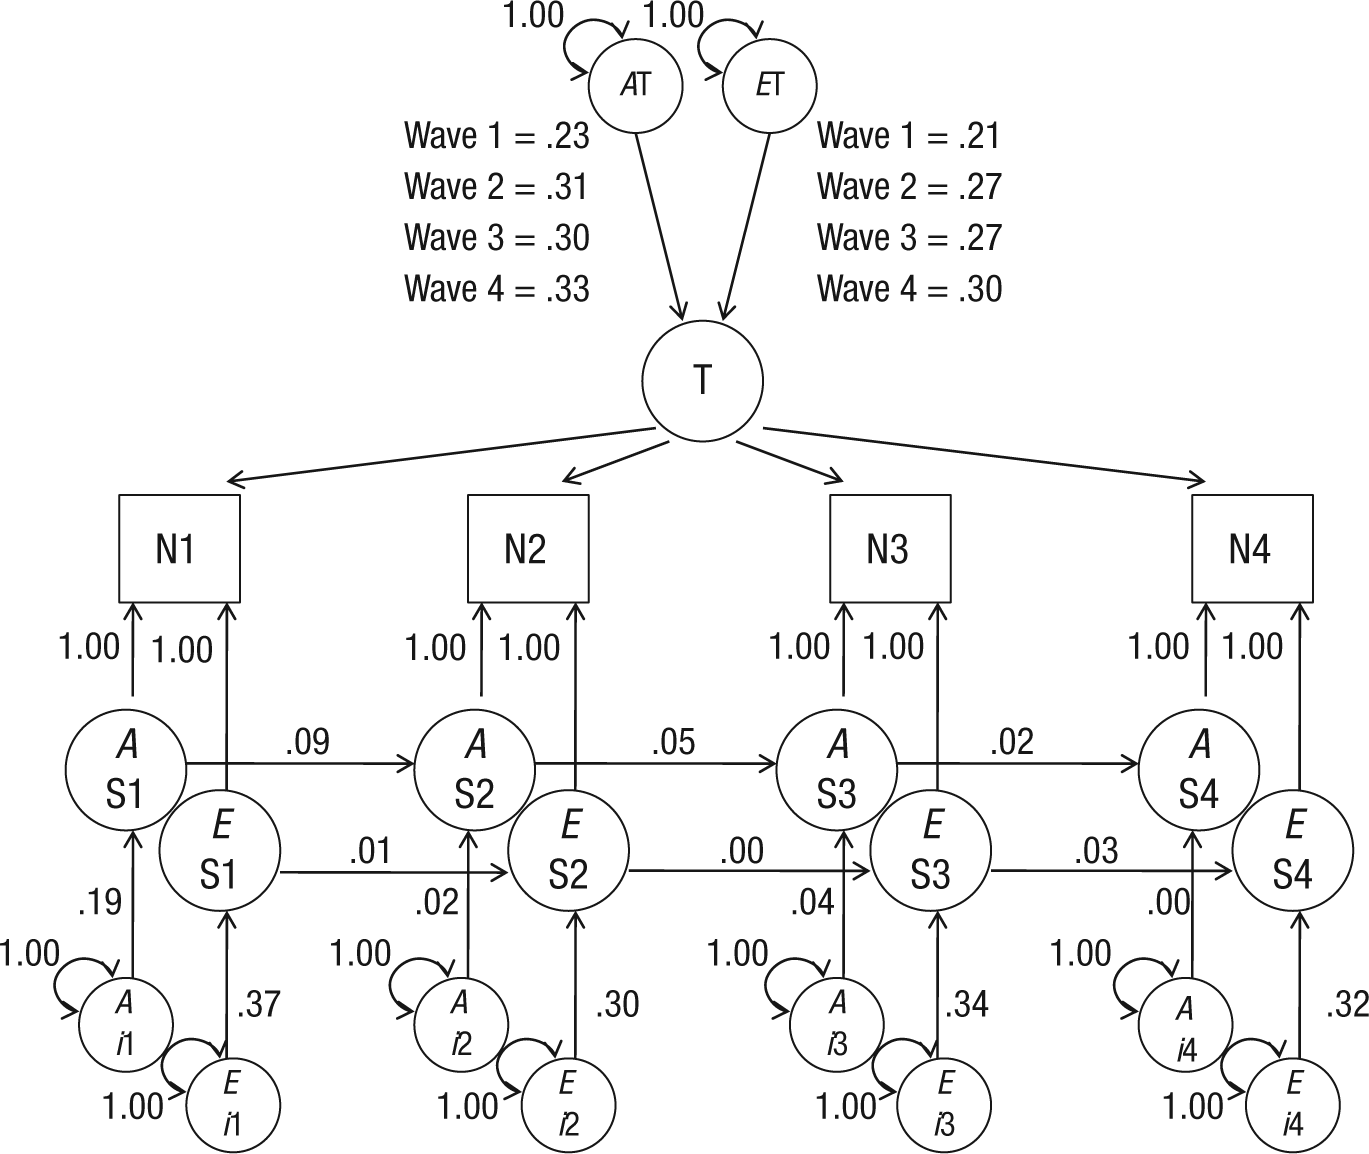
Proportions of variance in the trait-state model of neuroticism (N) for the total sample (N = 1,125) explained by genetic (A) and nonshared environmental (E) influences. The model describes the influence of trait levels of neuroticism (T) and A and E influences of state levels of neuroticism (S) at four waves of measurement (1–4). Circles are latent variables, and squares are observed variables. All exogenous variables (without single-headed paths pointing to them) have variance fixed at unity. Occasion-specific variance (innovation) is designated by i. Measurement error (indicated by double-headed arrows) was fixed at 1.00.
Proportion of Variance Explained by the Different Factors of the Trait-State Model Fitted on the Neuroticism Scores for the Total Sample and for the Two Age Groups at the Four Waves of Measurement
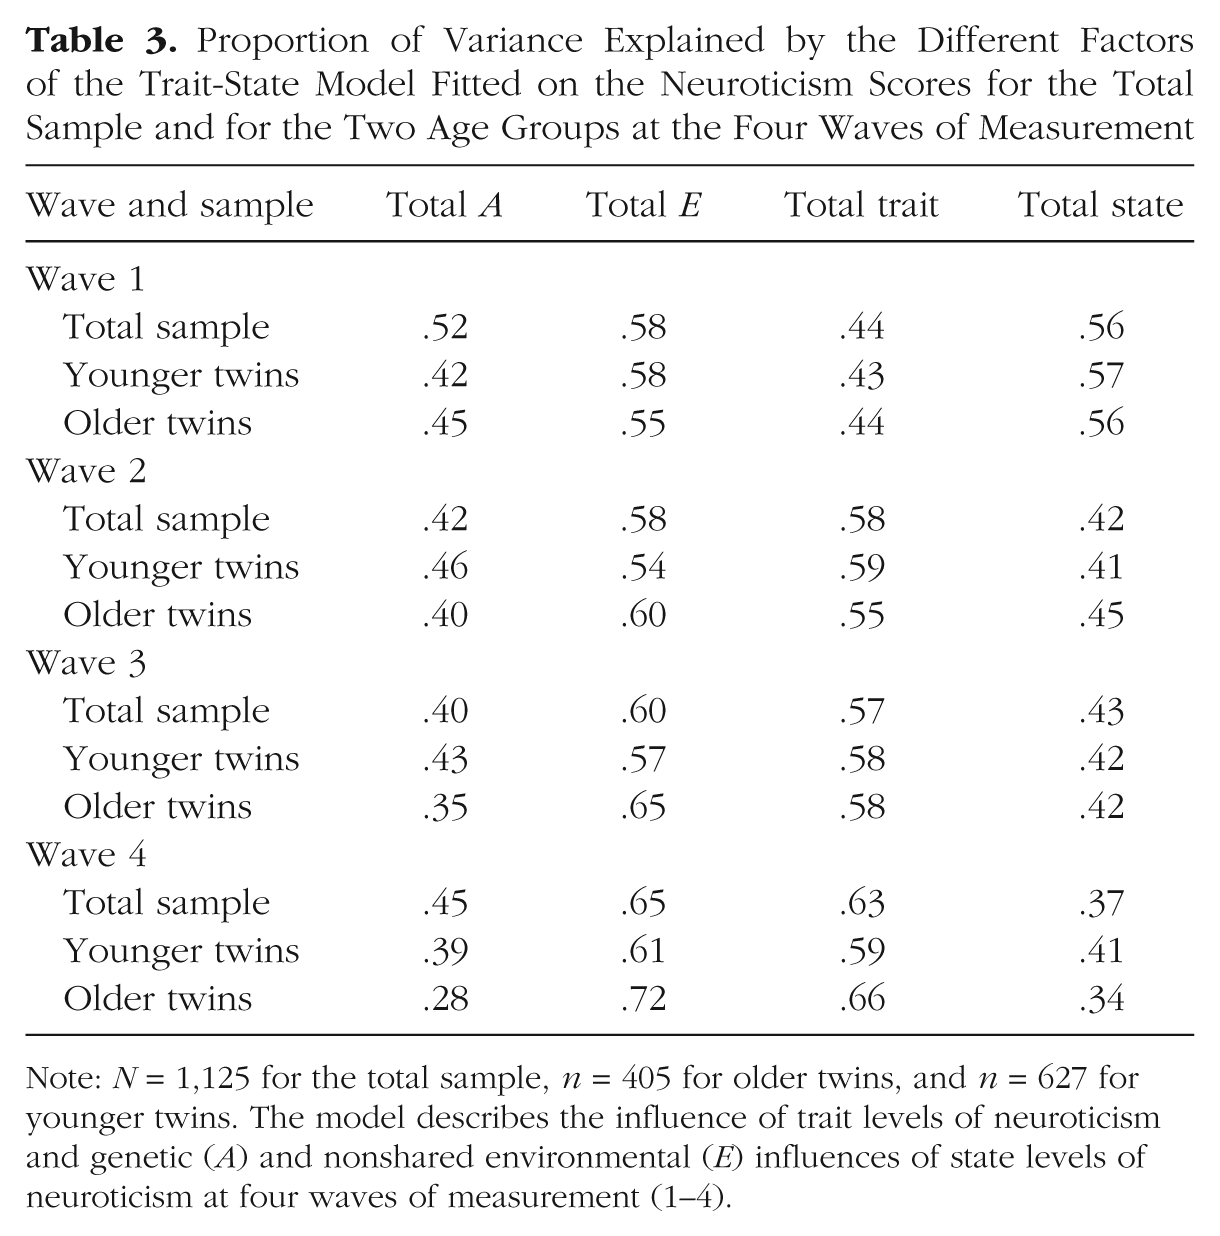
Note: N = 1,125 for the total sample, n = 405 for older twins, and n = 627 for younger twins. The model describes the influence of trait levels of neuroticism and genetic (A) and nonshared environmental (E) influences of state levels of neuroticism at four waves of measurement (1–4).
Genetic versus environmental influences
Second, we estimated separately the contribution of genetic and environmental influences on neuroticism (Table 3). The contribution of genetic influences was somewhat smaller than that of nonshared environmental influences and decreased slightly over time (for the difference between the environmental and genetic component, p < .001 at Wave 4). Genetic and environmental influences on the trait component did not differ significantly. Regarding the state component, the largest part was attributed to innovation of the nonshared environment (e.g., for Waves 2–4, p < .001), except at Wave 1, when a relatively substantial amount of variance was explained by genetic innovation. However, also at Wave 1, the environmental contribution was significantly larger than the genetic contribution (p = .003) The autoregressive part of the state component was mainly genetic (for Waves 1 and 2 and for Waves 2 and 3, p < .001) but declined from Wave 3 to Wave 4 (p = .134). Almost no state variance was explained by transmission of nonshared environmental effects. The decline in the autoregressive component was in line with the differences in average elapsed time intervals between the subsequent assessments. The interval between Wave 1 and Wave 2 was shorter than between the other waves.
Age differences
For both age groups, the trait-state model provided the best fit (Table 2). However, the groups did differ with regard to the proportion of trait and state variance and with regard to the strength of the genetic and environmental influences. Figures 3a and 3b and Table 3 present the proportions of explained variance in the neuroticism scores. Overall, the increase across waves in trait variance was smaller in younger than in older twins. Whereas the proportions of trait variance did not differ between the groups in Wave 1, the difference increased across waves, resulting in a significant larger trait component in older twins than in younger twins at Wave 4 (p = .023). Also, the decrease across waves in genetic variance was larger in older than in younger twins. Both in older and in younger twins, the genetic (p = .002 and p = .014, respectively) and the environmental (p < .001 and p = .010, respectively) contributions increased from Wave 1 to Wave 4. The genetic sources of trait variance were larger than any of the genetic proportions in the state component in the younger age group (all ps < .001), whereas the reverse was found for the older twins. For the older twins, the environmental sources of trait variance (except at Wave 1) were larger than the environmental proportions of the state component (ps ranged from < .001–.012).
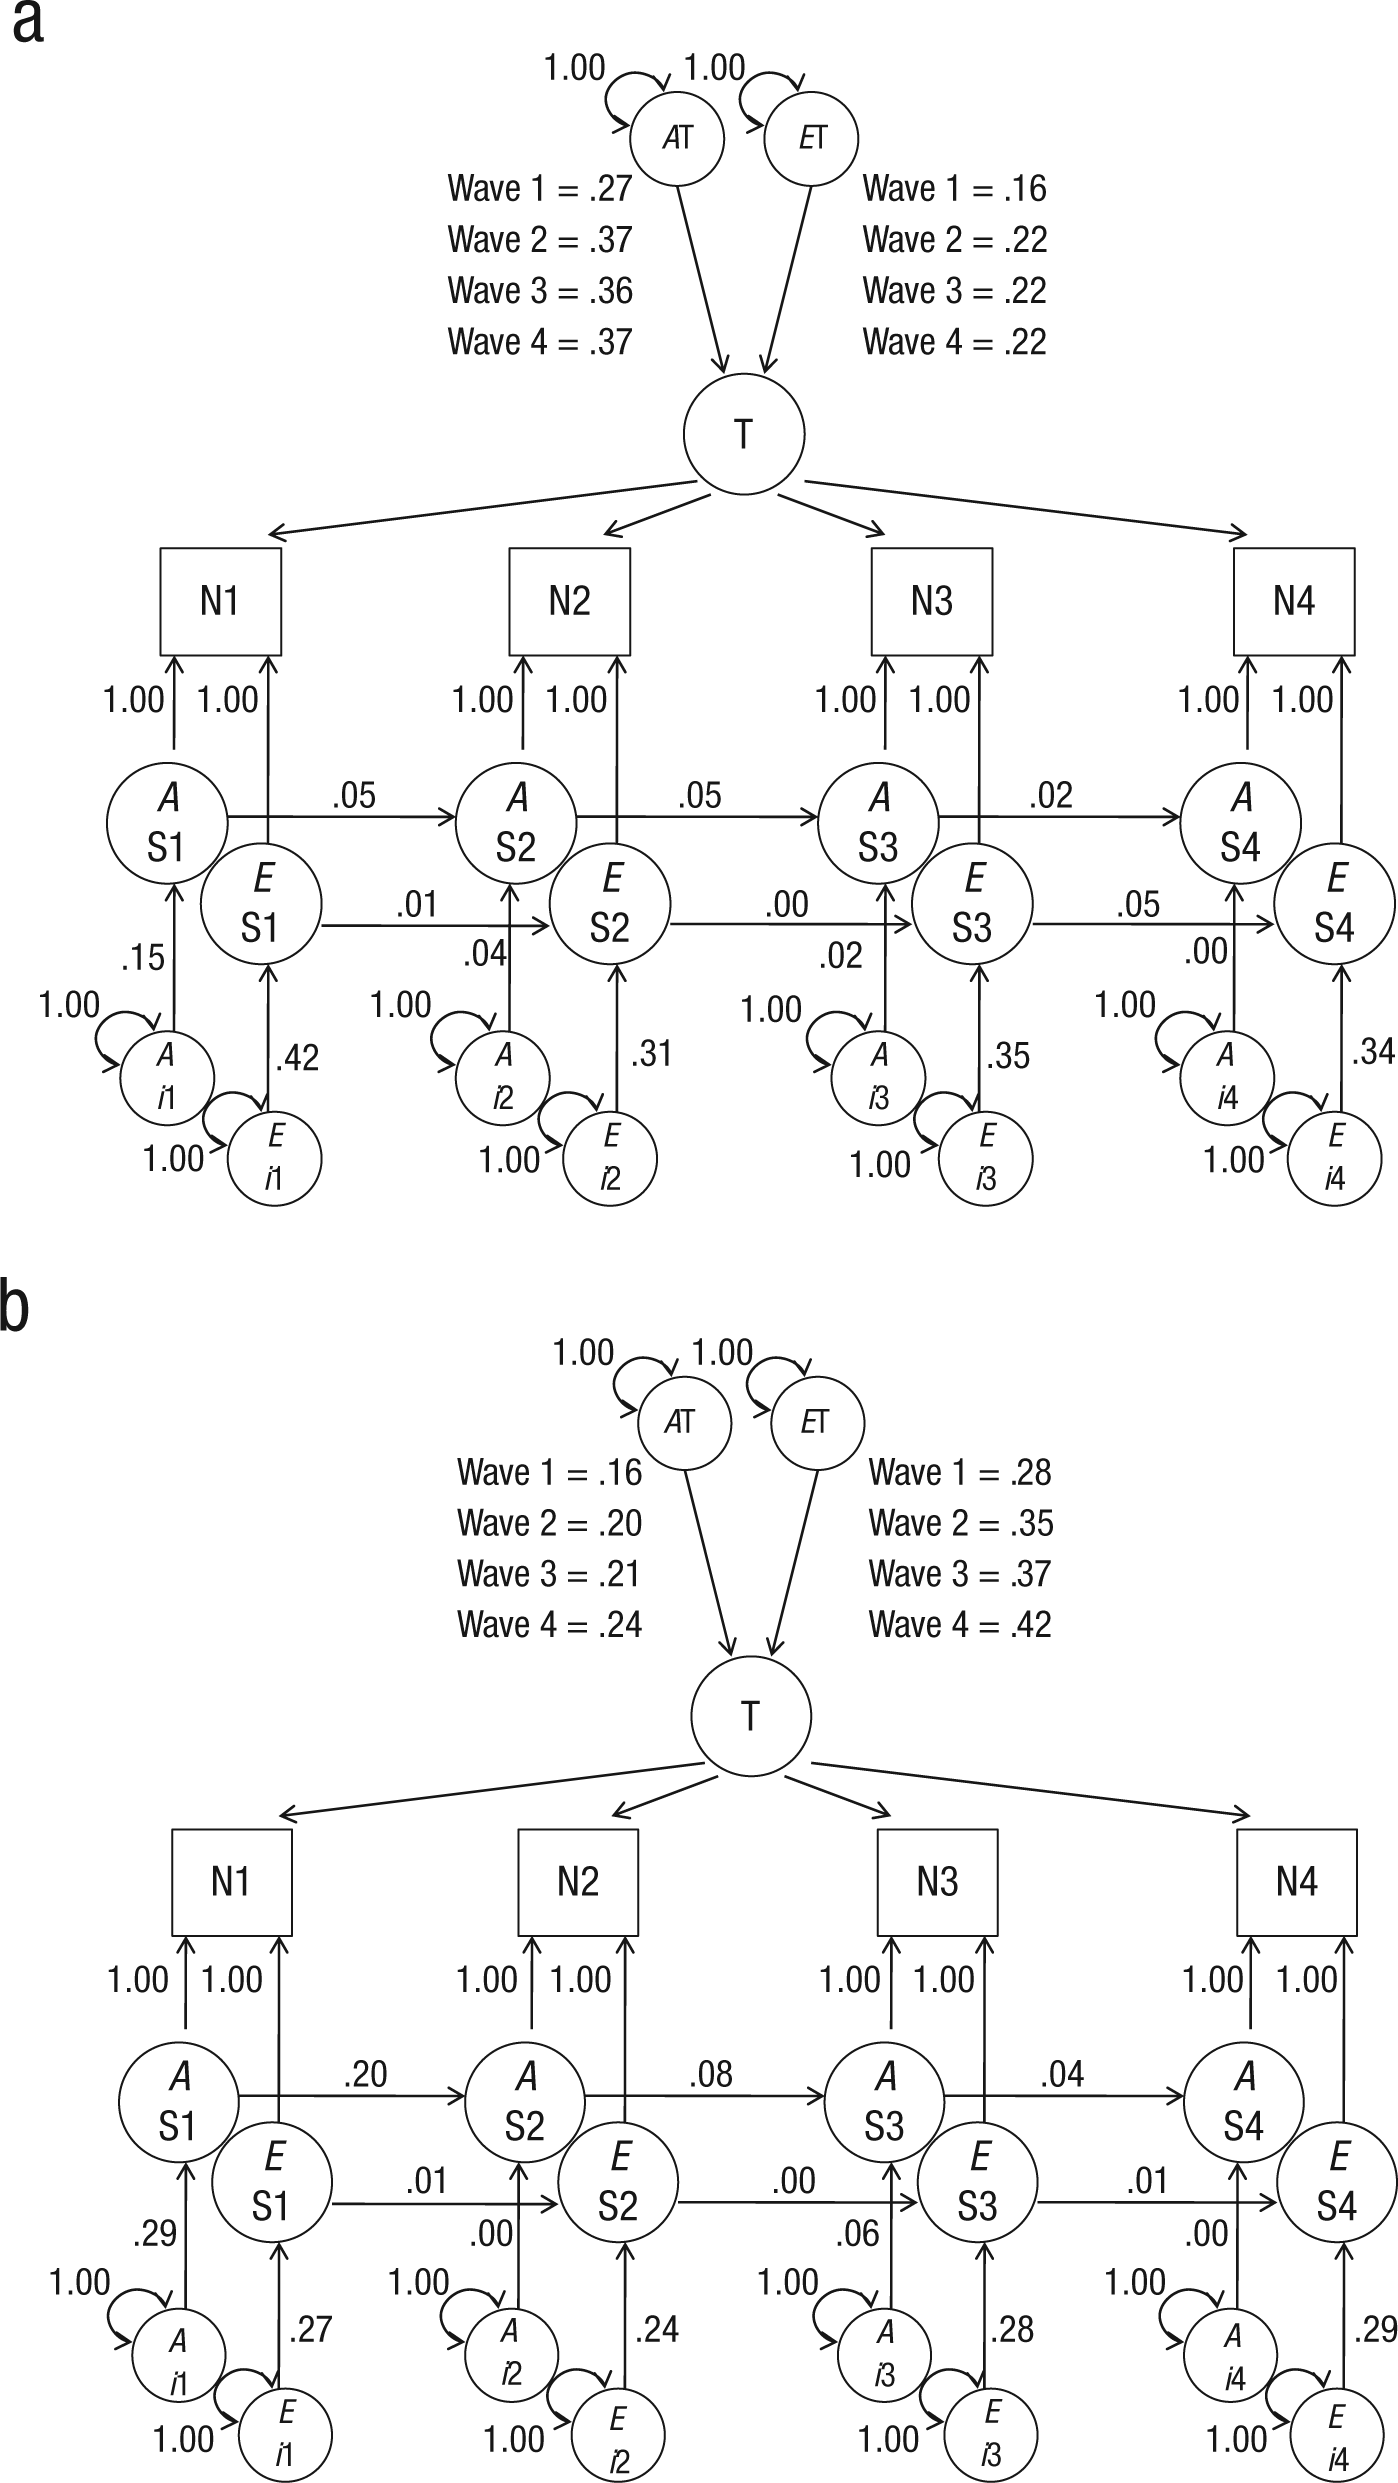
Proportions of variance in the trait-state model of neuroticism (N) for (a) younger twins and (b) older twins explained by genetic (A) and nonshared environmental (E) influences. The model describes the influence of trait levels of neuroticism (T) and A and E influences of state levels of neuroticism (S) at four waves of measurement (1–4). Circles are latent variables, and squares are observed variables. All exogenous variables (without single-headed paths pointing to them) have variance fixed at unity. Occasion-specific variance (innovation) is designated by i. Measurement error (indicated by double-headed arrows) was fixed at 1.00.
Discussion
Combining a trait-state approach with a genetically informative design, this study sought to extend knowledge of the longitudinal structure of neuroticism. A trait-only, a state-only, and a trait-state model were fitted to four waves of neuroticism data. The trait-state model fit the data well, which indicates that longitudinal correlations have a trait factor as well as a state component that includes both autoregressive and innovative effects. Both the trait and the state component were influenced by genetic and environmental effects, with—as expected—relatively more genetic variance in the trait than in the state component. In our study, substantially more trait variance could be accounted for by nonshared environmental effects than reported in two earlier studies (Kandler et al., 2010; Viken et al., 1994). Although the model held for both younger and older twins, the strength of the genetic and environmental influences differed, with more environmental trait variance in the older twins.
Our findings are most consistent with the genotype-environment-transaction hypothesis. As postulated by Caspi and colleagues (2005) and further tested by Kandler and colleagues (2010), both continuity and change result from transactions between genetic and environmental factors. Moreover, our finding that stability of neuroticism increased across waves and with age, as well as the fact that the environmental component of neuroticism was larger in older than in younger twins, is in line with both social selection (people select environments that correlate with their neuroticism) and social influence (these environments produce experiences that influence neuroticism; Caspi et al., 2005). Our findings do not provide substantial support for the genetic-maturation hypothesis. Although we found some evidence for new genetic influences (but not at the last wave), stability was not primarily influenced by new genetic factors. Limited evidence was also found for the genetic-set-point hypothesis. Although our findings support the notion of a set point, the qualification that the set point has only genetic sources did not hold; we found substantial environmental influences, especially in the older twins.
This substantial environmental influence on the trait component, in particular on older twins, is perhaps the most exciting finding. Traditionally, it has been assumed that genetic influences are mainly reflected by stability, whereas environmental influences affect change. Moreover, because heritability has traditionally been found to increase over time and across age in other fields of research (e.g., cognitive abilities), changes in heritability with regard to neuroticism have often been neglected. Our findings suggest that heritability of neuroticism tends to decrease. Only a few studies have pointed to the possibility of genetic influences on change and of (increasing) nonshared environmental influences on stability (Kandler et al., 2010; Viken et al., 1994). Our study convincingly confirms this possibility. Nearly half of the trait variance has environmental origins. This can reflect childhood experiences (H. J. Eysenck & Eysenck, 1975) but may also confirm the suggestion that people select their own environment and therefore enhance continuity of their personality (Caspi et al., 2005; Krueger, Johnson, & Kling, 2006; Scarr & McCartney, 1983). Nonshared environmental effects also contributed substantially to change. About a third of the variance in neuroticism scores could be explained by nonshared environmental innovation. Although this finding is in line with previous results (e.g., Wray et al., 2007), caution should be used when interpreting these proportions. Both in our study and in the studies mentioned, nonshared environmental effects are confounded with time-specific error variance. Additionally, in accord with Bleidorn and colleagues (2009), our results suggest that genetic effects are not exclusively involved in stability, but that new genetic effects may also influence change in neuroticism scores. This genetic innovation was substantial at the start of the study because it subsumes all genetic transmission effects that are not captured by the trait component. Moreover, at the first wave, autoregressive variance could not be disentangled from innovation, and statistically, all state variance is by definition included in the innovation component. Consequently, some caution is needed when comparing the genetic and environmental contributions at the first wave with the contributions at the subsequent waves.
Of the small autoregressive component in our study, almost all of this effect was due to transmission of genetic variance. This suggests that (a) new nonshared environmental effects, although present, influence neuroticism scores only for a relatively short period of time, and (b) new genetic effects, although small in magnitude, can influence neuroticism scores over a protracted period. In addition, the modest amount of environmental autoregression is consistent with the findings of Kendler and colleagues (2011), which show increasing divergence of scores for depression and anxiety symptoms (which are highly correlated with neuroticism) with increasing age in MZ twin pairs.
Not only the findings on environmental autoregression, but also other aspects of our model can be interpreted in terms of psychopathology. Most important, our results show that an individual’s level of neuroticism is not set in concrete but somewhat modifiable if the cumulative transactions of social selection and social influence that determine neuroticism can be turned around in a more adaptive direction. Given that neuroticism has been shown to be the strongest predictor of psychopathology, the significant environmental influences on the neuroticism set point and the change in neuroticism imply the possibility of modifying neuroticism through preventive and treatment interventions.
Despite a variety of strengths, including the twin design, large epidemiologically representative sample, limited attrition, multiple waves, and long study period, the current study has limitations. Although our findings suggest age effects, time intervals between waves should be more equally distributed over the years to study age in more detail than we did by splitting the sample. A concern related to the issue of unequal time intervals is the drop in mean neuroticism scores across waves. Small drops with age have often been reported in the literature, but the larger declines we found in our sample appear atypical. Some decline can probably be explained by test-retest effects and by age. In addition, whereas at the first time point, a self-report questionnaire was used, an interview was administered at all other time points. By developing a more complex statistical model than the already sophisticated one we used here, it might be possible to disentangle mode and interval length and, subsequently, to gain additional insight into mean-level changes. Future research might address this methodologically interesting but highly complex issue. Additionally, by moving toward a more methodological approach, it might be possible to test whether and how slight modifications in the model would affect the current results. Testing alternative assumptions and constraints would provide information on the robustness of the current findings. For example, it would be interesting to compare our findings with results of a model proposed by Kenny and Zautra (1995), in which a stationary constraint is imposed so that the contributions of trait and state components are the same at each wave and the stability of the autoregressive component is assumed to be the same over time. Nonetheless, given the aims of the current study (i.e., disentangling trait and state components of neuroticism) and the limitations of a four-wave design (i.e., underidentification of more complex models), such a methodological approach was beyond the scope and possibilities of our study.
Another limitation might be the assumption of uncorrelated genetic influences on the trait and the state factors. From the perspective of most genetic studies, it seems reasonable to allow different genetic influences to correlate. However, the classic trait-state model assumes that trait and state components are independent. We feel that this is reasonable to assume because these forms of variance can have different genetic effects. The trait factor covers the genetic influences, which are stable across the total study period, whereas the genetic influences on the state components are not immutable across the study period but time dependent (e.g., on factors such as age and context). Finally, our sample included only female twins. Although we cannot envision why the longitudinal structure of neuroticism would be different in men, the current findings may not generalize to men.
In conclusion, the current study was designed to disentangle the longitudinal structure of neuroticism and to estimate the genetic and environmental contributions to differential stability and change. In line with classic views on personality, a substantial trait component was found, but additionally, and confirming some more recent studies (Kandler et al., 2010; Ormel & Rijsdijk, 2000; Viken et al., 1994), a substantial state component was detected (including both innovation and some autoregression). Remarkably, and new to the literature, the contributions of genetic and environmental influences on the trait component were nearly equal, which suggests that the genetic-set-point model of neuroticism is incomplete. All things considered, the data most strongly support the genotype-environment-transaction model (Caspi et al., 2005). From this perspective, neuroticism is best seen as the result of two mutually supportive life-course dynamics: social selection and social influence. This insight provides heuristic tools for changing neuroticism and, hence, vulnerability.
Footnotes
Declaration of Conflicting Interests
The authors declared that they had no conflicts of interest with respect to their authorship or the publication of this article.