



Abstract
Studies of intelligence in children reveal significantly higher heritability among groups with high socioeconomic status (SES) than among groups with low SES. These interaction effects, however, have not been examined in adults, when between-families environmental effects are reduced. Using 1,702 adult twins (aged 24–84) for whom intelligence assessment data were available, we tested for interactions between childhood SES and genetic effects, between-families environmental effects, and unique environmental effects. Higher SES was associated with higher mean intelligence scores. Moreover, the magnitude of genetic influences on intelligence was proportional to SES. By contrast, environmental influences were constant. These results suggest that rather than setting lower and upper bounds on intelligence, genes multiply environmental inputs that support intellectual growth. This mechanism implies that increasing SES may raise average intelligence but also magnifies individual differences in intelligence.
Research involving American children suggests that among those raised in families with high socioeconomic status (SES), IQ differences largely reflect genetic factors; among families with lower SES, however, IQ differences reflect between-families environmental effects (Rowe, Jacobson, & Van den Oord, 1999). Is this still true in adults, in whom the average effects of the family environment on intelligence are greatly reduced and, if so, to what extent (Deary, Spinath, & Bates, 2006)? Understanding the timing and persistence of genetic and environmental processes is central to developmental science, and diathesis stress (Gottesman & Shields, 1982), reaction-range (Turkheimer & Gottesman, 1991), and bioecological models (Bronfenbrenner & Ceci, 1994) each make distinct predictions about the direction of Gene × SES interactions and the SES contexts in which they occur. Here, using a national probability sample of adult American twins, we investigated the effects of childhood SES on mean levels of and variance in intelligence across adulthood.
Data on differences in intelligence during early childhood suggest countervailing effects of genes and between-families environmental differences, with strong genetic effects at high levels of SES and strong between-families environmental effects at low levels of SES. This leaves total variance equal across the range of SES. For instance, Turkheimer, Haley, Waldron, D’Onofrio, and Gottesman (2003) found that in affluent families, genetic differences accounted for approximately 60% of the variance in IQ, whereas the effects of between-families environmental differences were almost nonexistent. In poor families, however, the pattern was reversed. Gene × SES interactions have been identified in samples of children as young as 2 years old (Tucker-Drob, Rhemtulla, Harden, Turkheimer, & Fask, 2011), but this pattern of effects has not always been replicated. Hanscombe et al. (2012), for instance, found support only for interactions of between-families environmental effects and SES.
The status of genetic and environmental interactions with SES in adulthood is unclear. Important neuronal migration and pruning events affecting intelligence occur during childhood (Shaw et al., 2006). If childhood is a sensitive period for brain development, which seems likely (Giedd et al., 1999), then Gene × SES interactions may endure long after between-families environmental effects on intelligence have decreased to minimal levels (Haworth et al., 2010). If the relative influence of family and unique environmental factors reverses in adolescence (Harris, 1995), one might expect the emergence of Unique Environment × SES interactions in adulthood. Finally, the loss of large between-families environmental effects may cause interaction effects to decrease below significance.
Results from studies of adolescents have been mixed on this issue. Harden, Turkheimer, and Loehlin (2007) found that SES interacted with genes but not with the between-families environment among 839 pairs of 17-year-old twins. In contrast, Grant et al. (2010) found no evidence for Gene × SES interactions by age 19 or 20 years in more than 3,000 twin pairs inducted into the armed forces. Researchers have published only one study in which moderation of the heritability of intelligence in mature adults was examined; there was no evidence for an interaction of a binary measure of parental education with intelligence in 370 adult twins and siblings aged 36 to 65 (van der Sluis, Willemsen, de Geus, Boomsma, & Posthuma, 2008). However, the small sample size and the conservative nature of the Gene × SES design (van der Sluis, Posthuma, & Dolan, 2012) gave this study low power to detect Gene × Environment effects.
Consequently, SES interaction effects on IQ in mature adults are unclear. The adult pattern may match that found in children (Turkheimer et al., 2003). In a variation on that result, Harris (1995) found that as family-environment effects weaken, SES interactions may shift from the family environment to the unique environment. Alternatively, all interactions may be eliminated as heritability settles at high levels, irrespective of original SES (van der Sluis et al., 2008). Finally, although shared environmental interactions may be eliminated, Gene × SES environmental effects may endure across the life span, mirroring childhood changes in brain development (Giedd et al., 1999; Shaw et al., 2006).
We tested these hypotheses using data from Waves 1 and 2 of the MacArthur Foundation’s Midlife in the United States (MIDUS) survey. We built three statistical models. Mean levels of ability associated with SES must be modeled to validly assess interactions in which the moderator (such as SES) may be heritable and correlated with the trait of interest (Purcell, 2002; van der Sluis et al., 2012). In our first model, therefore, we examined whether SES was associated with phenotypic differences in intelligence. We predicted that higher SES would be weakly associated with higher intelligence, which is reflected in the results of some large-sample studies (Sackett et al., 2012). In our second model, we examined main genetic effects (A), between-families environmental effects (C), and unique environment effects (E). On the basis of adult studies (Deary et al., 2006), we predicted significant genetic effects and unique environmental effects, but nonsignificant between-families-environmental effects. In our third model, which provided direct tests of our three hypotheses, we examined whether SES moderated the effects of additive genetic effects, between-families environmental effects, or unique environmental effects.
Method
Participants
Participants were adult twins derived from a nationally representative sample of households selected by random telephone dialing (Brim, Ryff, & Kessler, 2004). All 1,702 twins for whom cognition data were available for one or both members of the twin pair were included. In total, there were 763 men (mean age = 54 years, SD = 11.4) and 939 women (mean age = 54.1 years, SD = 11.9) forming 321 monozygotic pairs and 530 dizygotic pairs. Of the monozygotic twins, 153 pairs were male and 168 were female; of the dizygotic twins, 115 pairs were male, 188 were female, and 227 were of opposite sexes. Intelligence and SES data were available for both members of 234 monozygotic pairs and 350 dizygotic pairs. All available data were analyzed with the use of full-information maximum-likelihood modeling.
Twin pairs reported their ethnicity as White (93.2%), Black (3.3%), Native American/Eskimo (1.7%), and “other” (1.8%). Among the participants, 7.9% did not complete high school, 28.2% received a high school diploma, 31.0% attended but did not complete college or university, 18.2% received an undergraduate degree, 2.9% attended but did not complete graduate school, and 11.8% received a graduate degree.
Measures
Intelligence was measured by creating a composite score from five cognitive-ability tests available in the MIDUS II data (Tun & Lachman, 2005). The five tests were (a) word-list recall (Lezak, 1995), scored as the sum of immediate- and delayed-recall items; (b) a backward-digit-span measure of working memory (Wechsler, 1997); (c) a category-fluency measure of verbal fluency (Lezak, 1995); (d) an inductive-reasoning measure of fluid intelligence (Salthouse & Prill, 1987); and (e) a backward-counting-task measure of processing speed (Salthouse, 1996). The tests showed a significant positive manifold of correlations (mean r = .34, range = .21–.48), which supports the aggregation of these scores into a single composite measure of general intelligence, consistent with the existence of a higher-order general factor underlying cognitive abilities (Deary, 2012). Given this correlation, we calculated the mean z score for all tests.
Childhood SES was assessed using the Duncan Socioeconomic Index (SEI; Duncan, 1961), which combines measures of parental income and parental employment prestige. The correlations between these two variables were .57 among mothers and .50 among fathers (both ps < .001). For each person, the SEI score was ascertained for each parent, and the mean of the normalized maternal and paternal SEI scores was taken to maximize information about social status in the family.
Analyses
The interaction of each variance component was tested in a classic Gene × Environment analysis (Purcell, 2002). In this model, the basic twin construct is preserved, and latent variables represent additive genetic effects (A), between-families environmental effects (C), and unique environmental influences (E; see Fig. 1). In addition, linear (β1) and quadratic (β2) effects of SES on intelligence means were included. The effects of SES on variance in intelligence were incorporated using individual-level data, which enabled us to place equations on paths and set definition variables with individual values for each participant. The net effect of each latent trait combined with SES is given by the sum of the direct effect (a, c, or e) and multiplicative SES interaction parameters (a′, b′, and c′) which moderate the latent genetic, between-families environmental, and unique environmental influences, respectively. Models were implemented in OpenMx (Boker et al., 2011) and R (R Development Core Team, 2013).
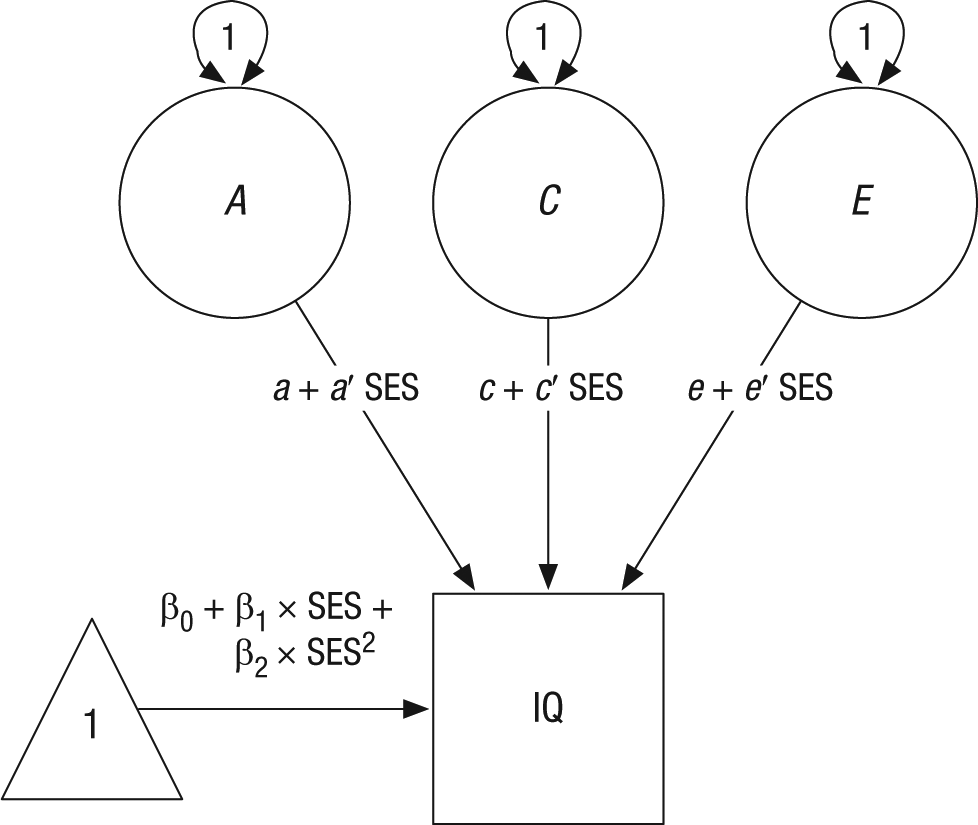
Full model showing the influence of the interaction of socioeconomic status (SES) and genetic (A), between-families environmental (C), and unique environmental (E) effects on intelligence. The net effect of each latent trait combined with SES is given by the sum of the direct effect (a, c, or e) and multiplicative SES interaction parameters (a′, b′, and c′) which moderate the latent genetic, between-families environmental, and unique environmental influences, respectively. Double-headed arrows represent variances. SES is represented by the mean of the mother’s and father’s scores on the Duncan Socioeconomic Index (Duncan, 1961) for each subject during childhood.
Effects in genetic models can be expressed as relative change (i.e., heritability as a percentage of total variance standardized at each level of SES) and as raw variance. Although an increase in heritability (relative genetic effect size) might be due to an increase in genetic influences, it is equally possible that it reflects a decrease in variance as a result of environmental effects. Because raw variance preserves this magnitude information for each component, we report all data in terms of absolute magnitudes.
Results
Childhood SEI scores ranged from 7.13 to 80.53 (M = 35.3, SD = 12.7). To avoid confounding age with twin similarities and family differences (McGue & Bouchard, 1984), and with possible cohort effects (Flynn, 2009), further analyses were conducted on intelligence scores residualized for age, age2, and sex. To test whether SES was associated with adult differences in mean intelligence, we built a linear model in which adult intelligence was the dependent variable and childhood SES was the independent variable. SES had a small but significant effect, R2 = .045, F(3, 3710) = 58.12, p < .001 (see Fig. 2).
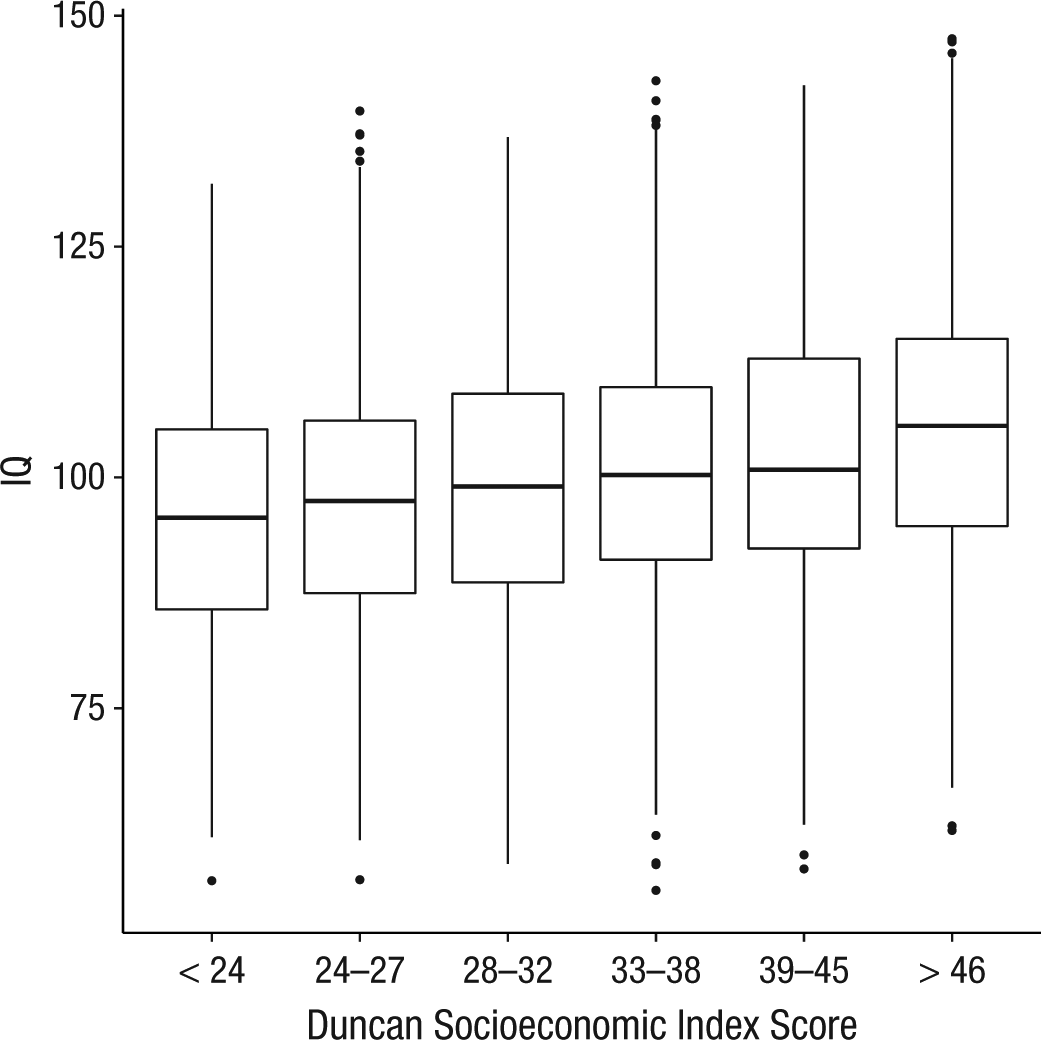
Box-and-whisker plots showing IQ as a function of Duncan Socioeconomic Index (Duncan, 1961) score separated into quantiles. For ease of interpretation, scores are scaled to a mean of 100 and SD of 15.
We next estimated additive A, C, and E effects, excluding SES interactions. To do this, we modeled the covariance of identical twins in terms of additive A, C, and E effects. The covariance for additive genetic effects was set to 1 in monozygotic twins to reflect their approximately complete genomic sharing and .5 in dizygotic twins to reflect the fact that these twins share (on average) half of their genetic material. The covariance for between-families environmental effects was set to 1 for both groups. The covariance for unique environmental effects was set to 0 among monozygotic and dizygotic pairs, because these reflect environmental and other influences, including measurement error, making family members different from each other. Monozygotic and dizygotic IQ correlations were .57 and .30, respectively. The model indicated that the average heritability, h2 = .77, 95% confidence interval (CI) = [.55, .82], and unique environmental effects, e2 = .63, 95% CI = [.57, .71], were high. By contrast, the between-families environmental effects were nonsignificant, c2 = .04, 95% CI = [−.46, .48].
We next tested the interaction of SES and A, C, and E effects to determine its influence on intelligence. Dropping A, C, and E interactions with SES significantly reduced model fit, χ2(3) = 9.31, p = .025, which indicates significant interaction effects in the data. We next tested the hypothesis that main and interaction effects of between-families environmental effects could be dropped (see Table 1, Models 3c and 3d). Setting these effects to zero had negligible effect on model fit, which is compatible with our hypothesis that Between-Families Environment × SES effects would no longer be apparent in mature adults. We next attempted to set the Unique Environment × SES interaction to zero to test the hypothesis that, in adults, unique environments assume the role that between-family environments play in children (see Table 1, Model 3e). This E × SES interaction, however, could be dropped with little loss of fit, suggesting that variation in unique environments among adults does not interact with SES to influence intelligence, χ2(1) = 0.029, p = .86. By contrast, a test of the genetic interaction with SES (see Table 1, Model 3f) indicated that Gene × SES effects were significant, χ2(1) = 9.33, p = .002.
Fit Statistics for Gene × Socioeconomic Status (SES) Model (Model 3a) and Nested Submodels
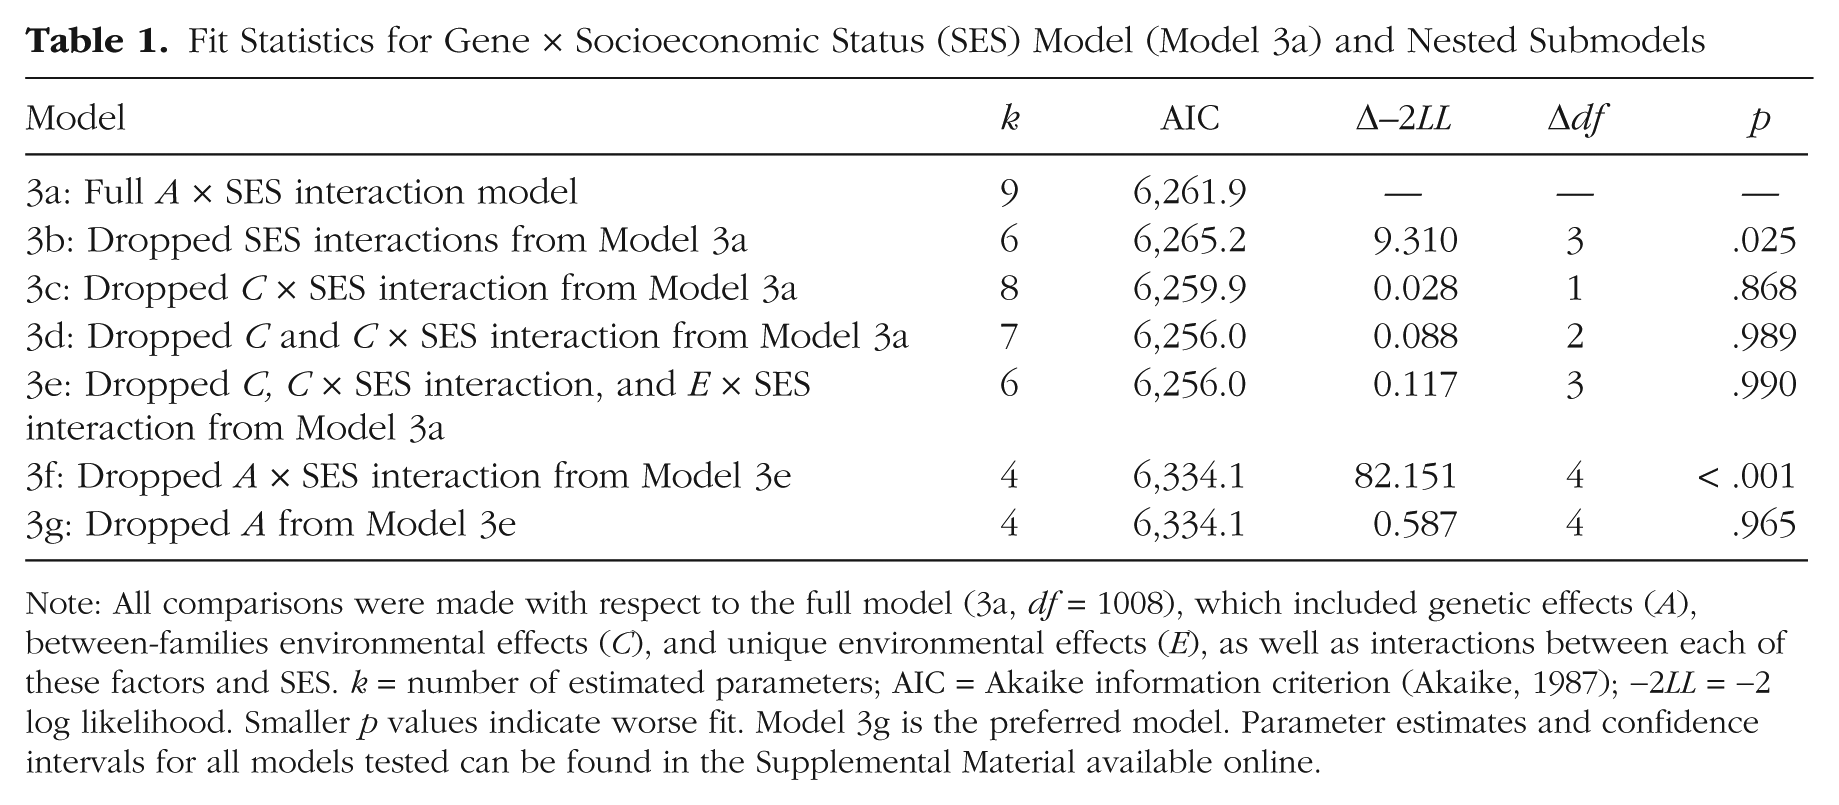
Note: All comparisons were made with respect to the full model (3a, df = 1008), which included genetic effects (A), between-families environmental effects (C), and unique environmental effects (E), as well as interactions between each of these factors and SES. k = number of estimated parameters; AIC = Akaike information criterion (Akaike, 1987); −2LL = −2 log likelihood. Smaller p values indicate worse fit. Model 3g is the preferred model. Parameter estimates and confidence intervals for all models tested can be found in the Supplemental Material available online.
Finally, we tested whether the main effect of genetic differences on intelligence could be dropped, and we found that it could be dropped without significant loss of fit (Table 1, Model 3g). In this final, preferred model, the main effect of unique environment on variance in IQ (expressed in IQ units) was 9.56, 95% CI = [8.64, 10.61], and the magnitude of the genetic interaction effect with SES was 3.19, 95% CI = [2.85, 3.51]. This suggests that genetic effects on intelligence differences act as a multiplier, translating socioeconomic resources into differences in attained cognitive ability.
Effects on variance in intelligence across SES levels are shown in Figure 3. For adults with low SES, total variance in intelligence was reduced. Higher SES was associated with increased mean ability and amplification of genetic differences. These results are compatible with observed reductions in variance among deprived groups (Kennedy, Vanderiet, & White, 1963).

Variance in intelligence as a function of childhood socioeconomic status and effect type.
Discussion
The findings reported here provide insight into how gene interactions with SES lead to differences in intelligence. Moreover, these findings speak to the timing of these interactions. First, high levels of SES amplified the effects of genes involved in adult intelligence. The difference observed in mean intelligence from the lowest SES to the highest SES groups (see Fig. 2) was accompanied by an absolute increase in the genetic intelligence variance. These results indicate that environments associated with better cognitive development are also associated with increased genetic variance, as a result of differential gains by children who have inherited alleles supporting development in these environments. This finding supports the bioecological model of intelligence, in which rich environmental support is posited to maximize genetic effects. However, these data contradict diathesis-stress (Gottesman & Shields, 1982) and reaction-range (Turkheimer & Gottesman, 1991) models. These results have implications for interventions that seek to increase cognitive ability. First, environmental improvements may be expected not only to raise all children’s ability but also to amplify individual differences (Taylor, Roehrig, Soden Hensler, Connor, & Schatschneider, 2010). Second, the finding that the Gene × SES interaction effects endured beyond the period in which family-level effects influence intelligence means that an absence of between-families environmental influences does not imply that children have “caught up” from earlier exposure to poor environments. Instead, biological development is affected in ways that last throughout life. Finally, we found no significant Between Families × SES interaction, unlike prior results from research involving children (Hanscombe et al., 2012; Tucker-Drob et al., 2011; Turkheimer et al., 2003). This is consistent with data from other studies (Harden et al., 2007) showing that between-families interactions disappear by adolescence. The conservative nature of the Gene × SES test (van der Sluis et al., 2012) implies that large samples are required to detect interactions. However, in societies in which provision of intellectual resources is universal (independent of income), the theory predicts large variance in IQ scores but no Gene × SES effects. Testing in high-welfare societies could refute this prediction.
This study is not without limitations. Assortative mating could mimic these effects. Such effects, however, have been rejected (Loehlin, Harden, & Turkheimer, 2009). In addition, because the present sample was mostly White, these effects may not generalize to other races or ethnicities. The effects of early status may be enduring. Alternatively, recurring exposure may be required to maintain differences in gene expression. Genetically informative data regarding life-span status could distinguish these alternatives (Rhemtulla & Tucker-Drob, 2012). Given the importance of maximizing cognitive development, addressing these limitations in diverse, genetically informative cohorts should be a priority (Bates & Lewis, 2012).
In conclusion, genetic effects on intelligence were compatible with a complete dependence on SES for their manifestation. Increases in mean intelligence may result from this interaction. Enhancements of social resources that raise mean ability seem also to increase individual differences.
Footnotes

References
Supplementary Material
Please find the following supplemental material available below.
For Open Access articles published under a Creative Commons License, all supplemental material carries the same license as the article it is associated with.
For non-Open Access articles published, all supplemental material carries a non-exclusive license, and permission requests for re-use of supplemental material or any part of supplemental material shall be sent directly to the copyright owner as specified in the copyright notice associated with the article.
