
Abstract
A naturalistic investigation of New Jersey residents, both before and after they experienced Hurricanes Irene and Sandy, examined support for politicians committed or opposed to policies designed to combat climate change. At Time 1, before both hurricanes, participants showed negative implicit attitudes toward a green politician, but at Time 2, after the hurricanes, participants drawn from the same cohort showed a reversed automatic preference. Moreover, those who were significantly affected by Hurricane Sandy were especially likely to implicitly prefer the green politician, and implicit attitudes were the best predictor of voting after the storms, whereas explicit climate-change beliefs was the best predictor before the storms. In concert, the results suggest that direct experience with extreme weather can increase pro-environmentalism, and further support conceptualizing affective experiences as a source of implicit attitudes.
Climate change is among the most pressing existential threats of our time, yet it is difficult for politicians to translate a growing scientific consensus into public policies. When Vice President Gore ran for U.S. president in 2000, he downplayed his interest in protecting the planet from climate change, knowing that Americans typically deny the impact of global warming, despite strong scientific evidence for it (e.g., ecoAmerica, 2011; Gallup Poll, 2010). After losing the election, Gore produced a documentary, An Inconvenient Truth, which forecast extreme weather events for the United States as a result of anthropogenic (human-caused) climate change. In 2011, Hurricane Irene caused 56 American deaths and cost $15.6 billion in damages. Fourteen months later, Hurricane Sandy was even more destructive, costing 131 American lives and at least $63 billion in damages, prompting New York City Mayor Bloomberg to declare climate change a genuine threat and to belatedly endorse President Obama in the 2012 election (Hernandez, 2012). President Obama prioritized climate-change policies during his second inaugural address, proclaiming that “some may still deny the overwhelming judgment of science, but none can avoid the devastating impact of raging fires, and crippling drought, and more powerful storms” (Stevenson & Broder, 2013).
Although extreme weather has caused some prominent politicians to embrace the reality of climate change, can it increase support among average citizens? To find out, we conducted a naturalistic investigation. In New Jersey, Rutgers University students (N = 269) were recruited in 2010 for a study that measured implicit attitudes toward politicians who were either against or committed to policies designed to combat climate change. This cohort served as our Time 1 (before the storms) sample. Immediately after Hurricane Sandy, in October 2012, a different group of Rutgers University students (N = 318) were recruited to complete the same study, with measures added to assess the personal impact of Hurricanes Irene and Sandy. Our main objective was to examine the effect of extreme weather on implicit attitudes toward, and voting for, a green politician. We also examined whether accepting the reality of anthropogenic climate change had increased at Time 2, compared with Time 1, particularly for participants personally affected by the adverse weather. Although the samples differed, they were drawn from the same population. Because Rutgers University suspended classes for a week after Hurricane Sandy, Time 2 participants at least had their daily lives disrupted. Most students were without power for a period ranging from several days to 6 weeks, many could not reach campus because of gasoline shortages, and some lost their homes. Did this inconvenience—and in some cases, adversity—create a teachable moment, spurring more favorable implicit attitudes toward a green politician or explicit belief in anthropogenic climate change?
There is evidence that at least some people rely on the local weather when reporting their beliefs about global warming (Hamilton & Stampone, 2013; Li, Johnson, & Zaval, 2011). However, this work has focused on unusually warm temperatures rather than extreme weather events. Moreover, it has relied exclusively on self-reports rather than employing implicit measures, which have the advantage of bypassing demand and reactivity, as well as limits to introspection (Rudman, 2011). The present research used the Implicit Association Test (IAT) because of its psychometric soundness (Bar-Anan & Nosek, 2012) and predictive utility (Greenwald, Poehlman, Uhlmann, & Banaji, 2009).
Because scare tactics can backfire (Witte, 1994), politicians who deploy apocalyptic global-warming messages might decrease support for green policies and belief in anthropogenic climate change (Feinberg & Willer, 2011). However, personal experiences are self-relevant, and thus far more persuasive than messages (Eagly & Chaiken, 1993). Citing the disparity between Americans’ reactions to terrorism after September 11, 2001, and their indifference to climate change, Sunstein (2007) argued that perhaps a “salient” weather-related incident would improve the political will. Indeed, direct experiences are effective catalysts for changing even people’s implicit (i.e., automatic) attitudes, provided the experiences are meaningful. For example, implicit racial and gender biases can be reduced when people bond with atypical role models (Rudman, Ashmore, & Gary, 2001; Young, Rudman, & Buettner, 2013). Implicit attitudes are thought to have a basis in affective experiences, so the best way to change such attitudes may be through emotional reconditioning (Rudman, 2004; Rudman et al., 2001). Indeed, when people are instructed to report their attitudes using their “gut-level feelings,” the correspondence between implicit and explicit attitudes increases, compared with when they receive no such instructions (Ranganath, Smith, & Nosek, 2008). The fact that convergence of implicit and explicit attitudes improves when people base their reported attitudes on feelings further suggests that affect is a prominent source for implicit attitudes, whereas people may usually be more objective when they report their opinions.
This line of reasoning led us to test four hypotheses:
Hypothesis 1: Time 2 participants would show more implicit liking of a green politician than would Time 1 participants.
Hypothesis 2: At Time 2, participants who had been more negatively affected by the extreme weather would show more implicit liking of a green politician.
Hypothesis 3: The correspondence between implicit attitudes and explicit voting for green politicians would increase at Time 2, compared with Time 1.
Hypothesis 4: Compared with Time 1 participants, Time 2 participants would show increased acceptance that anthropogenic climate change is real, particularly if they had been negatively affected by the extreme weather.
Support for these predictions would be consistent with the overarching hypothesis that people can be altered fundamentally (i.e., even implicitly) by direct experience with life-threatening weather. It would also bolster the idea that affective experiences can be a means of changing implicit attitudes (e.g., Rudman, 2004; Rudman et al., 2001).
Method
Participants
Participants were introductory-psychology students who received credit toward their mandatory experiment requirement. Three Time 1 participants and 5 Time 2 participants were excluded for making more than 25% errors on the IAT. The first group participated before the storms, in October 2010 (N = 269; 126 men, 143 women); the second group participated immediately after Hurricane Sandy, in October 2012 (N = 318; 164 men, 154 women), 14 months after Hurricane Irene (in August 2011). At Time 1, 116 of the participants (43%) were White, 69 (26%) were Asian, 28 (10%) were Hispanic, 26 (10%) were Black, 17 (6%) were biracial, and 13 (5%) indicated another ethnicity. At Time 2, 119 of the participants (37%) were White, 105 (33%) were Asian, 37 (12%) were Hispanic, 20 (6%) were Black, 22 (7%) were biracial, and 15 (5%) indicated another ethnicity. The racial and gender composition, age, and political orientation of the two samples were similar (see Preliminary Analyses).
Measures
The candidate IAT
To measure implicit attitudes, we used the candidate IAT. Participants read about two politicians, one described as supportive of policies designed to combat climate change and the other described as opposed to such policies. Participants then categorized the candidates’ names (Peter, Holloway, Peter Holloway vs. Paul, Copeland, Paul Copeland) with adjectives referring to good and bad traits (good, honest, fair, likable, intelligent, attractive vs. bad, awful, terrible, harmful, annoying, disgusting). In some trial blocks, the same response key was used for Peter Holloway and good adjectives and a different key was used for Paul Copeland and bad adjectives, whereas in other trial blocks, the same response key was used for Peter Holloway and bad adjectives and a different key was used for Paul Copeland and good adjectives. The order in which these blocks were presented was counterbalanced, a procedural variable that did not influence results. At Time 1, we counterbalanced which name was associated with green policies, but because this had no effect on results, Peter Holloway was always the green candidate at Time 2.
The IAT effect was measured by the difference in response latencies when the task associated Peter Holloway with good (and Paul Copeland with bad) and when the task associated Peter Holloway with bad (and Paul Copeland with good). Scores were calculated such that higher scores indicate more favorable implicit attitudes toward the green candidate. We followed recommended procedures for calculating the D statistic (which standardizes the IAT effect separately for each individual; Greenwald, Nosek, & Banaji, 2003). The IAT has been successfully used to measure attitudes toward novel targets in past research (e.g., Petty, Tormala, Briñol, & Jarvis, 2006; Rydell & McConnell, 2006).
Explicit measures
A forced-choice measure obliged participants to vote for either Paul Copeland or Peter Holloway.
To assess beliefs about anthropogenic climate threat, we used the New Environmental Paradigm (NEP; Dunlap, Van Liere, Mertig, & Jones, 2000), which consists of 15 items rated on a scale ranging from 1 (strongly disagree) to 6 (strongly agree). Sample items are, “When humans interfere with nature it often produces disastrous consequences,” “Humans are severely abusing the environment,” and “The so-called climate change threat facing humankind has been greatly exaggerated” (reverse-scored). Responses were averaged (α = .76).
At Time 2 only, participants were asked, “How badly were you impacted negatively by Hurricane Sandy?” The response scale ranged from 1 (not at all) to 5 (terribly). The question was repeated for Hurricane Irene. Ratings on the two items were modestly related, r(316) = .20, p < .001.
Procedure
All measures were administered using a computer program that randomized the order of items within each measure. Time 1 participants completed the study in the laboratory, and Time 2 participants completed the study online immediately following Hurricane Sandy. At Time 2, we counterbalanced whether participants responded to the storm-impact variables before or after completing the dependent measures, a procedural variable that did not affect results.
For the candidate IAT, all participants first read about two senatorial candidates, Peter Holloway and Paul Copeland, described as 45-year-old White men who had law degrees and were similar in every respect except for their support for environmental policies. In the condition in which Holloway was the green candidate, participants read the following:
Peter Holloway is in favor of the government taking action to protect against climate change, even though it may increase energy costs for consumers or reduce individual freedom. Paul Copeland is against them. Specifically, Peter Holloway is in favor of: (1) Encouraging more use of public transportation by raising the cost of using a private car (e.g., by raising fuel costs); (2) Promoting greater use of renewable energy like solar in the generation of electricity, even if it means higher prices for everyone; (3) Developing more energy efficiency in housing by setting higher building standards even if it raises the cost of housing; (4) Mandating the use of offshore windmills even if they interfere with coastal views; and (5) Only allowing homeowners who lose their houses due to increased sea levels to build again on flood plains.
When Copeland was the green candidate, participants read the same text but with the names reversed. Participants were told to study the list of policies carefully because their memory for the information would be tested later. In fact, only their memory for which candidate was the green politician was tested (all participants remembered this correctly).
After reading the description of the candidates, participants completed the candidate IAT. They then reported whether they would vote for Peter Holloway or Paul Copeland. Afterward, they completed the NEP and storm-impact questions (with the exception that half of the Time 2 participants completed the storm-impact measures first, prior to completing any other measures), followed by demographic measures (gender, race, and political ideology), which were always last. Political ideology was rated on a scale ranging from 1 (extremely conservative) to 7 (extremely liberal). Female gender and liberalism have been linked to belief in anthropogenic climate change in the past (for a review, see Feinberg & Willer, 2013). Participants were subsequently fully debriefed and compensated.
Results
Preliminary analyses
Participants reported similar levels of liberalism at Time 1 (M = 4.33, SD = 1.35) and Time 2 (M = 4.46, SD = 1.37), t(584) = 1.49, p = .28. Age at Time 1 (M = 18.73 years, SD = 1.50) and age at Time 2 (M = 18.90 years, SD = 1.06) were comparable, t(585) = 1.60, p = .11. No significant differences emerged between the samples for either gender composition, χ2(1, N = 587) = 1.36, p = .25, or racial composition, χ2(6, N = 587) = 10.54, p = .10.
Support for the politicians
The candidate IAT
Hypothesis 1 predicted greater liking for the green candidate after the storms, compared with before. On the candidate IAT, Time 1 participants preferred the traditional over the green politician, D = −0.20 (SD = 0.38), t(268) = −8.57, p < .001, whereas in a reversal, Time 2 participants preferred the green candidate, D = 0.22 (SD = 0.41), t(317) = 9.69, p < .001. The difference between the two samples was robust, t(585) = 12.83, p < .001, d = 0.93. As expected, automatic attitudes toward a climate-protecting politician were more favorable after the storms, compared with before.
Hypothesis 2 predicted that being personally affected by the extreme weather would encourage implicit liking of the green candidate among Time 2 participants (i.e., that the difference between Time 1 and Time 2 implicit attitudes was not merely a reflection of sample differences). Preliminary analysis excluded participant’s gender and liberalism as significant covariates, both ps > .30. We then regressed the candidate IAT scores on mean-centered predictor variables: Sandy’s impact, Irene’s impact, and their interaction. Results showed only a main effect for Sandy’s impact, β = 0.12, p < .05. Irene’s impact was weakly negative, β = −0.10, p = .08, and the Irene × Sandy interaction term was negligible, β = 0.05, p = .38. A paired-samples t test showed that Sandy (M = 2.69, SD = 0.94) affected participants more negatively than Irene (M = 1.84, SD = 0.95), t(317) = 12.76, p < .001, d = 0.71. Therefore, Sandy’s stronger impact on participants or this storm’s relative recency (or both) might explain why only Sandy’s impact, and not Irene’s, influenced the candidate IAT scores.
Voting choice
The percentage of participants who voted for the green candidate did not change significantly between Time 1 (69%) and Time 2 (67%), χ2 < 1.00, n.s. Hypothesis 3 predicted that implicit attitudes would be a better predictor of voting for a green candidate at Time 2 than at Time 1. Logistic regressions showed that candidate IAT scores did not predict the forced-choice voting measure prior to the storms, χ2(1, N = 269) = 1.97, p = .16, whereas IAT scores did predict voting choice following the storms, χ2(1, N = 318) = 7.27, p < .007.
In addition, the correlation between candidate IAT and NEP scores was negative at Time 1, r(267) = −.10, p = .09, but positive at Time 2, r(316) = .14, p = .01, and the difference was significant, z = 2.88, p < .01. This further supports the idea that convergence of implicit and explicit attitudes increases when participants base their explicit responses on affect (Ranganath et al., 2008)—in this case, in the wake of threatening weather.
Climate-change beliefs
If experiencing extreme weather influences beliefs about anthropogenic climate change, NEP scores should have been higher at Time 2 than at Time 1, and indeed they were (Time 2: M = 4.30, SD = 0.77; Time 1: M = 4.12, SD = 0.73), t(585) = 2.93, p = .004, d = 0.24. Thus, the data supported Hypothesis 4. Because we could not ask about the storms at Time 1 (they had not yet happened), their impact could not have mediated this difference. However, Hypothesis 4 further predicted that Time 2 participants would be particularly likely to show increased acceptance of anthropogenic climate change if they had been negatively affected by the extreme weather. We therefore regressed Time 2 NEP scores on Sandy’s impact, Irene’s impact, and their interaction, as well as on participant’s liberalism (all predictor variables were mean centered; preliminary analyses ruled out any effect of participant’s gender, so this was not included as a covariate). Results showed a main effect for liberalism, β = 0.20, p < .001, and an unexpected negative main effect for Irene’s impact, β = −0.13, p = .03. These results were qualified by an interaction of Sandy’s and Irene’s impacts, β = 0.11, p = .05.
To probe the interaction, we followed Aiken and West’s (1991) procedure. As Figure 1 shows, participants who were strongly negatively affected by the first storm (Irene) had higher NEP scores to the extent that they were also affected by the second storm (Sandy), β = 0.18, p = .03. In contrast, among participants who were not affected by Irene, Sandy’s impact had virtually no effect on NEP scores, β = −0.04, p = .56; for these participants, NEP scores were relatively high regardless of Sandy’s impact. Thus, it appears that being affected by only Irene (not Sandy) resulted in decreased NEP scores. Consequently, Hypothesis 4 was not fully supported. We return to this finding in the Discussion section.

New Environmental Paradigm (NEP; Dunlap, Van Liere, Mertig, & Jones, 2000) score at Time 2 as a function of the impact of Hurricane Sandy and of Hurricane Irene (high = 1 SD above the mean; low = 1 SD below the mean).
Incremental validity
Finally, to test the incremental validity of our measures, we logistically regressed voting for a green politician on gender, liberalism, NEP score, and candidate IAT score at both Time 1 and Time 2. Table 1 shows the results. At Time 1, only liberalism and NEP score were significant predictors. At Time 2, only candidate IAT score was a significant predictor; liberalism and NEP score were marginally significant. Thus, even though belief in anthropogenic climate change was higher after the storms, only Hurricane Sandy’s impact on candidate IAT scores was a significant predictor of voting choice.
Results of the Logistic Regression Analysis Predicting Voting for the Green Politician at Time 1 and Time 2
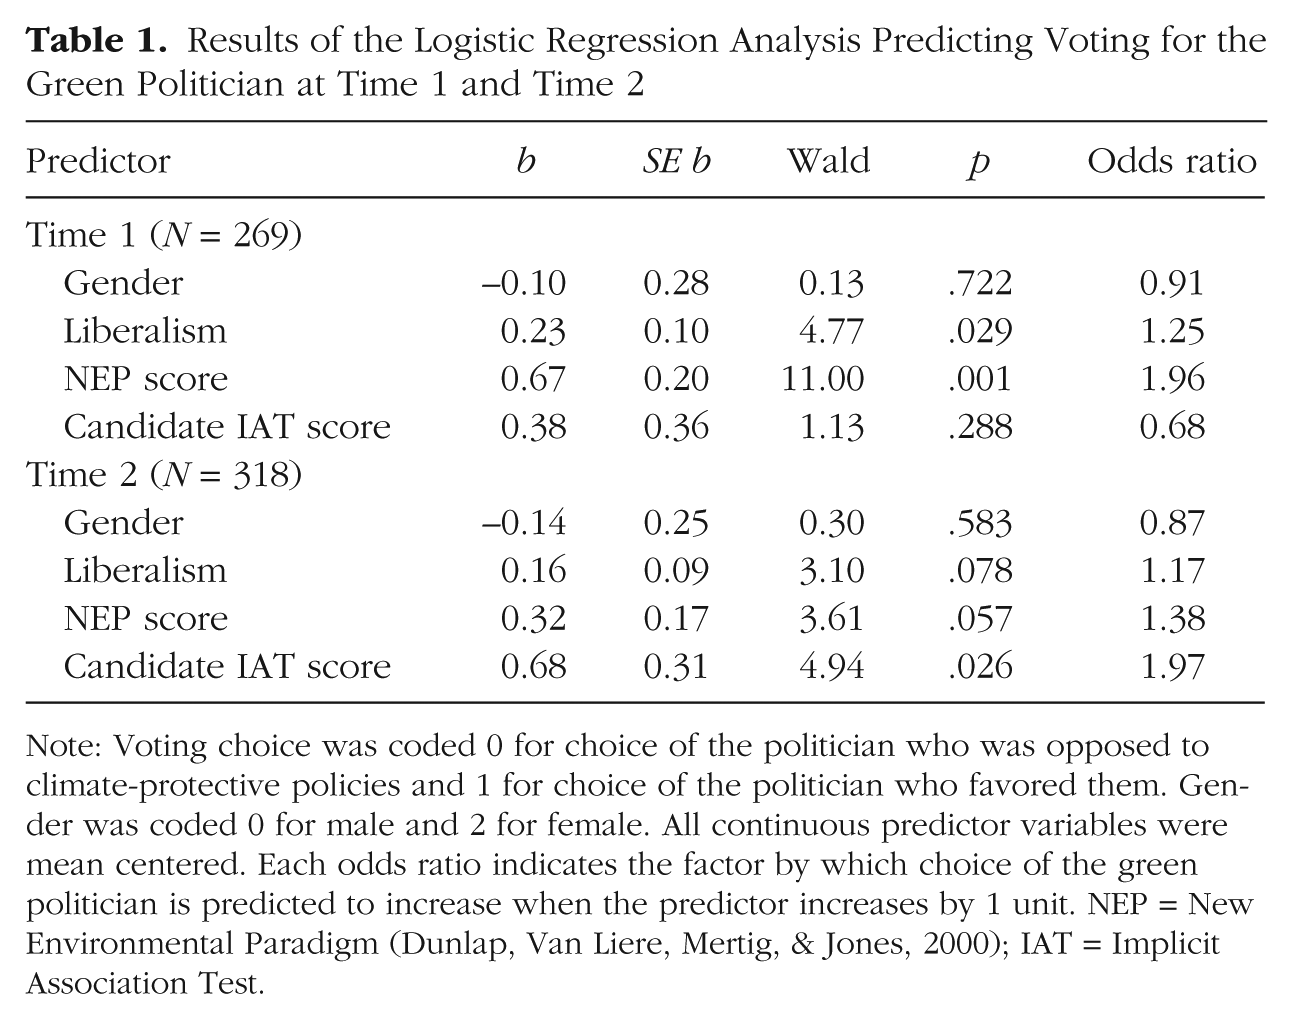
Note: Voting choice was coded 0 for choice of the politician who was opposed to climate-protective policies and 1 for choice of the politician who favored them. Gender was coded 0 for male and 2 for female. All continuous predictor variables were mean centered. Each odds ratio indicates the factor by which choice of the green politician is predicted to increase when the predictor increases by 1 unit. NEP = New Environmental Paradigm (Dunlap, Van Liere, Mertig, & Jones, 2000); IAT = Implicit Association Test.
Discussion
Although implicit attitudes have been conceptualized as more durable than explicit attitudes (Wilson, Lindsey, & Schooler, 2000), plausibly because people are often unaware that they possess implicit attitudes (Greenwald & Banaji, 1995), the present research is consistent with the hypothesis that implicit attitudes can be altered as a result of a powerful, affective experience—in this case, extreme weather. Prior to the storms, participants automatically favored a politician opposed to climate-protective policies, whereas immediately after Hurricane Sandy, participants drawn from the same population favored a green politician. Moreover, the data suggested that this reversal was not entirely due to sample differences; rather, we found evidence that people’s implicit attitudes were affected by the storms. First, at Time 2, implicit attitudes favored the green politician particularly among participants who had been personally affected by Hurricane Sandy. Second, implicit attitudes were a better predictor of voting for a green politician after the storms, compared with before; in fact, they were the only significant predictor of voting choice at Time 2. Third, candidate IAT scores were better correlated with belief in anthropogenic climate change after the storms, compared with before. In concert, the findings suggest that people who have recently suffered adverse weather are more likely than those who have not to rely on their gut feelings when they explicitly vote for politicians or report their climate-change beliefs (Ranganath et al., 2008). As a result, this study further supports emotional reconditioning as a potent means of changing implicit attitudes (Rudman, 2004; Rudman et al., 2001).
The fact that only Hurricane Sandy’s (not Irene’s) impact moderated implicit attitudes at Time 2 might suggest that the availability heuristic (Tversky & Kahneman, 1973) was more responsible for the change in implicit attitudes than emotional reconditioning was (Rudman et al., 2001). However, Sandy generated an enormous amount of publicity, replete with graphic images of the storm’s devastation; therefore, if the availability heuristic was responsible, personal adversity should not have influenced Time 2 participants’ candidate IAT scores. Nonetheless, the availability heuristic might help to explain why belief in anthropogenic climate change was stronger in the Time 2 sample, compared with the Time 1 sample, and was uniformly high except for participants who were strongly negatively affected by Irene but not Sandy. People who escaped a second round of adversity may have “let their guard down” either because they felt elated to have escaped Sandy (Shepperd & McNulty, 2002) or because optimistic biases tend to return following a natural disaster (Burger & Palmer, 1992). Either of these mechanisms might help to explain why Irene’s impact had unexpected negative main effects on both implicit attitudes (albeit a marginal effect) and climate-change beliefs. For participants unaffected by either storm, public attention to both disasters may have been persuasive, at least immediately after Sandy, whereas those who suffered twice may have been more firmly convinced than those who were affected only in the past. In other words, the relatively high NEP scores at Time 2 likely had different sources for different people.
Indeed, direct experience with extreme weather was not likely the sole basis for implicit attitudes toward the candidates at Time 2. It is possible that media attention to both storms was effective, persuading at least some people over time (Dunwoody, 2007). Local politicians’ acknowledgment of climate change after Hurricane Sandy was also well covered by the media, and President Obama’s visit to New Jersey and Governor Christie’s praise of his leadership may also have played a role, given that people can have more intentions to protect the environment when doing so is framed as patriotic (Feygina, Jost, & Goldsmith, 2010). Thus, there may be multiple reasons why responses to our measures differed across time, and future research should determine what they are.
Obviously, a longitudinal study would be preferable and is a goal for future research. Moreover, it is unclear whether even extreme weather would influence people who are more conservative in their ideology than undergraduates, who might have been more receptive to a teachable moment (Hamilton & Stampone, 2013; Sunstein, 2007). The fact that the majority of our participants voted for a green politician both before and after the storms suggests that our samples were skewed toward the liberal side of the political spectrum.
Nonetheless, most people’s “exposure to and experience of ‘climate change’ has been almost entirely indirect and virtual” (Swim et al., 2009, p. 34), which can hinder persuasion. Because of public indifference and denial, it is difficult for U.S. leaders to do the essential work of combating the existential threat of climate change (Feygina et al., 2010; McKee & Diethelm, 2010). The present research suggests that people can be convinced of the necessity to support politicians who endorse climate-protective policies provided they have direct experience with the adverse consequences of climate change.
Footnotes
Declaration of Conflicting Interests
The authors declared that they had no conflicts of interest with respect to their authorship or the publication of this article.
Funding
Data collection at Time 1 was partially supported by a grant from the New Jersey Public Utilities Board. Additional research was supported by Grant BCS-1122522 from the National Science Foundation.