
Abstract
Using a technique known as reverse-correlation image classification, we demonstrated that the face of Mitt Romney as represented in people’s minds varies as a function of their attitudes toward Mitt Romney. Our findings provide evidence that attitudes bias how people see something as concrete and well learned as the face of a political candidate during an election. Practically, our findings imply that citizens may not merely interpret political information about a candidate to fit their opinion, but also may construct a political world in which they literally see candidates differently.
Do Karl Rove and Arianna Huffington picture the same Mitt Romney? Do Republicans and Democrats have the same idea of what Romney’s face looks like? It is easy to understand how people’s political views could bias their judgments of a candidate. However, one might expect that the mental image of something as concrete and well known as a presidential candidate’s face during an election season, a time during which that face is repeatedly presented to both Republicans and Democrats ad nauseam, would be a veridical representation free of bias. We provide evidence, using a technique known as reverse-correlation image classification, that in the swing state of Ohio during the 2012 presidential election, Mitt Romney’s physical face in the minds of Republicans was different from his face in the minds of Democrats.
In the pivotal battleground state of Ohio, the Democratic and Republican presidential campaigns spent a combined $150 million on television advertising between April 11 and November 14, 2012—the third-highest amount in the country (Andrews, Keating, & Yourish, 2012). The city of Columbus, in particular, was inundated with almost 40,000 ads in that time, which prompted Katz (2012), a writer for the New York Daily News, to remark, “If you live in Ohio, good luck trying to tune out the election” (para. 1). In the midst of this commercial-heavy campaign season, people were saturated with images of each candidate. As a result, in November 2012, residents of Columbus should have developed well-learned representations of each candidate’s physical appearance.
Could one’s mental representation of something as frequently presented and well known as a presidential candidate’s face during an election month in a swing state be biased as a function of one’s attitudes? Attitudes have been shown to bias the construal of objects and events (e.g., Fazio & Williams, 1986; Hastorf & Cantril, 1954; Lord, Ross, & Lepper, 1979). However, in most cases, these objects and events are relatively ambiguous. A rough football tackle could be an infraction or not (Hastorf & Cantril, 1954). A tennis shot close to the baseline could be in or out (Fazio, Roskos-Ewoldsen, & Powell, 1994). What about less ambiguous objects? Recently, Caruso, Mead, and Balcetis (2009) found that partisanship predicted whether people rated an image with artificially darkened skin as better representing Barack Obama than his actual image. If attitudes can bias the mental representation of skin tone, might they even influence the representation of a specific face? Perhaps they cannot, given that faces attract more perceptual attention than other objects (Birmingham & Kingstone, 2009; Yarbus, 1967). Furthermore, during an intense campaign in which people were flooded with images of Romney, representations of his face should have been particularly clear. Finally, although partisanship may affect construals along a single dimension (skin darkness), presumably as a consequence of the greater negativity associated with darker skin tone, political attitudes may not be powerful enough to bias multidimensional facial representations and the extent to which they actually appear more or less appealing.
In the experiment reported here, we tested the potential influence of attitudes by first assessing what Romney’s face looked like in the minds of Ohio State undergraduates using a technique known as reverse-correlation image classification. This data-driven method uses participants’ classification of stimuli to obtain an “approximation of participants’ subjective internal representation” (Todorov, Dotsch, Wigboldus, & Said, 2011, p. 779) of a given face, which allowed us to peer into the minds of participants and see what Romney looked like to them. This method has been used previously to relate a person’s prejudice regarding a social group (Moroccans) to the criminality and trustworthiness ascribed to that person’s mental representation of a prototypical member of the group (Dotsch, Wigboldus, Langner, & van Knippenberg, 2008). We sought to build on this finding by examining whether a person’s memory regarding the face of a specific, well-learned individual (Romney) might relate to the person’s attitudes toward that individual. After estimates of participants’ mental representations of Romney’s face were generated, they were rated by judges so we could assess whether they varied in a systematic and meaningful way.
The two variables on which we hypothesized these generated faces would vary were overall positivity and trustworthiness. Trustworthiness was one characteristic of Mitt Romney that was called into question during the election (Moody, 2012). An October 31, 2012, Quinnipiac poll (Quinnipiac University Polling Institute, 2012) showed that although Ohio voters were about as likely (if not more so) to think that Romney was competent as they were to think that Obama was (64% of respondents thought Romney had strong leadership qualities; 58% thought Obama did), they were less likely to think that Romney was trustworthy than that Obama was (45% thought Romney was honest and trustworthy; 54% thought Obama was). It was particularly relevant, then, to investigate whether representations of Romney’s face might look more or less trustworthy depending on participants’ level of support for him.
We hypothesized that the mental representations of the face of Romney in the minds of participants who supported him and voted for him would look (a) more trustworthy and (b) more positive overall than his face in the minds of detractors.
Method
Our method, based on that used by Dotsch et al. (2008), consisted of two phases. In the first phase, participants completed a face-classification task, the goal of which was to allow us to estimate each participant’s mental representation of Mitt Romney using the reverse-correlation image-classification method. These participants then completed items that assessed their support for Romney, their voting intentions or behavior, and their political orientation. In the second phase, separate samples of independent judges rated the images of Romney that had been generated in Phase 1. These ratings allowed us to objectively determine whether mental representations of Romney’s face differed meaningfully between supporters and nonsupporters.
Participants
Phase 1 participants (N = 148; 87 men, 61 women) were undergraduates at The Ohio State University in Columbus, Ohio. They were given course credit for participation. Data were collected directly before (November 1–5) and directly after (November 13–28) the 2012 presidential election, which took place on November 6.
Phase 2 participants (N = 213; 131 men, 82 women; mean age = 31.61 years, range = 18–69) were three samples (n = 70, n = 72, and n = 71) of adults from Amazon’s Mechanical Turk (MTurk) Web site who rated pairs of averaged photos of Romney. These participants, naive to how the faces were generated, were paid between 25¢ and 50¢ for 5 min of their time. Nine additional volunteers (2 men, 7 women) rated all 148 images generated by the Phase 1 participants.
Stimuli for the face-classification task
All face stimuli for Phase 1 were generated from the same base image—a photograph of Romney selected from an online search. In the photograph, Romney is facing forward, and his expression is neutral. The image was converted to gray scale and cropped so that it showed only Romney’s face. To change the appearance of his face on a given trial, we superimposed noise patterns on the 256- × 256-pixel image, slightly altering the look of his facial features (see Fig. 1). The noise patterns consisted of 4,092 superimposed truncated sinusoid patches. Each individual patch spanned two cycles of a sine wave. Patches in six orientations (0°, 30°, 60°, 90°, 120°, and 150°), two phases (0 and π/2), and five spatial frequencies (1, 2, 4, 8, and 16 patches per image), with random contrasts (amplitudes), were summed to create each of the 450 noise patterns we used. (For a more complete description of patch creation, see Mangini & Biederman, 2001.)

An example of the face stimuli used in the face-classification task. For 450 image pairs, participants selected which of the two images looked more like Mitt Romney.
Procedure: Phase 1
Face-classification task
We informed Phase 1 participants that the goal of the study was to see how well people identify the faces of well-known individuals. Specifically, we told them we wanted to see how accurately they could identify which image in a pair of images looked more like Mitt Romney. Participants then completed 450 trials. In each trial, a pair of photographs of Romney appeared on a computer monitor, one picture on the left and one on the right. Participants pressed a key on a computer keyboard to indicate which photograph looked more like Romney. One of the two photographs consisted of a random-noise pattern superimposed over the base face, and the other consisted of that noise pattern’s inverse superimposed over the base face. The side on which the inverse-noise image appeared was counterbalanced across trials. All participants were presented with the same noise patterns. Trial order was randomized.
Attitude assessments
After the face-classification task, participants completed a series of items assessing their support for Romney, voting intentions or behavior, and political orientation.
Support for Romney was a component score based on 14 items, 6 of which assessed agreement with Romney’s position on various policy issues (e.g., “To what extent do you agree with Mitt Romney’s position on jobs?”). Four items assessed participants’ opinions regarding Romney’s leadership qualities (e.g., “To what extent do you think Mitt Romney is a strong leader?”). The final 4 items assessed emotions evoked by Romney (e.g., “To what extent does Mitt Romney make you feel hopeful?”). Participants responded to all items on a 6-point scale (1 = not at all, 6 = very much). In a parallel set of filler items, Obama was the target. Because the reliability of the 14 Romney items was high (α = .94), we generated a component score for each participant based on a principal components analysis in which one factor was retained (eigenvalue = 9.18, variance explained = 65.55%, next-highest eigenvalue = 1.26). This score indexed participants’ overall support for Romney.
Voting intentions or behavior was assessed slightly differently depending on whether participants completed the tasks before or after the election. Before the election, participants responded to two items, indicating the likelihood that they would vote for Mitt Romney and the likelihood that they would vote for Barack Obama if they were to vote that day. Participants responded using a 7-point scale (1 = not at all likely, 7 = very likely). We calculated a difference score between their likelihood of voting for Romney and their likelihood of voting for Obama (pro-Romney if greater than zero, pro-Obama if less than zero). Nine participants were excluded from analyses involving this variable because they did not indicate a clear voting intention. Participants who completed the task after the election responded to a single item: “Who did you vote for in the presidential election?” Participants’ options were “Barack Obama,” “Mitt Romney,” and “a third-party candidate.” Analyses based on this item omitted participants who did not vote (n = 24) or who voted for a third-party candidate (n = 1).
We assessed political orientation using four items that asked participants the extent to which they were described by the following political ideology labels: Democrat, liberal, Republican, and conservative. Participants responded on a 7-point scale (1 = weak, 7 = strong) but also had a “not applicable” option. We averaged the scores for the Democrat and liberal labels and subtracted them from the average scores for the Republican and conservative labels.
Assessing participants’ mental representations of Mitt Romney’s face
To generate estimates of each participant’s mental representation of Romney’s face, we used reverse-correlation data-reduction techniques. In doing so, we assumed that, on each trial, participants matched their mental image of the target to the two faces presented on the screen, and they chose the face that most closely resembled that image. Past research has demonstrated that by averaging over several hundred trials, this method can provide an estimate of a person’s mental representation of a target object (Dotsch et al., 2008; Mangini & Biederman, 2004).
We generated both participant-level and group-level face estimates. To generate participant-level images, we averaged all 450 noise patterns selected by a given participant and then superimposed that average over the original base photograph of Romney. This provided an estimate of each participant’s mental representation of Romney’s face (148 representations in all, 1 per participant). Group-level images provided estimates of Romney’s face for subgroups of participants. The average noise patterns for people who belonged to a specific category (e.g., all Republican participants) were averaged together and superimposed over the original base photograph. These images provided estimates not of the mental representation of Romney in the minds of individual participants, but in the minds of groups of like-minded people.
The specific variables we grouped people by were (a) support for Romney, as indexed by the component score described earlier; (b) voting intentions or behavior; and (c) political orientation. We generated a total of 12 group-level images. Two of the support-for-Romney group-level images were averages of the average noise patterns of preelection participants who showed high support (≥ +1 SD; n = 15) and low support (< −1 SD; n = 15) for Romney, and two were averages for postelection participants who showed high (n = 15) and low (n = 17) support for Romney. Two of the voting-intentions-or-behavior group-level images were averages of the average noise patterns of preelection participants who were more likely to vote for Romney (n = 29) and of preelection participants who were more likely to vote for Obama (n = 31); another two were averages of the average noise patterns of postelection participants who did vote for Romney (N = 21) and of postelection participants who did vote for Obama (n = 32). Finally, two political-orientation group-level images were averages of the average noise patterns of preelection participants who considered themselves to be more Republican (n = 23) and of preelection participants who considered themselves to be more Democrat (n = 26); another two images were averages of the average noise patterns of postelection participants who considered themselves more Republican (n = 26) and of postelection participants who considered themselves more Democrat (n = 37). Participants were classified as more Republican versus more Democrat based on a difference score.
Procedure: Phase 2
This phase focused on indexing whether participants’ mental representations of Mitt Romney’s face were biased according to their attitudes toward the candidate. Judges rated either the participant- or the group-level Romney faces on various dimensions.
Ratings of participant-level estimates
Nine volunteers rated the trustworthiness of the images representing each Phase 1 participant’s mental representation of Romney’s face (n = 148). Ratings were made on an 8-point scale (0 = not at all trustworthy, 7 = extremely trustworthy).
Ratings of group-level estimates
The group-level images were presented to three separate participant samples on MTurk. MTurk has been shown to provide data with quality and reliability similar to that of data collected in a controlled laboratory environment (Buhrmester, Kwang, & Gosling, 2011; Paolacci, Chandler, & Ipeirotis, 2010). They saw a given pair of images, one on the left and one on the right (counterbalanced), and they were asked to indicate in which of the two photographs Romney looked more trustworthy, competent, and caring. Participants responded on 6-point continua (anchors were looks much more trustworthy/competent/caring in the photo on the left and looks much more trustworthy/competent/caring in the photo on the right). The order of these three ratings was counterbalanced. For the final item, we asked participants to make a global judgment (“Overall, in which image does Mitt Romney look better?”). The 6-point response scale ranged from Mitt Romney looks much better in the left image to Mitt Romney looks much better in the right image.
Results
We first report correlations between the participant variables (support for Romney, voting intentions or behavior, and political orientation) and the judged trustworthiness of individual participants’ mental representations of Romney. We then report differences between the average representations of the candidate in the eyes of certain participant groups (high support vs. low support, intended to vote or voted for Romney vs. Obama, more Republican vs. more Democrat). See Pre- vs. Postelection Factor in the Supplemental Material available online for additional analyses demonstrating that there was no effect of participation before versus after the election.
Predicting the trustworthiness of participant-level estimates
Phase 1 participants’ support for Romney was significantly correlated with the judged trustworthiness of their mental representation of Romney, r(147) = .23, p = .006; the more participants supported the candidate, the more trustworthy their mental representation of him appeared to be. This correlation (and all following analyses) excluded 1 participant as an outlier but remained significant when we included that outlier, r(148) = .16, p = .025. See Figure 2 for a scatter plot of this correlation.
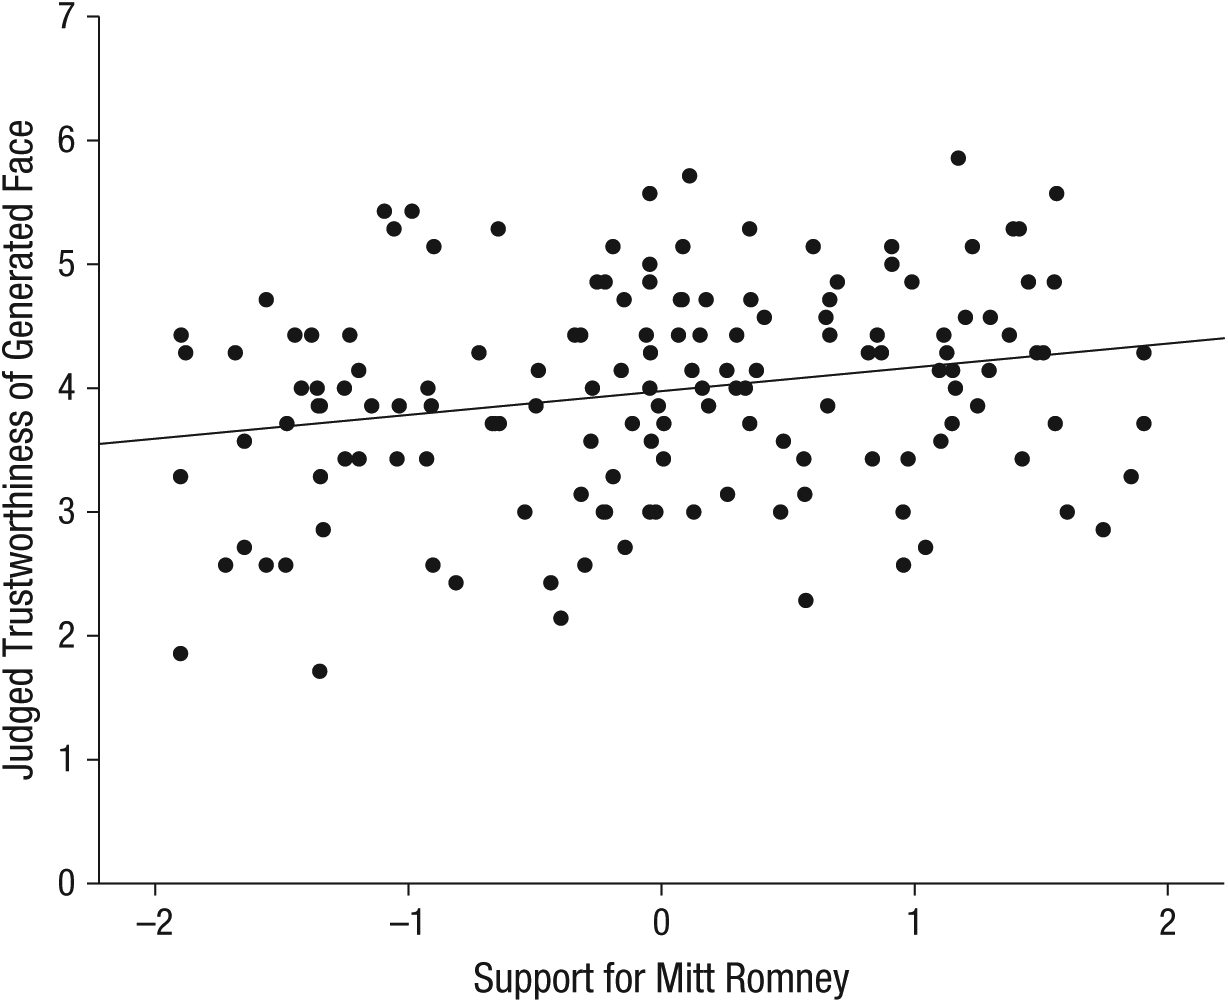
Scatter plot (with best-fitting regression line) showing judged trustworthiness of the image generated by each participant as a function of that participant’s support for Mitt Romney (as indexed by a component score based on a series of items).
We analyzed whether participants who said they would vote or actually voted for Romney generated a more trustworthy-looking image than those who said they would vote or actually voted for Obama. This analysis excluded 33 participants who had no preference, did not vote, or voted for a third-party candidate. Participants who said they would vote or voted for Romney generated a more trustworthy-looking image (M = 4.24) than did participants who said they would vote or voted for Obama (M = 3.77), t(111) = 2.90, p = .004.
Finally, we correlated participants’ political orientation (excluding 12 participants who were independent or who did not indicate a clear political orientation) with the judged trustworthiness of their representation of Romney. This correlation was significant, r(136) = .28, p = .001; the more politically right participants reported they were, the more trustworthy their mental representation of Romney appeared to be.
The Supplemental Material includes analyses conducted at the level of the individual rater, which revealed the same effects as reported here. Also included are details of a multiple regression showing that all three predictors—support, voting intentions or behavior, and political orientation—together accounted for a significant proportion of the variance, R2 = .09, F(3, 103) = 3.44, p = .02, although none did so uniquely.
Group-level differences
Seventy-one MTurk participants rated the support-for-Romney group-level images for the two groups with high support (preelection: n = 15; postelection: n = 15) and the two groups with low support for Romney (preelection: n = 15; postelection: n = 17). Responses on the four 6-point items (trustworthiness, caring, competence, and overall judgment) were recoded such that higher numbers indicated a relative preference for the pro-Romney composite face. Because these items were worded identically for the preelection and the postelection pairs, we averaged the scores for the two types together. Although the pro-Romney and anti-Romney images did not differ in perceived trustworthiness (p = .22), caring (p = .10), or competence (p = .69), they did differ overall. A one-sample t test against the scale midpoint of 3.5 revealed that, as predicted, the photograph of Romney averaged from the Phase 1 participants who supported the candidate more was rated as looking better overall than the photograph of Romney averaged from the participants who supported him less (M = 3.67), t(70) = 2.04, p = .045.
The group-level images from the voting-intentions-or-behavior groups and the political-orientation groups were rated by two separate MTurk samples: One sample rated the preelection images, and the other rated the postelection images. Seventy MTurk participants rated the group-level images for the two preelection groups of participants who said they would vote for Romney (n = 29) or Obama (n = 31). Seventy-two different MTurk participants rated the group-level images for the two postelection groups of participants who actually voted for Romney (n = 21) or Obama (n = 32). Ratings from these two samples were combined to uncover any overall differences between Romney and Obama voters’ mental representations of Romney. Although the images did not differ in how caring or competent Romney looked (lowest p = .17), they did differ with regard to how trustworthy and how good overall Romney looked. One-sample t tests against the scale midpoint of 3.5 revealed that, as predicted, the photograph of Romney generated from participants who planned to vote or voted for Romney was rated as more trustworthy (M = 3.67), t(141) = 2.00, p = .048, and as looking better overall (M = 3.74), t(141) = 2.39, p = .02, than the photograph generated from participants who planned to vote or voted for Obama.
Finally, the group-level images from the two groups in which the participants said they were more Republican (preelection: n = 23; postelection: n = 26) and the two groups in which the participants said they were more Democrat (preelection: n = 26; postelection: n = 37) were rated by the same two MTurk samples that had rated the voting-intentions-or-behavior images. Again, one of the samples (n = 70) rated the pairs generated by preelection participants in Phase 1, and the other sample (n = 72) rated the pair generated by postelection participants. We again collapsed ratings across both samples to determine whether the photo of Romney generated by participants who were more Republican was rated as more trustworthy, caring, or competent, or better overall, than the photo of Romney generated by participants who were more Democrat. The images did not differ in how caring or competent Romney looked (lowest p = .07). However, as before, the images differed with regard to how trustworthy and how good overall Romney looked. The difference was subtle (see Fig. 3), as many of the MTurk raters remarked. Nevertheless, one-sample t tests against the scale midpoint of 3.5 revealed that, as predicted, the photograph of Mitt Romney generated by the more-Republican participants was rated as more trustworthy (M = 3.73), t(141) = 2.52, p = .013, and as looking better overall (M = 3.85), t(141) = 3.58, p < .0001, than the photograph generated by the more-Democrat participants (see Fig. 3).
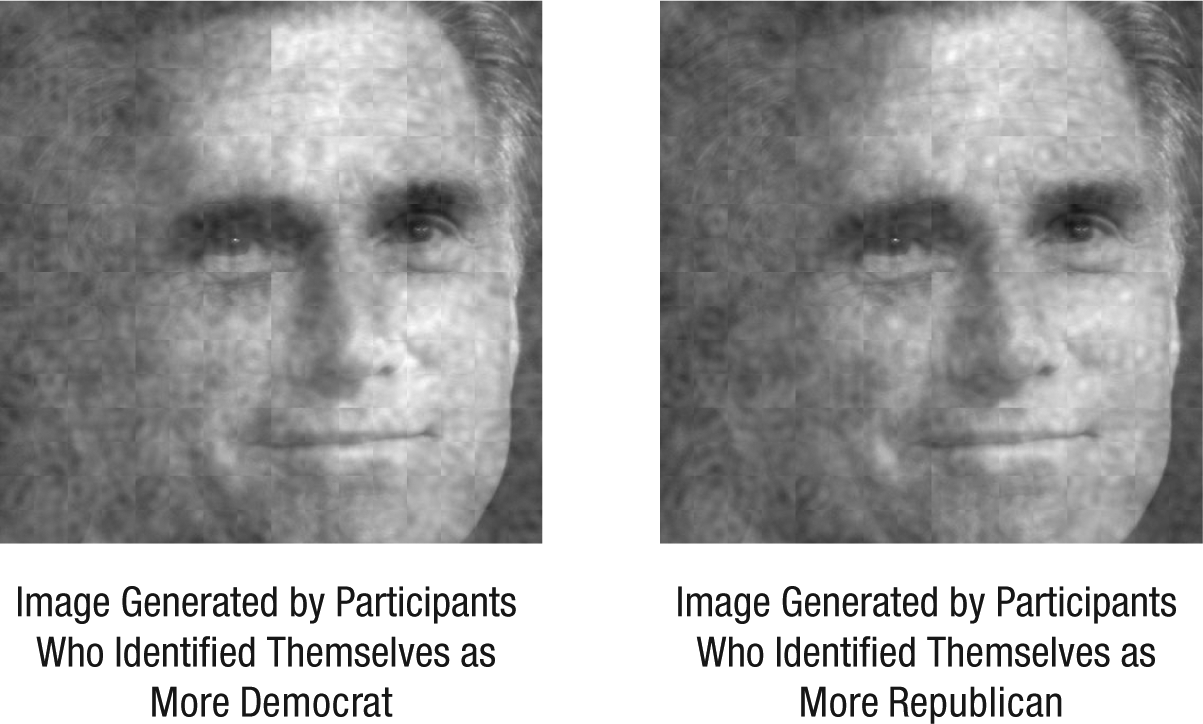
The Romney images generated by postelection participants who identified themselves as more Democrat and who identified themselves as more Republican.
The Supplemental Material details a meta-analysis of the three group-level image comparisons (support, voting intentions or behavior, and political orientation). This analysis indicated that the pro-Romney image was rated as significantly more trustworthy, more caring, and better overall than the anti-Romney image.
Discussion
Our experiment provides evidence that people’s subjective mental representations of an object to which they are exposed frequently and for which the characteristics should be relatively unambiguous can be biased in line with political attitudes. Although voters in the swing state of Ohio were exposed to countless political advertisements and thus had a very good idea of what Romney’s face looked like, we consistently found that his face as represented in the minds of supporters looked more trustworthy and better overall than his face as represented in the minds of detractors.
The reverse-correlation method was particularly useful in this case because it provided an estimate of the mental representation of a specific individual’s face in the mind of a participant, which would be difficult to approximate using self-report measures. We were, in essence, peering into each participant’s mind’s eye and estimating what he or she pictured when imagining Romney’s face. Participants were not confronted with a direct query regarding Romney’s face (e.g., “What does Romney’s face look like to you? How trustworthy is that face?”). Instead, the method bypassed any reliance on participants’ judgments of how trustworthy or attractive their own visual representations of Mitt Romney’s face were. Therefore, it allowed us to obtain estimates of participants’ visual images untarnished by the demand characteristics that can arise from a direct query. It also overcame any difficulty participants might have experienced if required to visualize their representations entirely on their own, unaided by the stimulus images.
One could suggest that Phase 1 participants responded to each trial directly on the basis of their attitude (e.g., selecting the more positive of the two images because they had more positive attitudes toward Romney). We find this improbable given that participants were told explicitly that we were interested in their accuracy in identifying which image looked more like the candidate. In addition, during every trial, the question “Which looks more like Mitt Romney?” was presented on the screen, which emphasized that we were asking them to choose which image was more similar to the actual candidate’s face, not which image looked better or more trustworthy. Moreover, in contrast to cases in which the reverse-correlation method is used to assess the face of a prototypical group member, the participants in our study certainly would have had a concrete mental image to consult when making their selections.
In sum, a variety of findings provide evidence consistent with the proposition that participants’ mental representations of the face of Mitt Romney were influenced by their political attitudes. Attitudes may have directly biased their representations. However, it is also possible that attitudes had an indirect effect via selective exposure (Frey, 1986). That is, perhaps supporters of Romney preferentially watched commercials that were pro-Romney and detractors preferentially watched commercials that were anti-Romney, and perhaps these ads differed with respect to the nature of the Romney face they displayed. We find this somewhat implausible, because Ohio voters were saturated with advertisements and unlikely to have been able to limit their exposure to the advertisements of a single campaign. In addition, a literature search did not succeed in uncovering empirical evidence that political advertisements use photographs of a candidate in which that candidate actually looks different in attack ads than he or she does in supporting ads (e.g., less trustworthy). Nevertheless, further research should focus on whether selective exposure contributes to the phenomenon revealed by the present research.
Our findings provide evidence that political attitudes (i.e., support for a candidate, political orientation) predict variability in the mental representation of something so concrete and familiar that it is seemingly immune to bias: a well-known presidential candidate’s face in a swing state in the heat of an election campaign. During the month of the presidential election, variations in participants’ representations of Mitt Romney’s face were related to their support for the candidate, their political affiliation, and their voting intentions or behavior. This implies that people’s attitudes have power to shape the world they see, even to the point of changing their mental representation of a person to whom they are exposed very frequently and providing what appears to be additional confirmation of those very attitudes. That attitudes can bias reality in the context of such a well-known, specific referent is a striking demonstration of their power.
Footnotes
Acknowledgements
We thank Eva Pietri, Matt Rocklage, Pete Zunick, Elise Bui, and the Group for Attitudes and Persuasion at The Ohio State University for feedback on this experiment. We also thank Lindsay Johnston for help in data collection and Ron Dotsch for providing MATLAB code.
Declaration of Conflicting Interests
The authors declared that they had no conflicts of interest with respect to their authorship or the publication of this article.
References
Supplementary Material
Please find the following supplemental material available below.
For Open Access articles published under a Creative Commons License, all supplemental material carries the same license as the article it is associated with.
For non-Open Access articles published, all supplemental material carries a non-exclusive license, and permission requests for re-use of supplemental material or any part of supplemental material shall be sent directly to the copyright owner as specified in the copyright notice associated with the article.