
Abstract
People perceive spatial form and temporal frequency through touch. Although distinct somatosensory neurons represent spatial and temporal information, these neural populations are intermixed throughout the somatosensory system. Here, we show that spatial and temporal touch can be dissociated and separately enhanced via cortical pathways that are normally associated with vision and audition. In Experiments 1 and 2, we found that anodal transcranial direct current stimulation (tDCS) applied over visual cortex, but not auditory cortex, enhances tactile perception of spatial orientation. In Experiments 3 and 4, we found that anodal tDCS over auditory cortex, but not visual cortex, enhances tactile perception of temporal frequency. This double dissociation reveals separate cortical pathways that selectively support spatial and temporal channels. These results bolster the emerging view that sensory areas process multiple modalities and suggest that supramodal domains may be more fundamental to cortical organization.
Keywords
We have a remarkable capacity to perceive and understand our environment through our sense of touch alone (Hollins, 2010). With our hands, we perceive fine spatial information, such as Braille dot patterns. We also perceive temporal information in the form of vibrations, and this sensitivity underlies our appreciation of surface texture (Weber et al., 2013). Separate receptors and afferent populations support spatial and temporal tactile channels in the peripheral somatosensory system (Johnson, 2001). Spatial and temporal tactile information is also clearly represented in human primary and secondary somatosensory cortex (Burton, Sinclair, & McLaren, 2008; Burton, Sinclair, Wingert, & Dierker, 2008; Hegner, Lee, Grodd, & Braun, 2010; Kitada et al., 2006). Notably, the neural populations mediating spatial and temporal tactile channels are intermixed anatomically throughout the somatosensory system.
Tactile perception may also rely on neural processing in brain regions outside of the traditional somatosensory areas. Robust crossmodal tactile recruitment of visual cortex (VC) and auditory cortex (AC) is observed in the blind (Cohen et al., 1997; Pietrini et al., 2004; Sadato et al., 1996) and deaf (Auer, Bernstein, Sungkarat, & Singh, 2007; Levanen, Jousmaki, & Hari, 1998), and these cortical regions appear to retain their specialized functions in the service of tactile perception (Merabet & Pascual-Leone, 2010). Interestingly, VC (Amedi, Malach, Hendler, Peled, & Zohary, 2001; James et al., 2002; Pietrini et al., 2004) and AC (Foxe et al., 2002; Kayser, Petkov, Augath, & Logothetis, 2005; Nordmark, Pruszynski, & Johansson, 2012; Schurmann, Caetano, Hlushchuk, Jousmaki, & Hari, 2006) can also respond to touch alone in sighted and normal hearing individuals, which raises the possibility that crossmodal recruitment of sensory cortices may be a ubiquitous mode of brain function rather than the consequence of sensory deprivation (Ghazanfar & Schroeder, 2006). If VC and AC contribute specifically to spatial and temporal touch, respectively, then these sensory regions might also be considered supramodal processors that support particular cognitive functions regardless of input modality, rather than as dedicated processors for a single modality (Ricciardi & Pietrini, 2011). According to this hypothesis, VC and AC would provide distinct crossmodal pathways for engaging spatial and temporal tactile channels.
The relationship between brain activity and behavior can be directly tested using noninvasive brain-stimulation techniques such as transcranial magnetic stimulation (TMS) and transcranial direct current stimulation (tDCS). Targeted enhancement or disruption of neural activity can acutely affect motor, sensory, and cognitive processes and can also induce specific functional changes that persist after the cessation of stimulation (Cohen Kadosh, Levy, O’Shea, Shea, & Savulescu, 2012; Nitsche et al., 2008; Nitsche & Paulus, 2011). In the sensory domain, both spatial and temporal touch are modulated by tDCS application over somatosensory cortex (Song, Sandrini, & Cohen, 2011). In the research reported here, we adopted tDCS strategies used for modulating visual and auditory function to investigate the contributions of visual and auditory areas to spatial and temporal touch. According to the supramodal-organization hypothesis, we predicted that anodal tDCS over these regions would result in dissociable effects on touch (Fig. 1). In Experiments 1 and 2, we predicted that spatial touch would be enhanced by anodal tDCS over VC, but not AC. Conversely, in Experiments 3 and 4, we predicted that temporal touch would be enhanced by anodal tDCS over AC, but not VC.
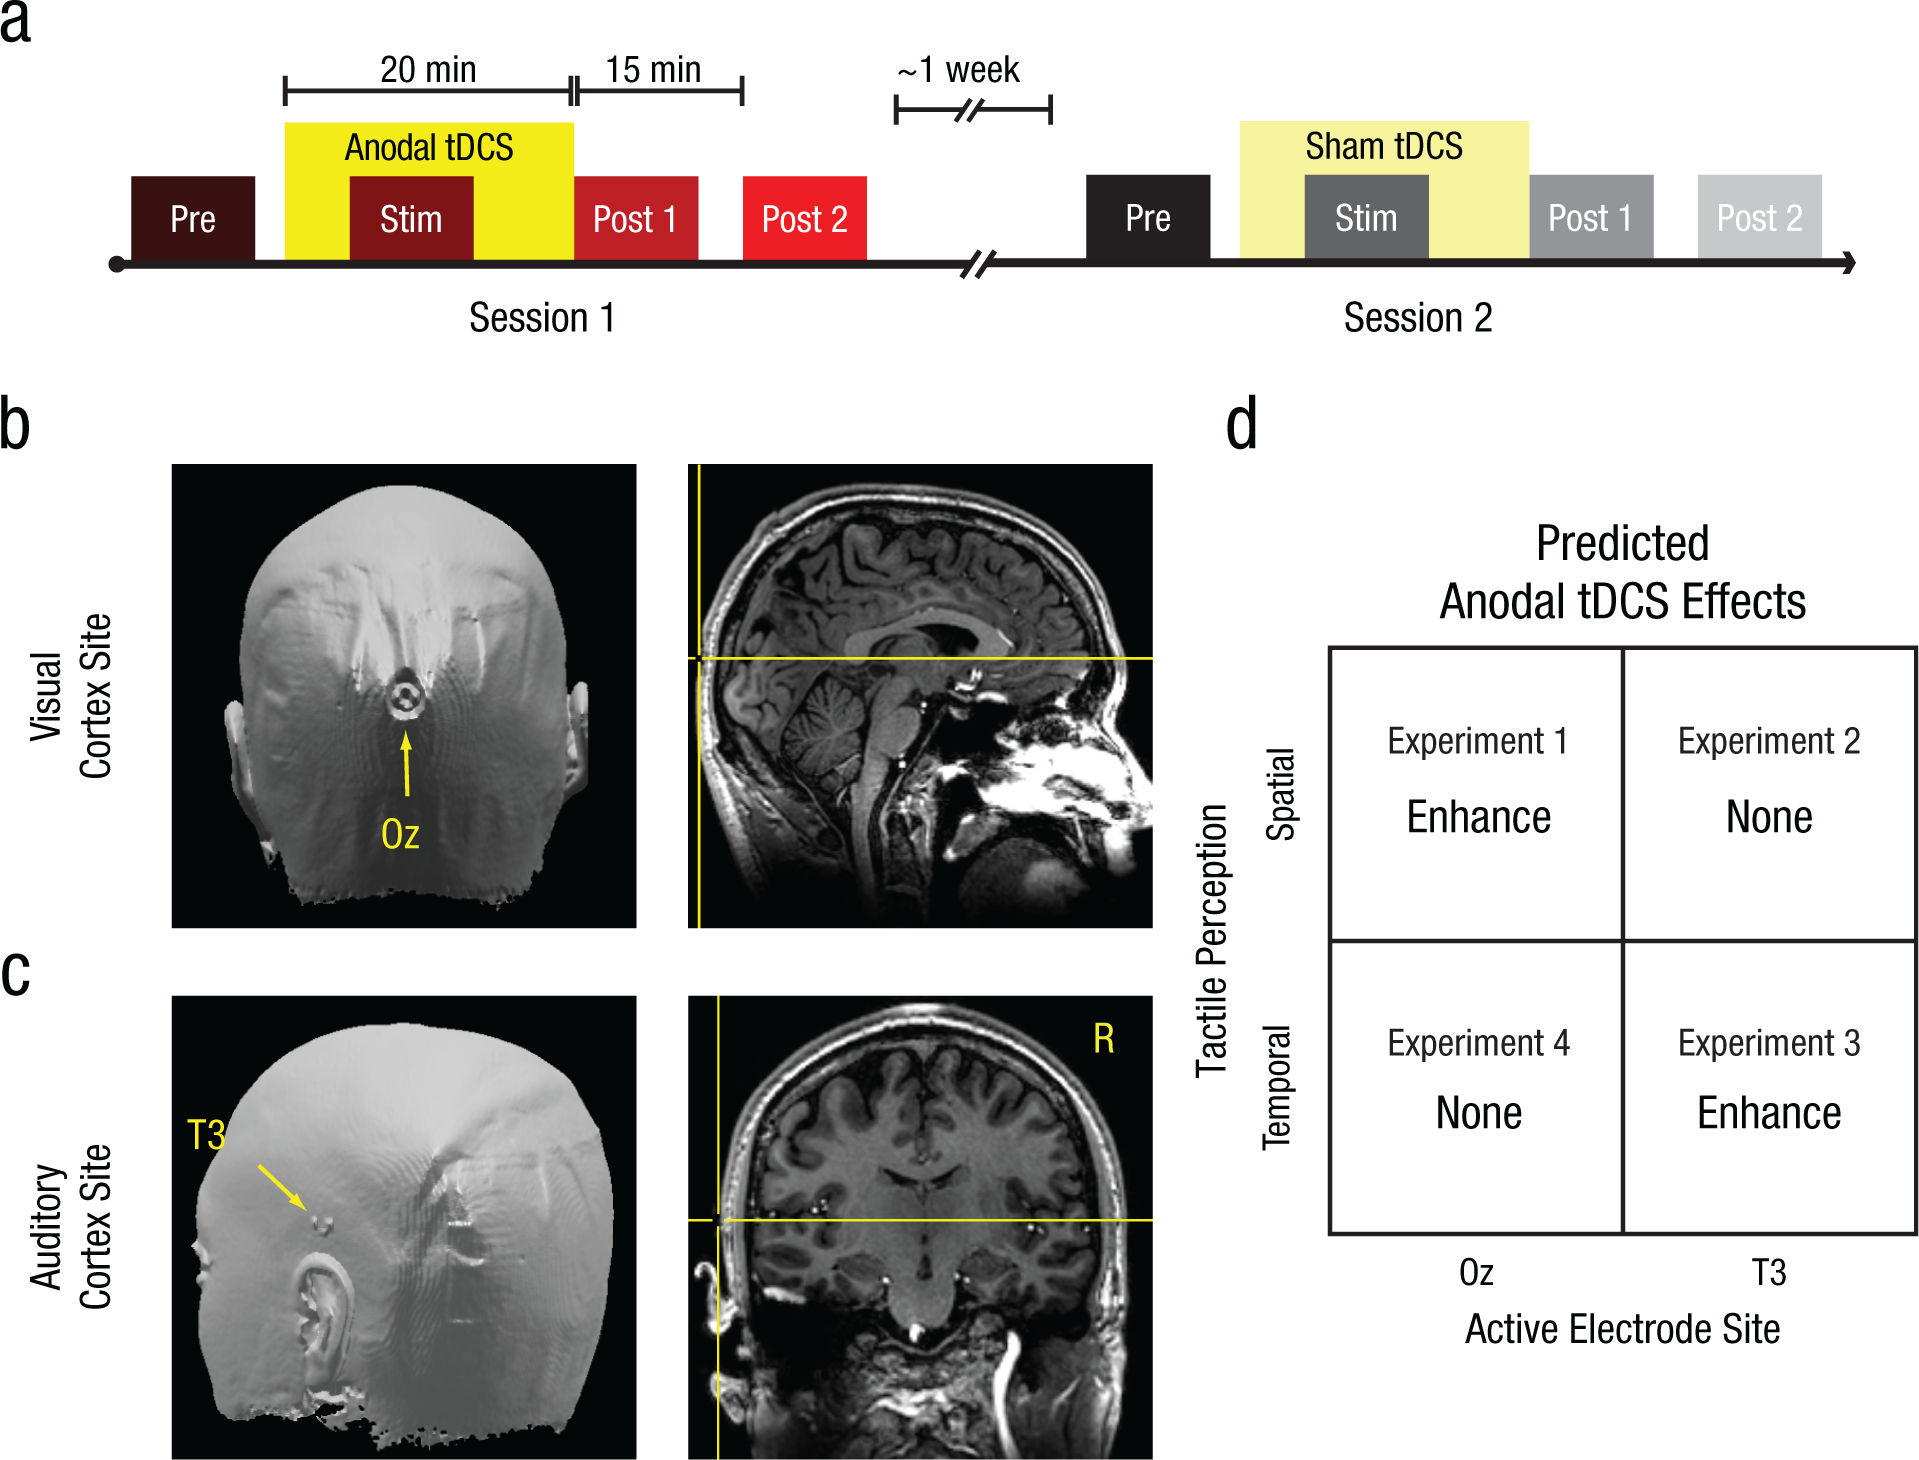
Experimental design. Panel (a) shows the experimental timeline: In each experiment, participants received 20 min of anodal transcranial direct current stimulation (tDCS; bright yellow box) or sham tDCS (faint yellow box) in two sessions separated by approximately 1 week. The order of tDCS treatment was counterbalanced across participants. Participants completed discrimination trials in four separate blocks during anodal (red-hued boxes) and sham (gray-hued boxes) sessions: Prestimulation Block (Pre), Stimulation Block (Stim), Poststimulation Block 1 (Post 1), and Poststimulation Block 2 (Post 2). Testing during tDCS (Stim) began 5 min after stimulation onset. Testing in the final block (Post 2) began 15 min after the cessation of tDCS. Panel (b) shows the anodal-electrode placement for stimulation over visual cortex, positioned over the Oz site, identified by a fiducial marker in a high-resolution anatomical scan of one participant. Panel (c) shows the anodal-electrode placement for stimulation over left auditory cortex, positioned over the T3 site. Panel (d) is a schematic showing the predicted effects of tDCS on spatial and temporal touch for stimulation over visual and auditory cortex.
General Method
General study design
Our study comprised four experiments based on a 2 × 2 factorial design crossing psychophysical task and tDCS site. For each experiment, we employed a counterbalanced, crossover design (Fig. 1a), such that each participant received both anodal and sham tDCS in separate sessions. During each session, participants performed psychophysical tasks before (Prestimulation Block), during (Stimulation Block), and after (Poststimulation Blocks 1 and 2) receiving 20 min of tDCS intervention. On average, each participant’s anodal and sham sessions were separated by 1 week. This design allowed us to quantify psychophysical-performance changes that occurred during each session and to perform within-subjects comparisons of perceptual changes specific to tDCS intervention.
Transcranial direct current stimulation
Anodal tDCS was delivered through two sponge electrodes (single-electrode surface area = 25 cm2) soaked in saline solution. In all experiments, the anodal (active) electrode was positioned according to International 10-20 electroencephalographic (EEG) coordinates to target visual or auditory regions (see the following section), and the cathodal electrode was positioned on the right cheek over the buccinator muscle. We used these electrode montages (specifically, the positioning of the reference electrode over the right cheek) to avoid potential confounding effects related to cathodal stimulation depressing cortical excitability beneath the reference electrode, as in other montages (Nitsche et al., 2008). Stimulation was delivered using the Chattanooga Iontophoresis System (Chattanooga Medical Supply, Inc., Chattanooga, TN) at current intensities that have been shown to be effective for modulating visual and auditory processing (see the following section). At the onset of anodal and sham stimulation, current increased in a ramp-like fashion over the course of 30 s, a procedure that has been shown to effectively blind participants as to whether they received sham or nonsham stimulation (Gandiga, Hummel, & Cohen, 2006). Participants’ ratings of attention, fatigue, and pain levels confirmed that their experiences of sham and anodal tDCS were statistically matched (Table 1).
Poststimulation Subjective Ratings of Attention, Fatigue, and Pain and Statistical Comparisons

Note: Ratings were made using a visual analog scale from 1 to 7, with higher values indicating greater attention, fatigue, or pain, respectively. Standard errors of the means are shown in parentheses. All ratings were statistically equivalent between anodal and sham sessions except for pain ratings in Experiment 2. tDCS = transcranial direct current stimulation.
Experiments 1 and 2
In Experiments 1 and 2, we tested the contributions of visual and auditory brain regions to spatial touch. Participants performed a psychophysical task designed to measure tactile spatial acuity. In separate participant groups, we targeted VC (Experiment 1) and AC (Experiment 2) for tDCS administration, and we adopted electrode positions used in previous studies to effectively modulate visual and auditory processing. For anodal tDCS administration over VC (Fig. 1b), the anodal electrode was centered over the Oz site and current intensity was set at 1 mA (Antal, Kincses, Nitsche, Bartfai, & Paulus, 2004; Antal, Nitsche, & Paulus, 2001). Anodal tDCS over this site improves visual sensitivity to Gabor patches (Antal et al., 2001), which are visual analogues to the tactile grating stimuli we tested. For anodal tDCS administration over AC (Fig. 1c), the anodal electrode was centered over the T3 site and current intensity was set at 2 mA, according to tDCS procedures previously used to improve auditory perceptual sensitivity (Ladeira et al., 2011). Given our additional interest in temporal touch (Experiments 3 and 4), we specifically targeted the left hemisphere for AC stimulation because frequency-dependent tactile responses have been shown to be lateralized to the left AC in humans, regardless of the hand stimulated (Nordmark et al., 2012).
Participants
Fifteen participants (6 males, 9 females; mean age = 25.2 years, SEM = 1.8 years; mean intersession interval = 7.7 days, SEM = 0.99 days) took part in Experiment 1. A separate group of 15 participants (7 males, 8 females; mean age = 22.5 years, SEM = 0.8 years; mean intersession interval = 7.9 days, SEM = 1.04 days) took part in Experiment 2. All testing procedures were performed in compliance with the policies and procedures of the Johns Hopkins Institutional Review Board. All participants gave their informed consent and were paid for their participation.
Method
Tactile spatial acuity was measured using a grating-orientation-identification task (Van Boven & Johnson, 1994; Werhahn, Mortensen, Van Boven, Zeuner, & Cohen, 2002; Zangaladze, Epstein, Grafton, & Sathian, 1999). Participants identified the orientation of tactile gratings centered on the distal finger pad of their left index finger. Gratings were either vertical or horizontal with respect to the finger’s long axis and varied in grating width (GW; spatial period) from 0.5 mm to 3.0 mm (see the Supplemental Material for a complete description of the grating-orientation task). Orientation identification is easy with large GW values but becomes more difficult at smaller GW levels.
Individual grating-orientation thresholds were defined as the GW that corresponded to 75% correct performance and were determined by interpolating between GWs spanning 75% correct responses (unless performance was precisely at 75% accuracy). This performance level is halfway between perfect and chance performance and is a standard psychophysical-threshold criterion (corresponding to a d′ value of 1.35).
Group grating-orientation thresholds (see inset in Fig. 2a) were derived by fitting the following psychometric function to performance data collapsed across all participants:
where p(C) is the proportion of correct responses, α and β are free parameters, and the group threshold is the GW corresponding to 75% correct performance along each psychometric curve. The resulting sigmoid functions range from 0.5 (chance performance) to 1 (perfect performance). Group thresholds revealed a pattern of effects that closely resembled the average pattern of thresholds calculated for individual participants. All statistical analyses were performed on grating-orientation thresholds estimated for individual participants.
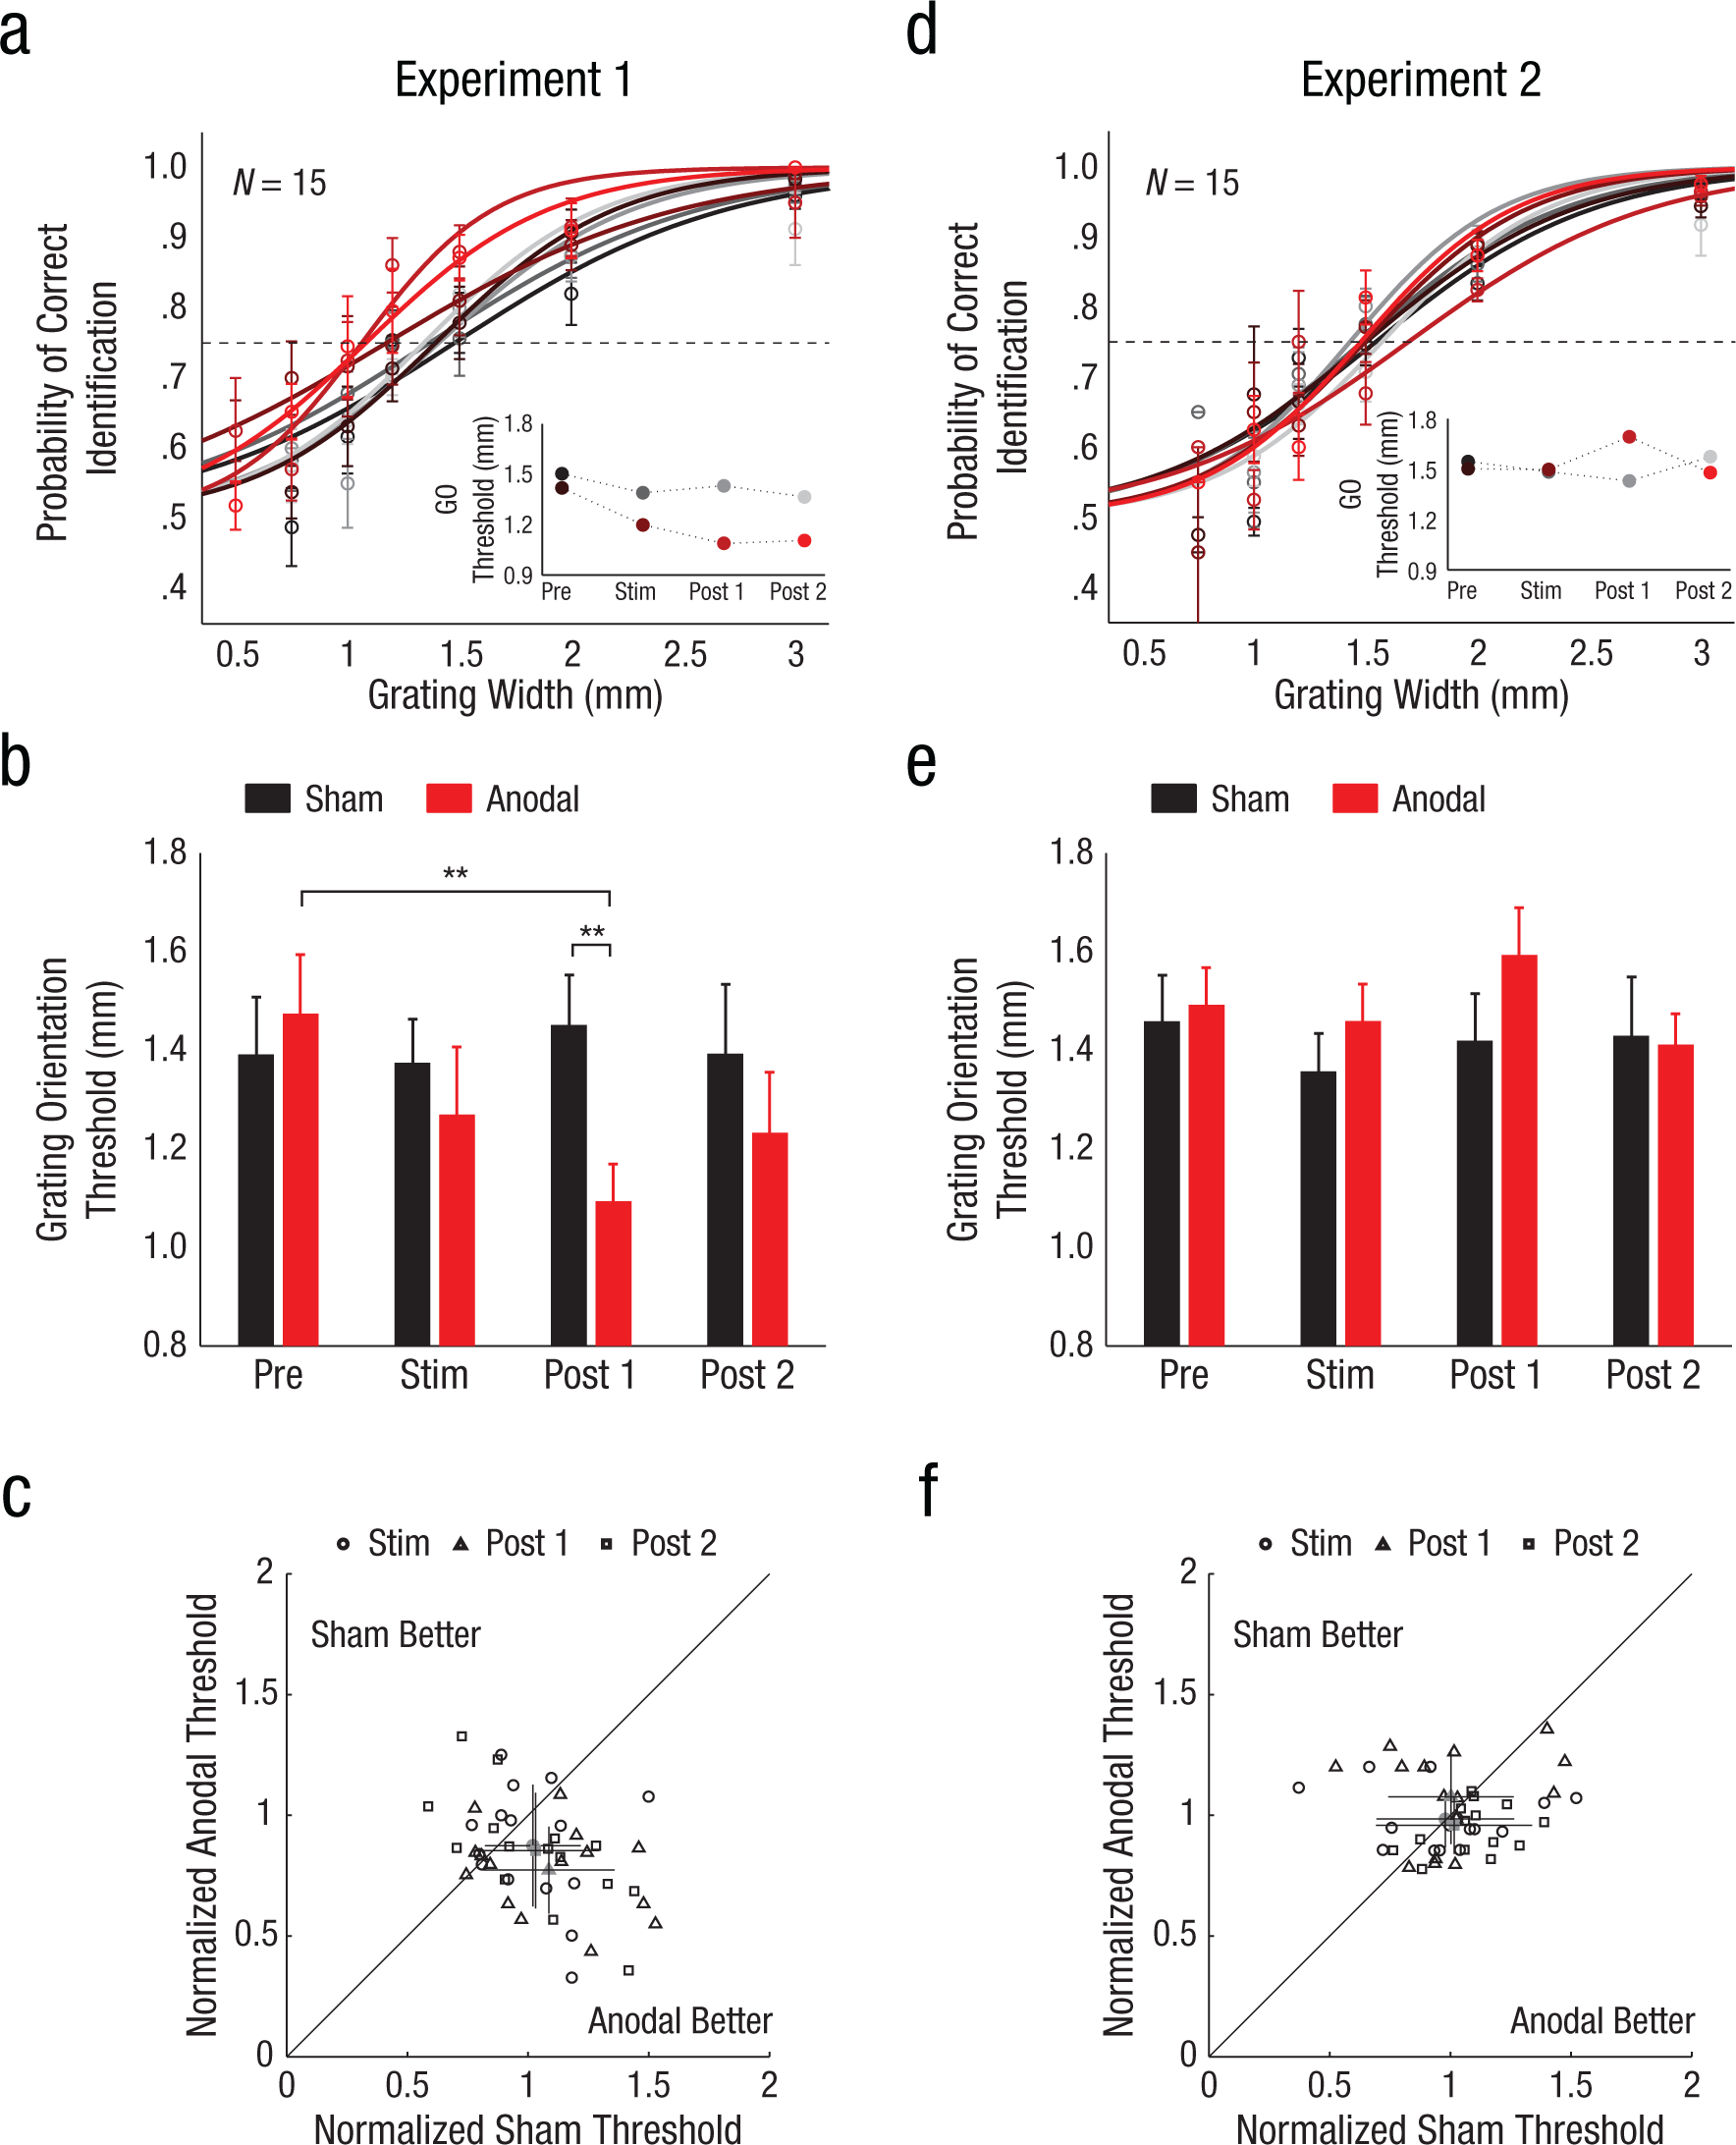
Results from Experiments 1 and 2. Panel (a) shows group psychometric curves (n = 15) from the grating-orientation-discrimination task in Experiment 1 (transcranial direct current stimulation, tDCS, over Oz), with the probability of correct orientation identification plotted as a function of tactile-grating width and session (anodal vs. sham). Curves are fit to data averaged over all participants. The intersection between each curve and the dashed line represents the grating-orientation threshold, or the grating width that yielded 75% correct performance. Error bars indicate standard errors of the means. The inset shows grating-orientation thresholds estimated from group psychometric curves for each test block. Panel (b) shows average grating-orientation thresholds for individual participants in Experiment 1 as a function of test block and session. Error bars indicate standard errors of the means. Panel (c) is a scatter plot showing the relationship between each participant’s grating-orientation thresholds in the sham and anodal sessions of Experiment 1 as a function of test block. Thresholds are normalized by each participant’s baseline (Prestimulation Block) threshold estimate for each session. Baseline normalization accounts for across-session and across-subject variability. The gray markers represent average normalized thresholds revealing greater enhancement of tactile spatial acuity during anodal sessions. Error bars indicate standard deviations. Panel (d) shows group psychometric curves (n = 15) from the grating-orientation-discrimination task in Experiment 2 (tDCS over T3), with the probability of correct orientation identification plotted as a function of tactile-grating width. Conventions are as in (a). Panel (e) shows average grating-orientation thresholds for individual participants in Experiment 2 as a function of test block and session. Error bars indicate standard errors of the means. Panel (f) is a scatter plot showing the relationship between each participant’s grating-orientation thresholds in the sham and anodal sessions of Experiment 2 as a function of test block. Conventions are as in (c). Asterisks indicate significant differences (**p < .01). GO = grating orientation.
Data analysis
All statistical tests were performed using MATLAB (The MathWorks, Natick, MA). To determine whether grating-orientation thresholds changed as a function of tDCS, we conducted a repeated measures analysis of variance (ANOVA) with time (Prestimulation Block, Stimulation Block, and Poststimulation Block 1) and tDCS (anodal and sham) as within-subjects factors. We performed post hoc paired t tests (Bonferroni corrected) if ANOVA interaction effects reached statistical significance. To characterize the persistence of tDCS effects, we conducted planned-comparison paired t tests assessing whether dependent measures in the Poststimulation Block 2 differed from values in the Prestimulation Block. To determine whether baseline thresholds depended on session order (which would reveal carryover effects between sessions), we conducted a repeated measures ANOVA with Prestimulation Block estimates as the dependent measure and session number (Session 1 and Session 2) and tDCS (anodal and sham) as within-subjects factors.
Results
In Experiment 1, participants identified the orientation of tactile gratings presented to their finger before, during, and after application of anodal tDCS over VC (Fig. 1b). A repeated measures ANOVA revealed that grating-orientation thresholds decreased significantly with anodal tDCS (Fig. 2a and 2b), with a significant Time × tDCS interaction, F(2, 27) = 3.7, p = .03, η p 2 = 0.207, and improved spatial acuity was clearly evident in individual participants (Fig. 2c). Average thresholds following anodal stimulation were significantly lower compared with baseline thresholds, t(14) = 3.65, p = .003, d = 0.89, and compared with thresholds following sham intervention, t(14) = 2.76, p = .008, d = 0.93. Critically, baseline thresholds did not differ between anodal and sham sessions, t(14) = 0.63, p = .73, which indicates that the magnitude of perceptual enhancements did not depend on participants’ initial sensitivities in test sessions. A two-way ANOVA on session and tDCS showed that baseline thresholds did not depend on session order (ps for main and interaction effects > .09), which indicates that perceptual enhancements did not carry over between sessions. Thresholds measured 15 min after tDCS cessation rebounded but remained lower than baseline, t(14) = 2.20, p = .04, d = 0.50. Together, these results indicate that anodal tDCS over VC induces robust, but temporary, improvements in tactile spatial perception.
In contrast to the results of Experiment 1, those in Experiment 2 showed that grating-orientation thresholds were unaffected by anodal tDCS over AC (Fig. 2d and 2e). Although baseline thresholds in Experiment 2 were comparable to those in Experiment 1, spatial-acuity estimates remained unchanged during test sessions and did not differ between anodal and sham sessions (Fig. 2e; ps for main and interaction effects of time and tDCS > .14). Accordingly, although there was again substantial variability in performance across participants (Fig. 2f), the dispersion in participants’ thresholds did not reveal bias toward improved spatial acuity in anodal sessions. Thus, application of anodal tDCS over VC, but not AC, results in improved spatial touch.
Experiments 3 and 4
In Experiments 3 and 4, we tested the contributions of auditory and visual brain regions to temporal touch: Participants performed a psychophysical task designed to measure vibration-frequency sensitivity. In separate participant groups, we targeted AC (Experiment 3) and VC (Experiment 4) for tDCS administration, using the same tDCS methods used in Experiments 1 and 2, with the exception that current intensity was set to 2 mA for both stimulation sites.
Participants
Fifteen participants (5 males, 10 females; mean age = 25.3 years, SEM = 0.7 years; mean intersession interval = 9 days, SEM = 0.8 days) took part in Experiment 3 (4 had participated in Experiment 1, and 2 had participated in Experiment 2). A separate group of 15 participants (6 males, 9 females; mean age = 23.8 years, SEM = 1.2 years; mean intersession interval = 8.1 days, SEM = 0.7 days) participated in Experiment 4. All testing procedures were performed in compliance with the policies and procedures of the Johns Hopkins Institutional Review Board. All participants gave their informed consent and were paid for their participation.
Method
Tactile-frequency sensitivity was assessed using a frequency-discrimination task (Yau, Olenczak, Dammann, & Bensmaia, 2009). Participants judged which of two vibrotactile stimuli, delivered sequentially to each participant’s left index finger, was perceived as being higher in frequency. One trial interval always contained a 300-Hz vibration (standard stimulus); the frequency of the vibration presented during the other interval (comparison stimulus) ranged from 150 to 450 Hz in 50-Hz increments (excluding 300 Hz). Vibration stimuli were equated in perceived intensity to ensure that participants could perform the discrimination task using only frequency information (see the Supplemental Material for a complete description of the frequency-discrimination task).
To quantify participants’ ability to discriminate frequency, we fit each participant’s data with a psychometric function:
where p(fc > fs) is the proportion of trials a comparison stimulus with frequency fc was judged to be higher in frequency than the standard stimulus with frequency fs, and σ and µ are free parameters corresponding to estimates of the participant’s sensitivity and bias, respectively. Sensitivity estimates denote the change in frequency (with respect to the standard) that participants could detect 73% of the time. Bias estimates indicate the point of subjective equality. The resulting sigmoid ranges from 0 to 1. Psychometric functions were also fit to the aggregated group data for illustration purposes (Fig. 3a and 3d), but all statistical tests were conducted on the parameters estimated for individual participants.
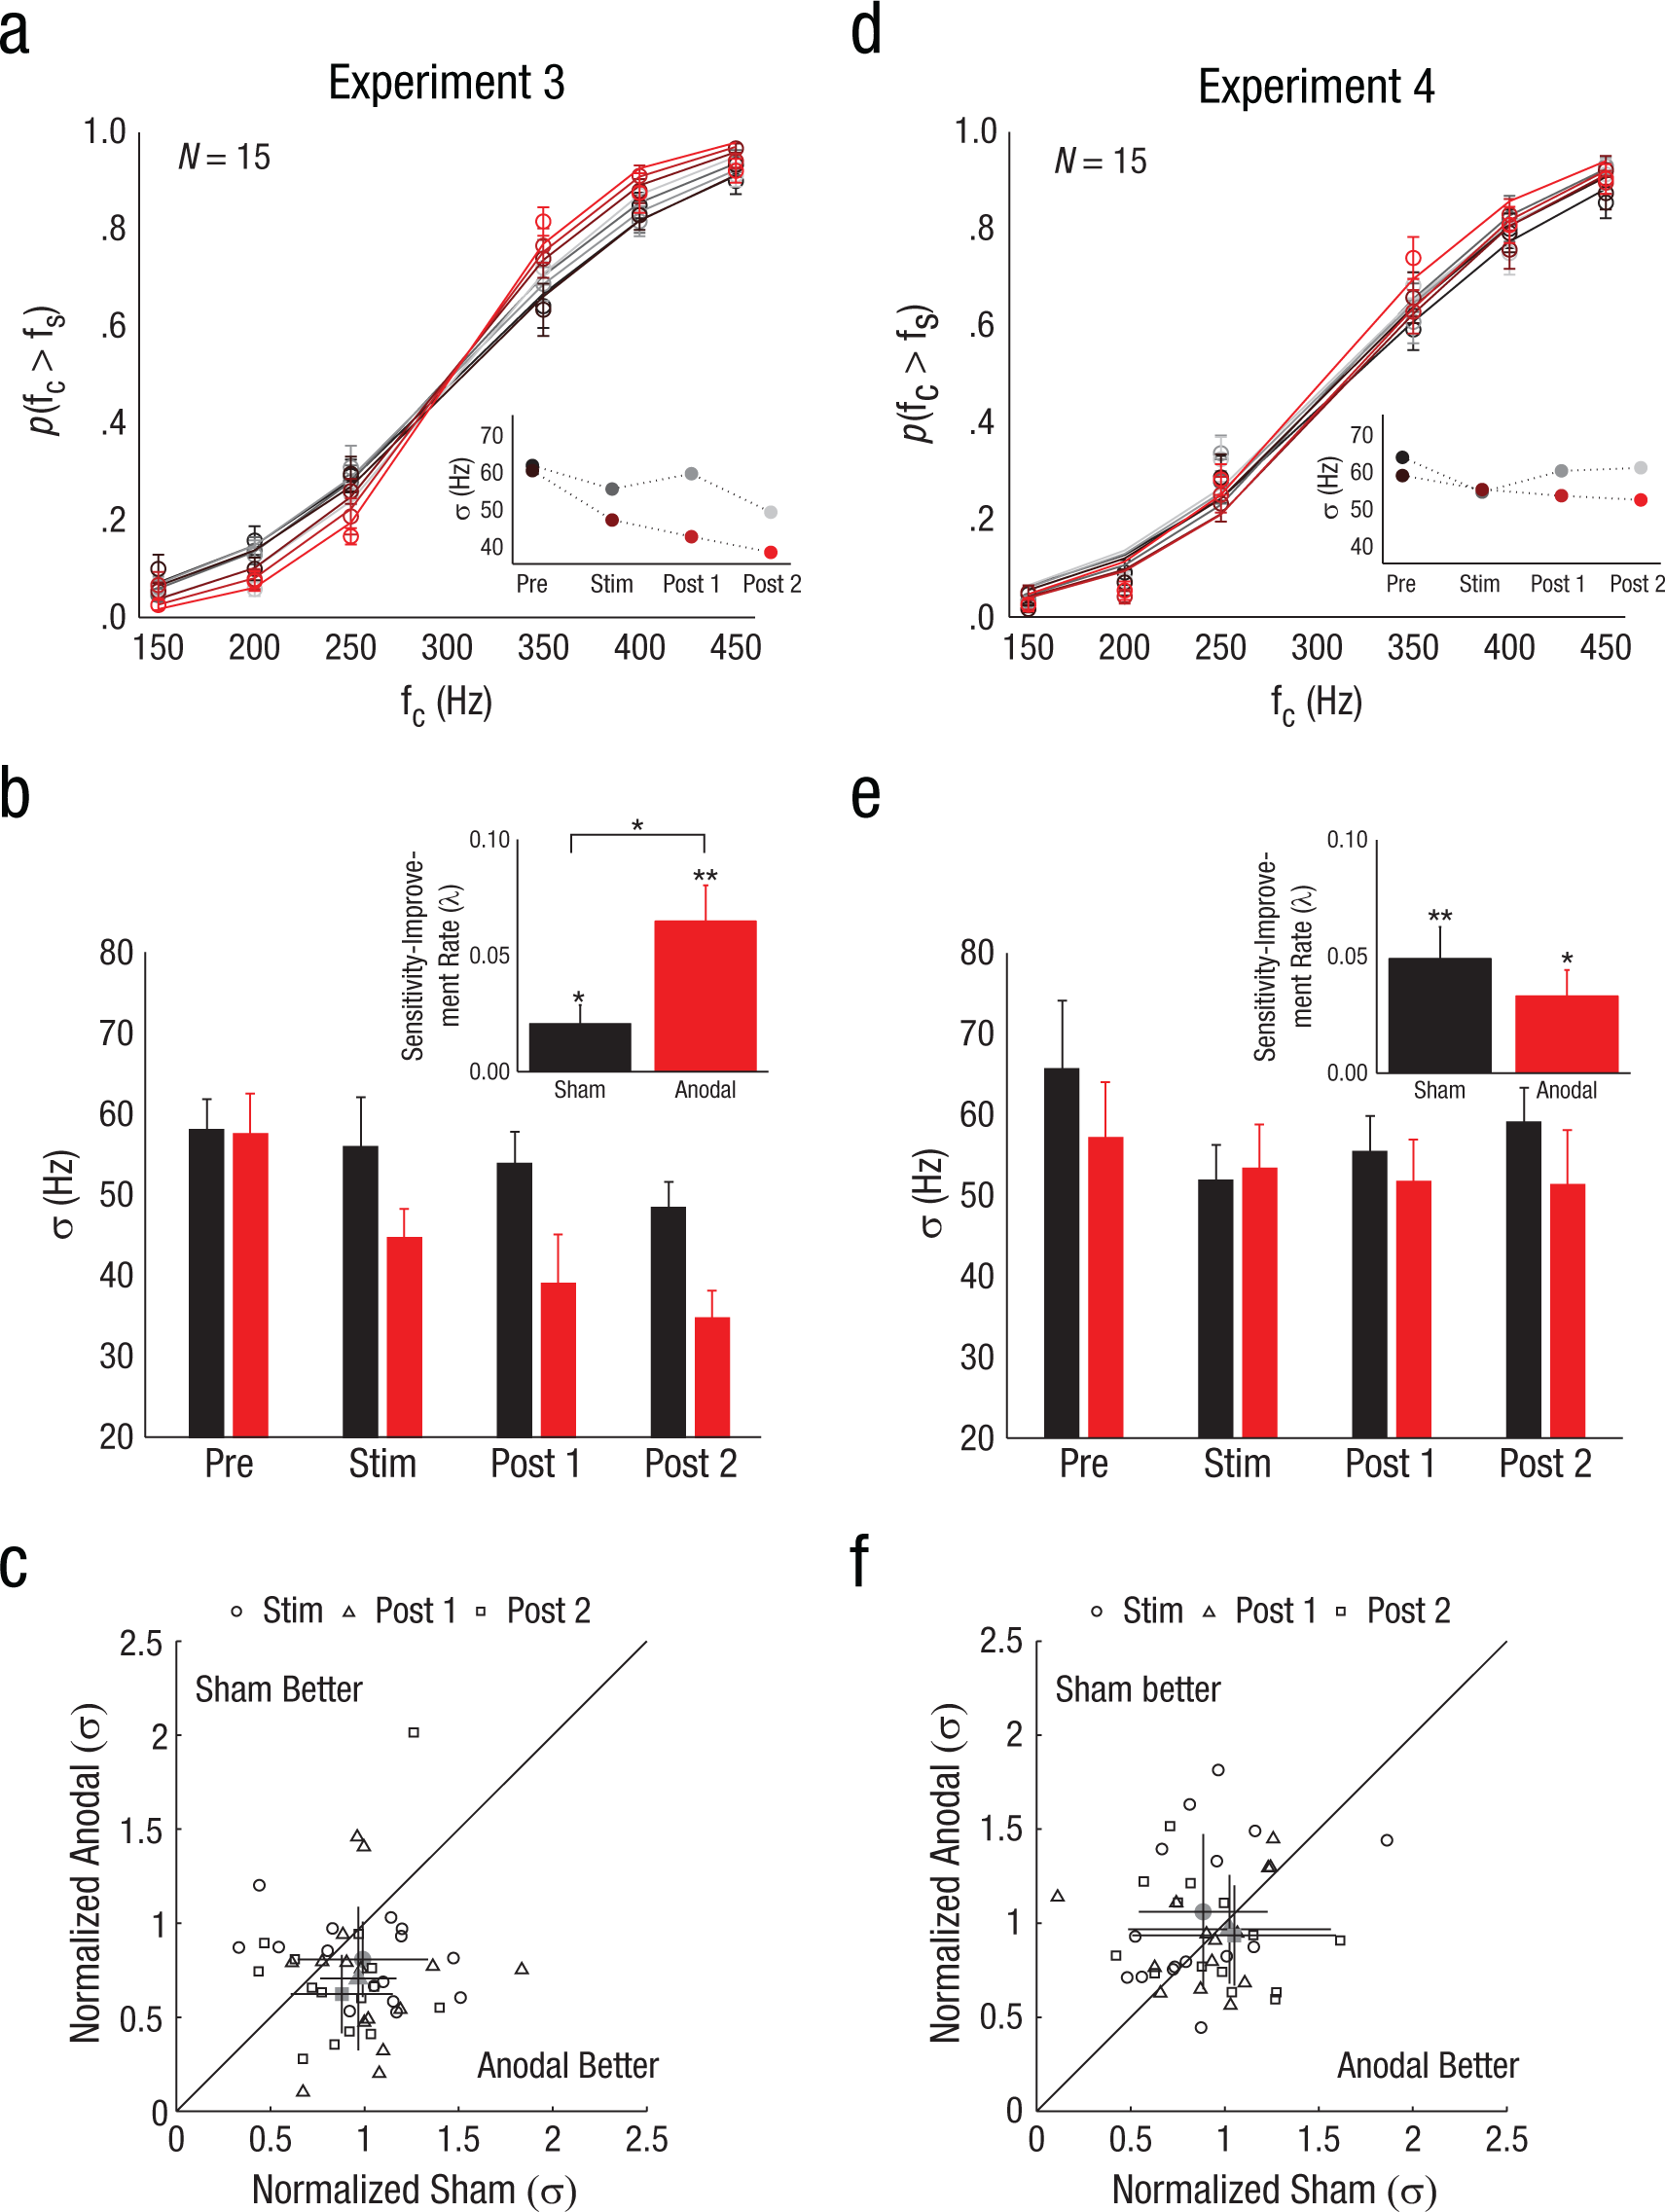
Results from Experiments 3 and 4. Panel (a) shows group psychometric curves (n = 15) from the frequency-discrimination task in Experiment 3 (transcranial direct current stimulation, tDCS, over T3), with the probability of the frequency of a comparison stimulus (fc) being judged to be higher than the frequency of the standard stimulus (fs) plotted as a function of comparison-stimulus frequency. Curves are fit to data aggregated over all participants. Error bars indicate standard errors of the means. The inset shows the frequency-sensitivity parameter (σ) estimated from the group psychometric curves for each test block. Smaller sigma values indicate higher sensitivity. Panel (b) shows average frequency-sensitivity estimates for individual participants as a function of test block and session (anodal vs. sham). The inset shows sensitivity-improvement rates (λ) as a function of session; larger lambda values indicate greater sensitivity-improvement rates. Error bars indicate standard errors of the means. Panel (c) is a scatter plot showing the relationship between each participant’s frequency-sensitivity estimates in the sham and anodal sessions in Experiment 3 as a function of test block. Sensitivity estimates are normalized by each participant’s baseline (Prestimulation Block) sensitivity estimate for each session. The gray markers represent average normalized thresholds revealing enhanced frequency sensitivity during anodal sessions. Error bars indicate standard deviations. Panel (d) shows group psychometric curves (n = 15) from the frequency-discrimination task in Experiment 4 (tDCS over Oz). Conventions are as in (a). Panel (e) shows average frequency-sensitivity estimates for individual participants in Experiment 4 as a function of test block and session. Conventions for the inset are as in (b). Panel (f) is a scatter plot showing the relationship between each participant’s frequency-sensitivity estimates in Experiment 4 as a function of test block. Conventions are as in (c). Asterisks indicate significant differences (*p < .05, **p < .01).
To quantify the change in each participant’s frequency sensitivity (improvement rates), we fit sensitivity estimates in each session with an exponential function:

where S(t) is the sensitivity estimate (σ) at time t, S0 denotes baseline sensitivity, and λ is the improvement rate. We modeled improvement rates with an exponential function because sensitivity estimates were necessarily greater than zero (and the function captured decay toward this theoretical lower bound). For completeness, we confirmed that improvement rates based on linear functions yielded similar results. To increase the time points included in the temporal-function fits and to detect improvement within test blocks, functions were fit to sensitivity values estimated separately from performance data in the first and second half of each test block (eight sensitivity values per session). We found a similar pattern of results when we fit rate estimates to all of the performance data within each test block (four sensitivity values per session).
All parameter estimations and statistical analyses were performed using MATLAB. Psychometric functions were fit to each participant’s performance data using an iterative nonlinear least-squares algorithm (lsqnonlin) to minimize the sum of squared differences between observed and predicted performance levels. To determine whether sensitivity parameters changed as a function of tDCS, we conducted a repeated measures ANOVA with time (Prestimulation Block, Stimulation Block, and Poststimulation Block 1) and tDCS (anodal and sham) as within-subjects factors. We conducted one-sample t tests to determine the significance of sensitivity improvement rates and paired t tests to determine whether improvement rates differed according to tDCS intervention.
Results
In Experiment 3, participants performed a tactile-frequency-discrimination task during sessions in which they received tDCS over AC (Fig. 1c). Across the group of participants, frequency sensitivity improved significantly during test sessions (Fig. 3a and 3b; lower sigma values indicate better frequency sensitivity), as shown by a main effect of time, F(2, 27) = 5.29, p = .01, η p 2 = .153, and substantial sensitivity changes were evident in individual participants (Fig. 3c). Bias estimates were unaffected by tDCS (ps for main and interaction effects of time and tDCS > .55). Although participants were significantly more sensitive to vibration frequency during anodal sessions, as revealed by a main effect of tDCS, F(1, 27) = 8.34, p = .01, η p 2 = .187, the Time × tDCS interaction effect failed to reach significance, F(2, 27) = 1.59, p = .22. This result was due to the fact that frequency sensitivity also improved modestly during sham sessions, which suggests a general practice or learning effect with the frequency task. Indeed, a main effect of time also revealed that response times improved over the course of testing, F(3, 42) = 6.98, p = .0007, η p 2 = .491, during both anodal and sham sessions (p for main effect of tDCS = .66; p for Time × tDCS interaction = .21). Together, these results reveal that participants’ performance on the vibration-frequency task improved generally within test sessions; however, the greater overall sensitivity during anodal sessions suggests that the general improvements may have been enhanced by tDCS over AC.
We quantified and compared the rate of sensitivity improvement during anodal and sham sessions (Fig. 3b, inset). Rate estimates (lambda values) revealed significant improvements in frequency sensitivity during both anodal sessions, t(14) = 4.15, p = .0009, and sham sessions, t(14) = 2.51, p = .025, a pattern of results consistent with general practice or learning effects. Critically, though, rate estimates were significantly larger for anodal sessions, t(14) = 2.56, p = .02, d = 0.84, which indicates that anodal stimulation over AC enhanced performance gains on the tactile-frequency-discrimination task relative to sham stimulation.
In Experiment 4, we found that tDCS over VC did not significantly modulate sensitivity estimates, as indicated by nonsignificant main and interaction effects of time and tDCS (ps > .17; Fig. 3d and 3e). Bias estimates also did not vary over sham and anodal sessions (ps for main and interaction effects of time and tDCS > .48). Although the psychophysical parameters were not significantly modulated by tDCS or time, participants did show general performance gains during test sessions, as measured by faster response times, F(3, 42) = 9.06, p = .0001, η p 2 = .346. An analysis of improvement rates also revealed general performance gains (see inset of Fig. 3e): Significant rates were observed in sham sessions, t(14) = 3.59, p = .003, and anodal sessions, t(14) = 2.93, p = .01, but these effects did not differ between sham and anodal tDCS interventions, t(14) = 0.90, p = .38. The equivalence between sham and anodal tDCS effects in Experiment 4 is also obvious given the sensitivity data for individual participants (Fig. 3f): Although frequency sensitivity improved in some participants, there was no evidence for greater or more consistent group-wide improvement during anodal sessions compared with sham sessions. Together, the results of Experiments 3 and 4 indicate that anodal tDCS over AC, but not VC, can facilitate performance gains on a vibration-discrimination task, resulting in larger improvements in frequency sensitivity.
Discussion
We sought to identify separate crossmodal mechanisms for spatial and temporal touch, and we found that anodal tDCS over visual and auditory regions dissociates between these perceptual channels. Tactile perception of grating orientation improved with anodal tDCS over VC, but not AC. Conversely, anodal tDCS over AC, but not VC, resulted in greater improvements in sensitivity to vibration frequency.
Acute application of anodal tDCS enhances neuronal excitability by inducing a tonic depolarization of resting membrane potential (Cohen Kadosh et al., 2012; Nitsche et al., 2008). Increased cortical excitability, resulting in increased neural signal relative to noise, may have resulted in the rapid sensitivity changes we observed during tDCS application (Stimulation Block) in Experiments 1 and 3. In comparison, the persistence of tactile-sensibility improvements beyond the stimulation period likely resulted from an interaction between anodal tDCS and performance of the psychophysical tasks. Indeed, prolonged application of anodal tDCS can induce neuroplasticity resembling activity-dependent long-term potentiation (Fritsch et al., 2010; Nitsche & Paulus, 2011), and anodal tDCS appears to benefit human motor learning when stimulation is paired with training (Reis et al., 2009). In our experiments, the coincidence of task performance with tDCS administration may have served to restrict potentiation effects to the neural populations specifically engaged in crossmodal processing or perceptual learning, leading to the persistent sensitivity improvements. Even extensive practice without brain stimulation can result in improvements in spatial (Wong, Peters, & Goldreich, 2013) and temporal (Imai et al., 2003) touch, so anodal tDCS interventions likely facilitate processing in cortical circuits that typically undergo experience-dependent plasticity. Whether comparable perceptual gains can be achieved with anodal tDCS alone remains to be tested. Critically, although experience- or stimulation-induced augmentation of central processes may increase perceptual sensitivity, the range of gains is still ultimately constrained by the response properties of peripheral afferent populations (Johnson, 2001; Van Boven & Johnson, 1994).
What specific brain regions were influenced by tDCS in our experiments? Current distribution and focality with tDCS can vary depending on the arrangement and size of the stimulating electrodes (Nitsche et al., 2008; Nitsche & Paulus, 2011). In our electrode montages, cortical tissue resided beneath only the anodal (active) electrode, restricting neuromodulatory effects to the targeted cortical regions. Modeling studies have indicated that current density along the cortical surface, which is only a fraction of the total injected current because of substantial shunting through the scalp (Wagner et al., 2007), is relatively homogenous over restricted areas directly under the electrode (Miranda, Lomarev, & Hallett, 2006). Thus, given the EEG-coordinate targets we adopted (Fig. 1b and 1c), we are confident that our tDCS interventions affected visual regions (in Experiments 1 and 4) and auditory regions (in Experiments 2 and 3); however, we cannot definitively rule out that other neighboring areas were also stimulated. For instance, anodal tDCS over the Oz site, which enhances visual sensitivity (Antal et al., 2001), may modulate cortical excitability in primary visual areas or visual association areas (i.e., striate and extrastriate cortex). Similarly, anodal tDCS over the T3 site, which enhances auditory sensitivity (Ladeira et al., 2011), may modulate cortical responses in primary auditory areas or auditory association areas (i.e., core, belt, and parabelt regions). Furthermore, tDCS over the T3 site, which enhanced frequency sensitivity in Experiment 3, may have also modulated neural responses in secondary somatosensory cortex (S2), especially given that parietal operculum (PO), the human homologue of monkey S2, exhibits responses to high-frequency vibrations (Burton, Sinclair, & McLaren, 2008; Burton, Sinclair, Wingert, et al., 2008). Critically, PO also responds to tactile spatial patterns (Burton, Sinclair, Wingert, et al., 2008; Hegner et al., 2010; Kitada et al., 2006). Thus, it is conceivable that tDCS affecting S2 would influence both spatial and temporal touch; however, no spatial-touch enhancement was observed in Experiment 2. Therefore, given the limited focality of tDCS, we cannot claim that tDCS over T3 modulated only auditory brain regions, but we can conclude that tDCS over this site dissociates temporal touch from spatial touch.
That tDCS over VC and AC influences tactile processing is consistent with results from neuroimaging studies employing methods that are suited for localizing tactile responses to visual brain regions (Amedi et al., 2001; James et al., 2002; Pietrini et al., 2004) and auditory brain regions (Foxe et al., 2002; Kayser et al., 2005; Schurmann et al., 2006). Notably, left AC exhibits frequency-dependent tactile responses for sinusoidal stimulation of either the left or the right hand (Nordmark et al., 2012), and our results suggest that the asymmetric specialization of human AC (i.e., left AC for fundamental pitch processing and right AC for spectral processing; Warrier et al., 2009) may extend to crossmodal frequency processing—this generalization, however, remains to be tested systematically in future studies.
Our results corroborate the findings of not only neuroimaging studies but also disruptive-brain-stimulation studies (Bolognini, Papagno, Moroni, & Maravita, 2010; Merabet et al., 2004; Zangaladze et al., 1999) that support the supramodal-organization hypothesis. Notably, because we found that tactile sensibilities are enhanced following VC and AC stimulation, our study additionally establishes the clinical potential of crossmodal tDCS interventions for sensory rehabilitation and perceptual enhancement (Cohen Kadosh et al., 2012).
Because noninvasive brain stimulation targeting classically defined somatosensory regions also modulates perception of spatial and temporal tactile stimulus features (Song et al., 2011), we propose that tactile perception is supported by distributed cortical networks that comprise somatosensory areas cooperating with visual and auditory areas. Anatomical-connectivity studies have identified several pathways by which information potentially transfers between sensory systems (Cappe, Rouiller, & Barone, 2012). A key question yet to be addressed is how connectivity in these distributed networks is dynamically modulated and maintained. It is possible that deployment of selective attention to particular stimulus features, such as grating orientation or vibration frequency, enhances somatosensory connectivity with VC or AC, respectively. Cross-areal coupling may be achieved by synchronizing intrinsic brain oscillations in these cortical networks (Canolty & Knight, 2010), and this mechanism has been shown to amplify selected sensory information (Schroeder & Lakatos, 2009).
In summary, common cortical resources appear to support spatial-form and temporal-frequency processing across sensory modalities. Shared processing mechanisms can account for correspondences in haptic and visual shape perception (Lacey & Sathian, 2011) and in haptic and auditory frequency perception (Bensmaia, Hollins, & Yau, 2005). Multisensory convergence in common cortical processors also predicts highly specific somatosensory interactions with vision (Lacey & Sathian, 2011) and audition (Yau, Weber, & Bensmaia, 2010). However, it is important to note that supramodal processors may not explain all interactions between sensory modalities, given that multisensory interplay is not necessarily restricted to specific feature dimensions. Nevertheless, our results bolster the emerging view that sensory areas are not dedicated to single modalities and suggest that cortical organization can be defined by supramodal perceptual domains.
Footnotes
Acknowledgements
We thank D. Liao, S. Chung, and N. Kim for their help with data collection, and W. Nash, W. Quinlan, J. Killebrew, and D. Rana for technical support. We are grateful to N. Tritsch, D. Cheng, S. Bensmaia, and J. Finley for helpful comments and discussions.
Declaration of Conflicting Interests
The authors declared that they had no conflicts of interest with respect to their authorship or the publication of this article.
Funding
This work was supported by National Institutes of Health Grant NS073371 to J. M. Yau and the Johns Hopkins University Brain Science Institute.
References
Supplementary Material
Please find the following supplemental material available below.
For Open Access articles published under a Creative Commons License, all supplemental material carries the same license as the article it is associated with.
For non-Open Access articles published, all supplemental material carries a non-exclusive license, and permission requests for re-use of supplemental material or any part of supplemental material shall be sent directly to the copyright owner as specified in the copyright notice associated with the article.