
Abstract
Different researchers have reported positive, null, and negative relationships between confidence and accuracy in reports from memory. One possible reason for this paradox is the variety of materials used across experiments, but the two experiments reported in this article show that positive and negative confidence-accuracy correlations can be observed using a single procedure and the same materials. Subjects studied words from semantic categories and then took a recognition test while making confidence ratings. For previously studied items, positive correlations between confidence and accuracy were obtained using three different measures. Yet when confidence-accuracy correlations were assessed for unstudied items from studied categories, the correlations were zero or negative. The critical factors in determining when negative correlations will be found are the similarity of lures to presented items and the type of analysis used. These results indicate that one should be cautious about relying on confidence of recognition when rememberers must decide among highly similar events.
Keywords
The relationship between confidence and accuracy in reports from memory remains a puzzle. One hundred years ago, Dallenbach (1913) concluded from his research that “the degree of certainty of the [rememberer’s] replies bears a direct relation to the fidelity of the answer” (p. 335). This statement remains the common assumption in experimental psychology, because many experiments have yielded positive correlations between confidence and accuracy. Dunlosky and Metcalfe (2009) summarized this literature by writing that “the relative accuracy of people’s confidence is high. Higher confidence ratings almost inevitably mean that [items have] been previously presented” (p. 176). Many of the experiments obtaining such findings used lists of unrelated words.
A puzzle exists, however, because researchers studying face recognition in eyewitness memory paradigms often have reported no correlation between confidence and accuracy. Reviewing this literature years ago, V. L. Smith, Kassin, and Ellsworth (1989) reported that “confidence is neither a useful predictor of the accuracy of a particular witness nor the accuracy of particular statements made by the same witness” (p. 358), a conclusion affirmed by other eyewitness researchers more recently (e.g., Odinot, Wolters, & van Koppen, 2008; but see Brewer & Wells, 2006).
To complicate matters further, other researchers have even reported negative correlations between confidence and accuracy. These researchers have used materials such as pictures (Tulving, 1981), word lists (Roediger & DeSoto, 2014), “deceptive” sentences (Sampaio & Brewer, 2009), and general-knowledge items frequently responded to with “consensual” errors (e.g., non-Australians confidently name Sydney as the capital of Australia; Koriat, 2008, 2012). In short, researchers have found every possible relation between confidence and accuracy in reports from memory: positive, null, and negative.
From the previous few paragraphs, one might assume that the puzzling results are due to differences among materials: Word lists may give rise to positive correlations between confidence and accuracy, faces to null correlations, and certain other materials to negative correlations. In a review of the literature, however, we (Roediger, Wixted, & DeSoto, 2012) observed that these varying correlations are due to more than simple differences in materials. We pointed out that researchers have used at least five different methods of evaluating confidence-accuracy relations in reports from memory, and that these methods need not lead to the same conclusions. For example, when correlating judgments across people, one might find a null correlation, whereas computing the correlation across the items to be remembered could lead to a positive correlation.
Here, we report two experiments that further understanding of the confidence-accuracy paradox by showing that one can obtain positive, null, and negative correlations using the same materials (i.e., word lists), depending on the method of analysis employed. We used categorized lists that have been shown to produce relatively high levels of false recall and recognition (e.g., Dewhurst, 2001; Dewhurst & Anderson, 1999; S. M. Smith, Ward, Tindell, Sifonis, & Wilkenfeld, 2000). For each of 12 categories (e.g., “birds”), we selected the 20 category members (i.e., associates) named most frequently by subjects in norming studies. Each subject studied half the items from each category and then was given a recognition test on all the items, a technique pioneered by S. M. Smith et al. (2000). In Experiment 1, we included additional lures unrelated to any of the categories, whereas in Experiment 2, we dispensed with the unrelated lures for reasons discussed later. Subjects rated each test word as either old (studied) or new (unstudied) and then rated their confidence in that judgment. We applied three different types of analysis to the results. Depending on the type of item (target or lure) and the type of analysis, we obtained positive, null, or negative correlations between confidence and accuracy.
Experiment 1
Method
Subjects and materials
Forty-four undergraduate students from Washington University in St. Louis participated for course credit or payment. Washington University’s institutional review board approved the project.
Twelve categorized word lists were selected from the revision of the Battig and Montague (1969) category norms (Van Overschelde, Rawson, & Dunlosky, 2004). We selected the 20 items produced most frequently when subjects were given a category name (e.g., for the “birds” category, the 20 items from eagle in Position 1 to raven in Position 20). We refer to list position as response frequency rank or output dominance. (Note that items named most frequently have low values.)
The items in these lists (a total of 240 items) were included in the stimulus set. For each category, a given subject studied 10 items (targets), which were either the items in the odd-numbered list positions (1, 3, 5, etc.) or the items in the even-numbered list positions (2, 4, 6, etc.). The complementary set of 10 items served as lures; which items were targets and which were lures was counterbalanced across subjects. (Thus, all 20 items from each list were included in the recognition test.) Another 120 words unrelated to any of the studied categories (taken from 24 other categories) were also chosen as lures. The entire set of materials is included in the Supplemental Material available online. The experiment was programmed in Adobe Flash (Weinstein, 2012).
Procedure
The experiment consisted of three phases: study of the lists, a distractor task, and a recognition test. In the study phase, each subject listened (over headphones) to a recording of a female voice reading the category labels and items. Subjects heard a category label (e.g., “a bird”) and, after a 4-s pause, the corresponding 10 items from that category at a 2-s rate (paced by a metronome). Items within a category were presented in a random order that was the same for all subjects. Once all the items from a category were presented, the procedure was repeated with another category until all the categories had been presented. There was a 2-s interval between the last item from one category and the next category name. Categories were presented in a different random order for each subject.
After the study phase, subjects completed a 5-min distractor task (naming and ordering the U.S. presidents) intended to eliminate short-term memory effects.
Finally, subjects took a computerized yes/no recognition test over the 360 items, presented one at a time and randomly ordered for each subject. The items on the test were the 120 targets (studied items) from the 12 lists, the 120 related lures (alternate, unstudied items from the same 12 categories), and the 120 unrelated lures taken from new categories. Subjects indicated with a mouse click whether they believed each item to be old (studied) or new (unstudied), and then reported their confidence in their recognition decision using a sliding scale that ranged from 0 (not at all confident) to 100 (entirely confident; see DeSoto, in press).
Recognition decisions and confidence ratings were subject paced. Subjects were not told about the composition of the test list or the proportion of studied items on the test. The entire experiment lasted about 60 min. Afterward, subjects were debriefed and thanked for their participation.
Results
The data for Experiments 1 and 2 can be found in the Supplemental Material available online. We use Cohen’s d (Olejnik & Algina, 2000) as our measure of effect size for comparisons of means and omega-squared (ω2; Maxwell & Delaney, 2004) as our measure of effect size for analyses of variance (ANOVAs).
Recognition memory performance
The top row of Table 1 shows the mean probability with which subjects responded “old” to the three different types of items on the recognition test (i.e., targets, related lures, and unrelated lures), as well as subjects’ mean confidence in these “old” responses. A repeated measures ANOVA revealed statistically significant differences in “old” response probabilities as a function of item type, F(2, 86) = 205.58, p < .001, ω2 = .73. Subjects responded “old” to targets more frequently than to related lures, t(43) = 10.75, p < .001, d = 2.01, and responded “old” to related lures more frequently than to unrelated lures, t(43) = 12.84, p < .001, d = 2.09. Thus, lures from the same categories as targets produced many more false alarms than unrelated lures, as has been found previously.
Rate of “Old” Responses and Confidence in Those Responses as a Function of Item Type
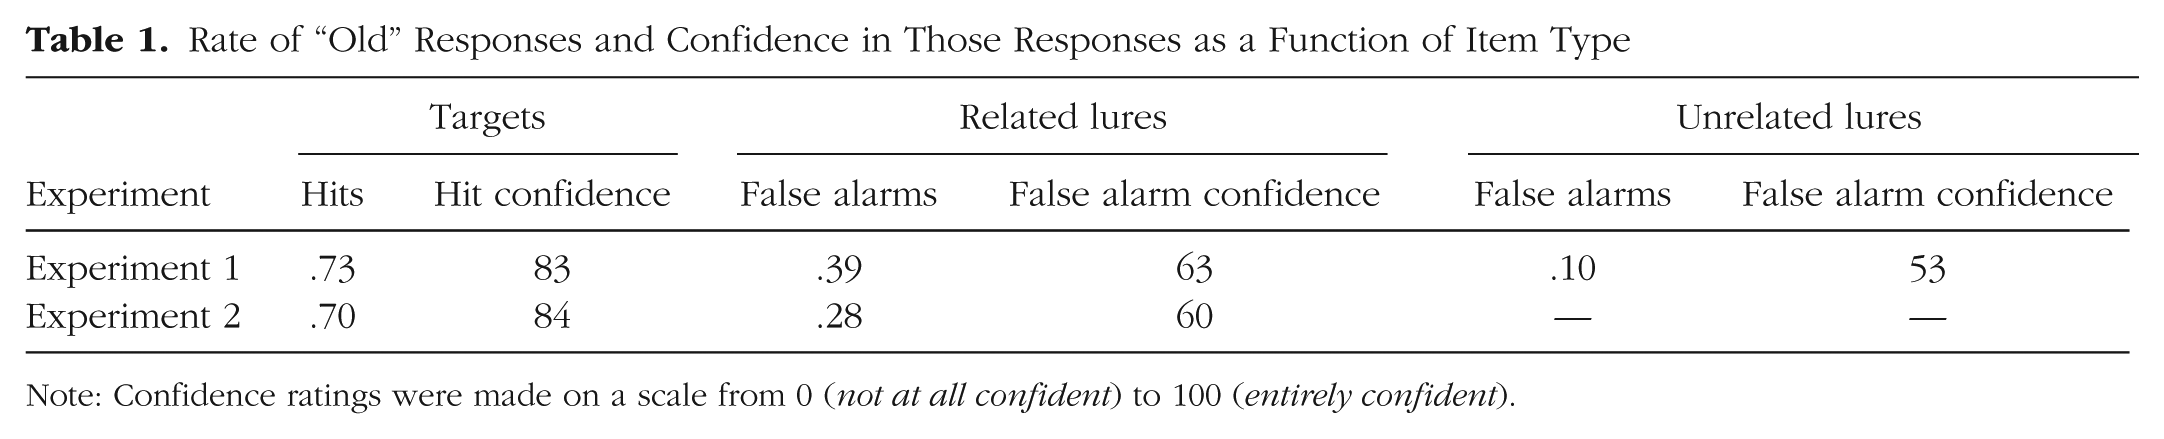
Note: Confidence ratings were made on a scale from 0 (not at all confident) to 100 (entirely confident).
Confidence ratings tracked with these probabilities; another repeated measures ANOVA revealed statistically significant differences in confidence ratings for “old” responses as a function of item type, F(2, 76) = 108.85, p < .001, ω2 = .42. (Five subjects were excluded from the ANOVA and post hoc tests because they did not respond “old” to any unrelated lure.) Subjects were more confident when responding “old” to studied items than to related lures, t(38) = 11.11, p < .001, d = 1.65, and more confident when responding “old” to related lures than to unrelated lures, t(38) = 6.01, p < .001, d = 0.62.
Confidence-accuracy correlations
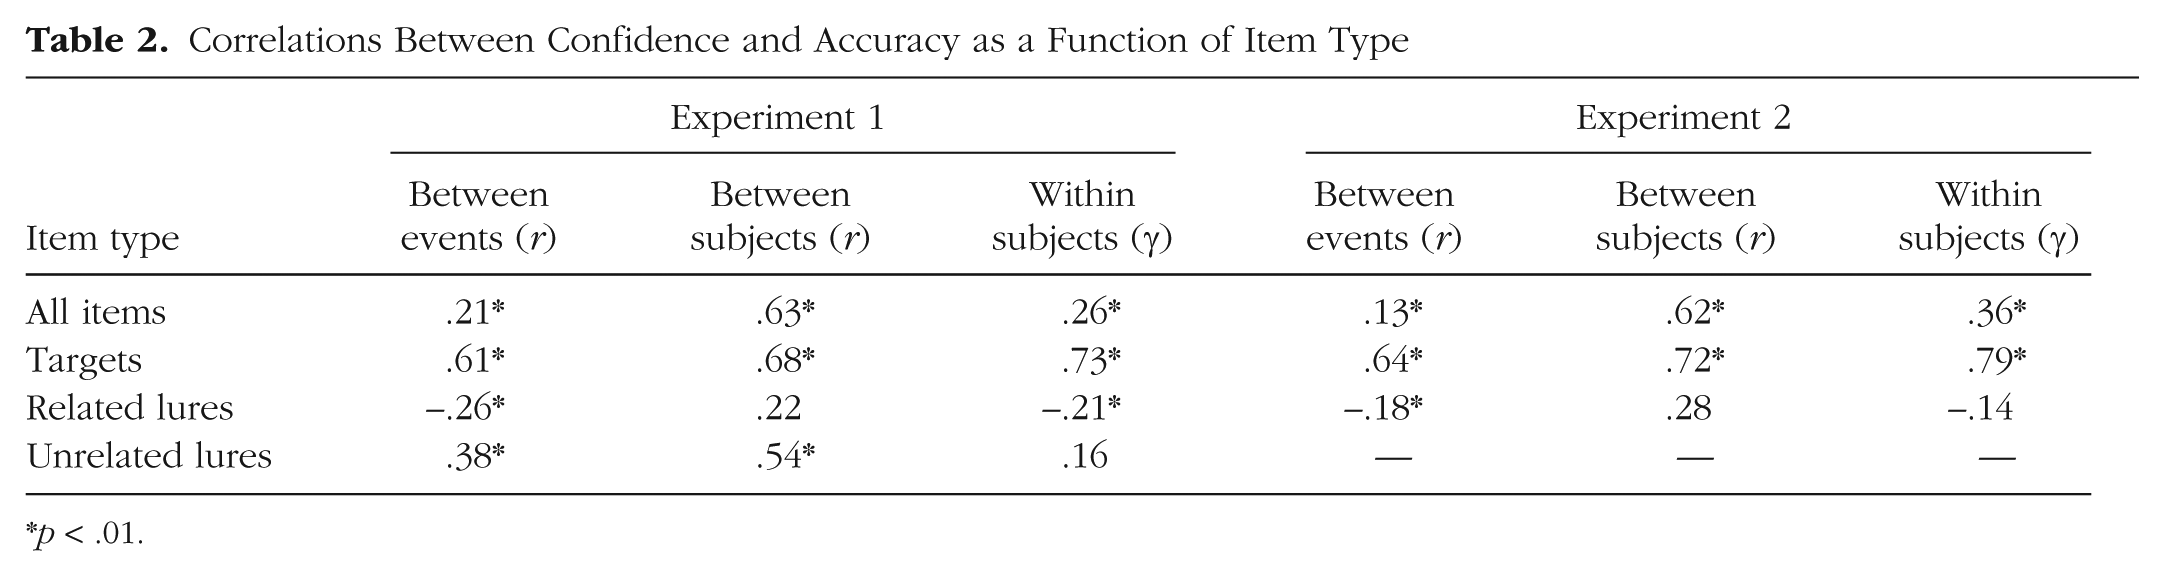
We analyzed the relationship between confidence and accuracy in the ways detailed in our earlier work (Roediger et al., 2012; see also Roediger & DeSoto, 2014). First, we looked at the between-events correlation, which indicates the degree to which items called “old” with greater confidence were also more likely to be responded to more accurately (or vice versa). Second, we examined the between-subjects correlation, which indicates whether individuals who were more confident were also more accurate. We used Pearson r as the measure for these two analyses. Last, we investigated the within-subjects correlation (also called resolution), which describes the degree to which increases in confidence within individual subjects were associated with more accurate recognition decisions, as measured by a gamma correlation (Nelson, 1984). Although these analyses differ conceptually, each is a valid way of assessing whether and how confidence and accuracy are related.
The results are presented in the left half of Table 2, which shows both the overall correlations (across all items) for the three types of analysis and the correlations for the individual item types (targets, related lures, and unrelated lures). For targets, the table presents the correlation between hit rates and confidence ratings; for both types of lures, the table presents the correlation between correct rejections and confidence ratings. We used correct rejections rather than false alarms for the lure analyses, because we wanted to examine correlations between confidence and accuracy (hence, correct rejections).
Correlations Between Confidence and Accuracy as a Function of Item Type
p < .01.
Many prior publications have reported only overall correlations, collapsing across all item types. Using this global analysis, we found a positive relation between confidence and accuracy, regardless of the method of computation: Increases in confidence were associated with increases in accuracy.
These overall positive correlations masked component correlations that differed in direction and magnitude, however. In general, the relation between confidence and accuracy for targets was strongly positive, more so than the correlation across all items. Likewise, the correlation between confidence and accuracy was high for unrelated lures (in two of the three methods of analysis). In contrast, the confidence-accuracy correlation for related lures was negative in two methods of analysis. This means that subjects were more confident when incorrectly responding “old” than when correctly responding “new” to related lures. Especially noteworthy are the between-events confidence-accuracy correlations. The correlation for targets represents the confidence-accuracy relationship for the 240 category items when they were studied (r = .61), and the correlation for related lures represents the relationship for the exact same 240 items when they were lures (r = −.26). These values signify that both positive and negative correlations between confidence and accuracy can be found for the same materials. Scatter plots showing the relation between accuracy and confidence for these two item types are presented in Figure 1.
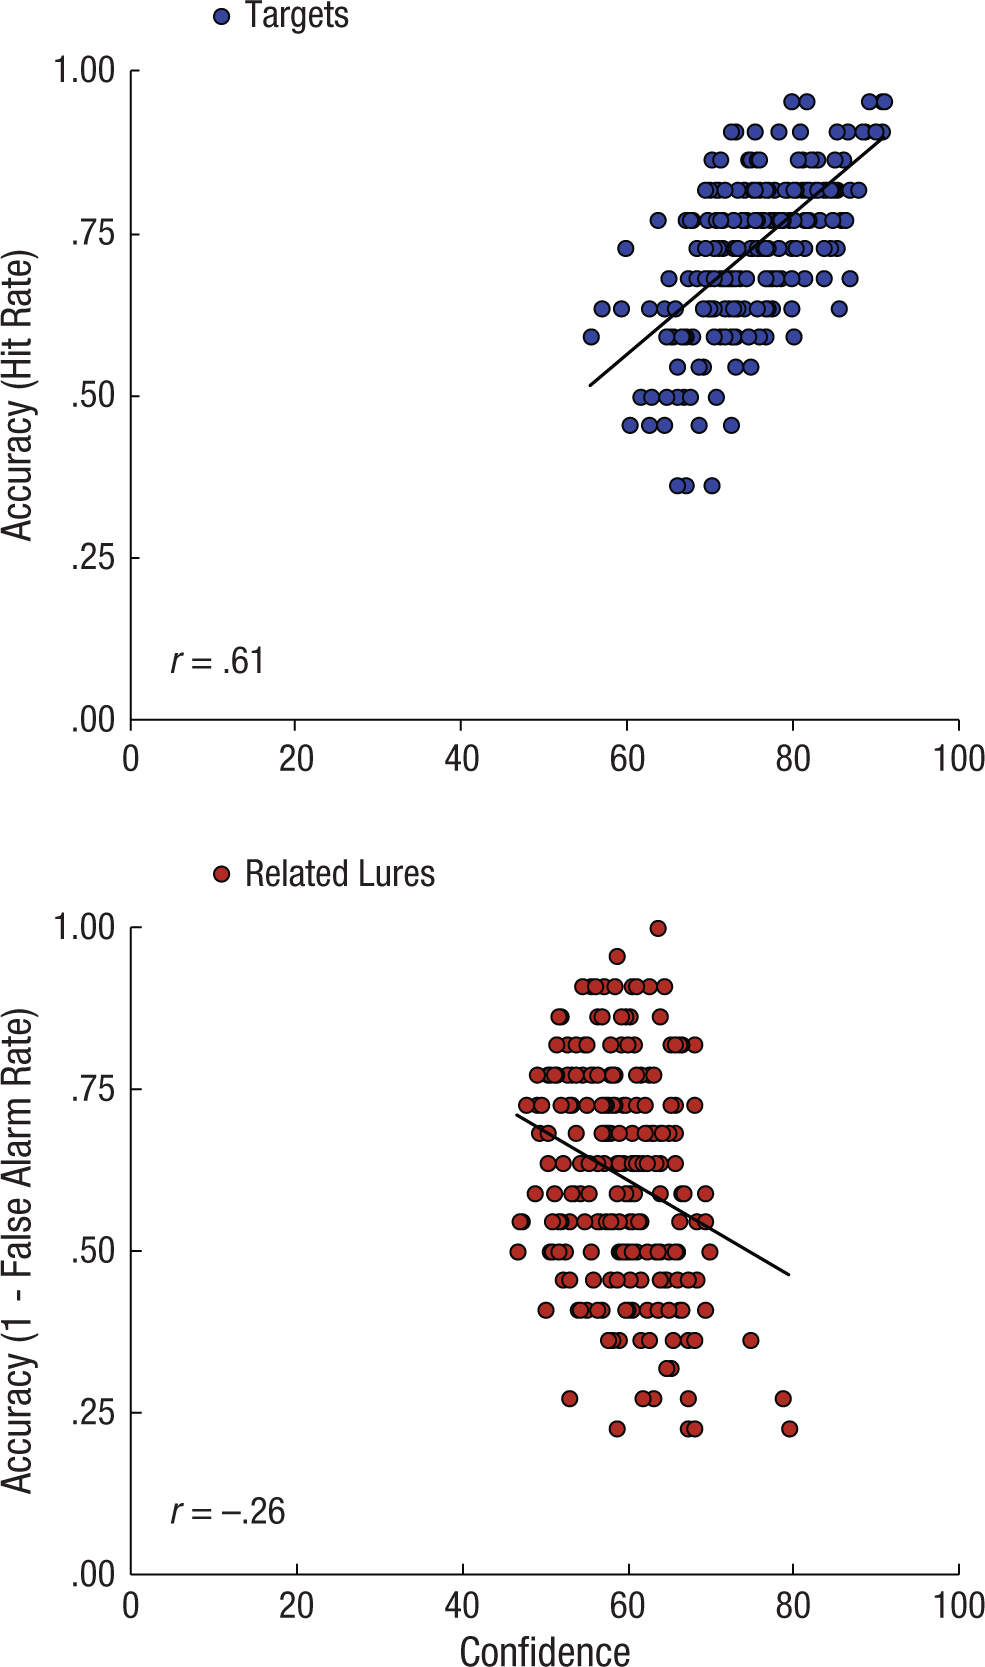
Scatter plots (with best-fitting regression lines) illustrating the between-events confidence-accuracy correlations for the same 240 category items when they were studied (targets) and unstudied (related lures) in Experiment 1. Each point represents an individual item.
The between-subjects correlation between confidence and accuracy (hits or correct rejections) was always positive, although for related lures the correlation was not significantly different from zero. Thus, subjects who were most accurate tended to be most confident (and vice versa). The within-subjects correlations (resolution) followed a similar pattern in three of the analyses. Gamma correlations were positive for targets and weakly (not significantly) positive for unrelated lures, but the confidence-accuracy correlation was inverted for related lures, as in the between-events analysis: When individual subjects were most confident in responding to related lures, they were the least accurate.
These findings are interesting because they demonstrate that positive, null, and negative correlations between confidence and accuracy are all possible within the same experiment using the same materials, depending on the type of analysis conducted. In this particular case, we obtained positive and negative correlations using the exact same items—the only thing that differed was whether the items were targets or lures.
Effects of response frequency rank on false alarm rates
Our results indicated that subjects were highly confident when responding “old” (i.e., committing false alarms) to related lures. To investigate the possible mechanisms driving this effect, we examined the relation between response frequency rank in the category norms and false alarm rate, collapsing across the 12 lists. This analysis was suggested first by S. M. Smith et al. (2000), who wrote, “The use of categorized study lists makes it . . . possible to systematically observe the effects of gradations in the strength of items from the category” (p. 389). Figure 2 shows that the false alarm rate dropped as a function of response frequency rank of the related lures, from roughly .50 to nearly .25, r(18) = −.90, p < .001. Thus, as Smith et al. previously showed (albeit over a different range of response frequency ranks), the items most likely to generate false alarms are those most frequently produced in norming studies. Although not shown in Figure 2, confidence ratings for false alarms tracked response frequency rank, too, r(18) = −.66, p = .002.
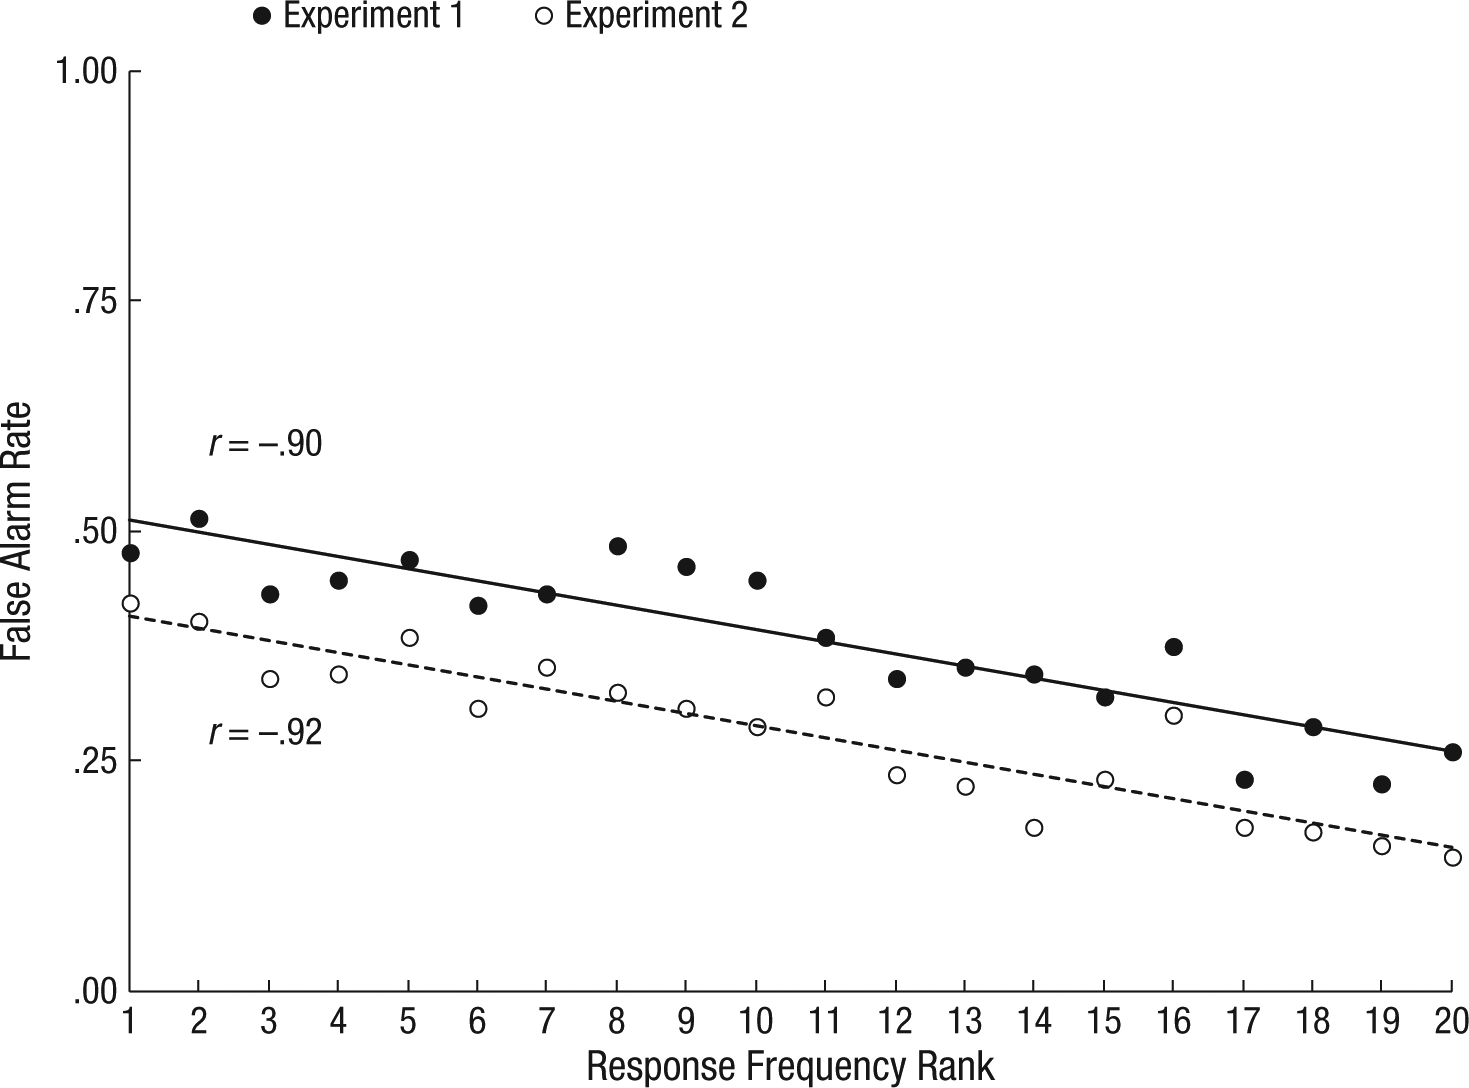
False alarm rate for related lures as a function of response frequency rank in Experiments 1 and 2. An item with response frequency rank of 1 is a frequently mentioned item from a category; an item with response frequency rank of 20 is infrequently mentioned.
Experiment 2
Experiment 1 demonstrated that positive, null, and negative correlations between confidence and accuracy can be obtained with the same subjects and items. The negative correlation was driven primarily by high confidence ratings assigned to false alarms to related lures, especially those of high response frequency rank. What led to the high rate of confident false alarms, however? One possible explanation is that the inclusion of the unrelated lures, which accounted for one third of the entire test set and half of the lures, affected subjects’ responding. Specifically, subjects may have adopted a liberal criterion for items from studied categories at test and tended to accept these items as being old regardless of whether they were actually studied. After all, compared with the unrelated lures, the related lures would have seemed highly similar to the studied items. Thus, because fine discriminations may not have been required by the procedure of Experiment 1, we decided to conduct the experiment again without including unrelated lures on the test. Also, because no one previously has reported both positive and negative correlations between confidence and accuracy using exactly the same materials, replication was in order. As faithful readers of Psychological Science now know, if they did not before, replication of one’s results, and especially of surprising results, is A Good Thing. 1
Experiment 2 used the same general procedure as Experiment 1, but without the 120 unrelated lures on the recognition test. This change was intended to eliminate subjects’ ability to respond on the basis of category membership; the new procedure also changed the composition of the test to include half old and half new items, which is more typical for recognition memory experiments. We predicted that removing the unrelated lures might lead subjects to discriminate more carefully between studied and unstudied category members, thereby reducing the false alarm rate for related lures. We were uncertain whether this predicted reduction in the false alarm rate would lead to a different pattern of confidence-accuracy correlations or a pattern similar to that obtained in Experiment 1.
Subjects, materials, and procedure
Twenty-six Washington University in St. Louis undergraduates participated for course credit or payment. The materials used in Experiment 2 were identical to those used in Experiment 1, except that the 120 unrelated lures were omitted from the recognition test. The procedure was also the same. Subjects studied 10 of the 20 items with the highest response frequency rank in each of the 12 categories (either the odd- or the even-numbered items) and were tested over the entire set of 240 items (120 targets and 120 lures). They were not told about the proportions of studied and unstudied items on the test.
Results
Recognition memory performance
The bottom row of Table 1 shows the likelihood of “old” responses and the confidence ratings assigned to “old” responses in Experiment 2. As in Experiment 1, subjects more frequently responded “old” to targets than to related lures, as confirmed by a paired-samples t test, t(25) = 11.18, p < .001, d = 3.42. Confidence tracked with response proportions: Subjects were more confident in hits to targets than in false alarms to related lures, t(25) = 8.78, p < .001, d = 2.12. The false alarm rate for related lures was lower in Experiment 2 (.28) than in Experiment 1 (.39), t(68) = 2.90, p = .005, d = 0.73.
Confidence-accuracy correlations
The right half of Table 2 shows the confidence-accuracy correlations for Experiment 2. The pattern is quite similar to that obtained in Experiment 1; the correlations for all items and for studied items were significantly positive across all three methods of analysis. Additionally, the between-events correlation for related lures was negative, a replication of the critical outcome of Experiment 1. In contrast, however, the within-subjects correlation for related lures was not significantly different from zero (unlike in Experiment 1), although the trend was still negative (−.14 in Experiment 2 and −.21 in Experiment 1).
Effects of response frequency rank on false alarm rates
We again examined the effects of normative response frequency rank on false alarm rates, as we had in Experiment 1. Once again, a strong negative correlation was obtained: Subjects were much more likely to respond “old” to a related lure of higher response frequency rank than to one of lower response frequency rank, r(18) = −.92, p < .001. The overall function was lower than in Experiment 1 (see Fig. 2), but the magnitude of the negative correlation between response frequency rank and false alarm rate was about the same.
General Discussion
Psychologists have often posed the question, “How are confidence and accuracy of memory reports related?” in a way that implies there should be a single answer. Our results show conclusively that this is the wrong way to conceptualize the problem: Depending on the nature of the materials and the method of analysis, one can obtain positive, null, or negative correlations between confidence and accuracy. In previous research, different sets of materials and different methods of analyses have led to varying confidence-accuracy patterns. Our experiments show that a single paradigm can lead to different confidence-accuracy relations for the same materials depending on whether they are studied or unstudied, and depending on which of three methods of analysis is used.
As we have previously pointed out (Roediger et al., 2012), researchers interested in confidence-accuracy correlations usually have used only one or two methods of analysis (e.g., resolution), and sometimes these methods have been poorly suited to answer the research questions posed. Only a few researchers have examined the relation across subjects, and even fewer have examined correlations across sets of items; furthermore, in the latter case, the types of items producing positive correlations were different from the deceptive items producing negative correlations (e.g., Roediger & DeSoto, 2014; Sampaio & Brewer, 2009). We obtained strongly positive and moderately negative correlations between confidence and accuracy with the same set of materials, depending on whether items were studied or not. We also found that the related lures posed a problem for subjects, even as assessed by within-subjects measures (i.e., resolution, measured with gamma correlations). The measures of resolution for these items were negative in these experiments, although significantly so only in Experiment 1. That is, when responding to related lures, individuals tended to express more confidence when they were wrong than when they were right.
How might one understand zero or negative correlations between confidence and accuracy when other researchers have concluded that there is “almost inevitably” (Dunlosky & Metcalfe, 2009, p. 176) a positive correlation between them—which reflects both psychological theory and common sense? The general answer is that confidence-accuracy inversions will occur when information cued by lures on a recognition test overlaps considerably with the information about events stored in memory (in the language of the encoding-specificity principle; Tulving & Thomson, 1973). Such matching is often indicative of a correct retrieval, so people rely on the degree of match as an indication of both correctness and confidence. False memories arise in part when lures resemble target events either perceptually or conceptually, and thus the match between cue and trace information signals that the event has been experienced previously when it has not.
In the current experiments, items high in response frequency rank were generally prototypical members of categories, and thus features extracted from them on the recognition test overlapped considerably with common features of studied members of those categories. This matching principle may have led to the graded decrease in false alarm rate with decreasing response frequency rank (Fig. 2). Similar processes are doubtless at work in other paradigms in which materials are associatively related (Roediger & McDermott, 1995), orthographically and phonologically related (Sommers & Lewis, 1999), or both (Watson, Balota, & Roediger, 2003). The close match between cues at test and stored information can lead to high levels of false recognition and high confidence in those responses; in some paradigms, it can even lead subjects to say they remember the moment of occurrence of events that never occurred (Roediger & McDermott, 1995).
Outside the psychological laboratory, confidence in a memory is often taken as a proxy for its accuracy. For example, the U.S. Supreme Court ruled in Neil v. Biggers (1972) that highly confident eyewitness identifications are likely to be accurate. This is a claim that has been contested in many prior publications (e.g., Wells & Murray, 1983), and as we have shown in our experiments, whether confidence and accuracy are positively correlated, negatively correlated, or uncorrelated depends on the materials and the method of analysis. When people try to judge recognition lures that are quite similar to items that they did experience, they are especially likely to be fooled: They will often make errors and be highly confident in them. Of course, our experiments involved word lists and not faces or other materials that would be more telling in debates about confidence and eyewitness memory, but the point about similarity issues in lineups has been raised many times (see Buckhout, 1974).
In sum, our research has provided a paradigm and set of analytic techniques that permit examination of positive, null, and negative correlations between confidence and accuracy, all with same set of word-list materials. We believe it will be useful for both theoretical developments (see Roediger & DeSoto, 2014, for a start) and practical purposes as other sets of materials with similar properties are developed (e.g., faces, objects, and other stimuli that vary in similarity in systematic ways).
Footnotes
Acknowledgements
The first author can be contacted at http://www.andydesoto.com/ or on Twitter at ![]() . This article is based on a master’s thesis by the first author under the direction of the second author. Larry Jacoby and Ian Dobbins were other committee members, and we appreciate their constructive advice. We appreciate the comments of Karen Mitchell and John Wixted on an earlier version of the manuscript. We are grateful to Leonel Garcia-Marques, Adam Putnam, Yana Weinstein, John Nestojko, Pooja Agarwal, Megan Smith, Jason Finley, Victor Sungkhasettee, Rebecca Koenig, and other members of the Washington University in St. Louis Behavior, Brain, & Cognition program for their feedback and assistance. Thanks also go to Paige Madara, Zoe Tabachnick, Robyn Husa, and Kelly Young for their help with data collection.
. This article is based on a master’s thesis by the first author under the direction of the second author. Larry Jacoby and Ian Dobbins were other committee members, and we appreciate their constructive advice. We appreciate the comments of Karen Mitchell and John Wixted on an earlier version of the manuscript. We are grateful to Leonel Garcia-Marques, Adam Putnam, Yana Weinstein, John Nestojko, Pooja Agarwal, Megan Smith, Jason Finley, Victor Sungkhasettee, Rebecca Koenig, and other members of the Washington University in St. Louis Behavior, Brain, & Cognition program for their feedback and assistance. Thanks also go to Paige Madara, Zoe Tabachnick, Robyn Husa, and Kelly Young for their help with data collection.
Declaration of Conflicting Interests
The authors declared that they had no conflicts of interest with respect to their authorship or the publication of this article.
Notes
References
Supplementary Material
Please find the following supplemental material available below.
For Open Access articles published under a Creative Commons License, all supplemental material carries the same license as the article it is associated with.
For non-Open Access articles published, all supplemental material carries a non-exclusive license, and permission requests for re-use of supplemental material or any part of supplemental material shall be sent directly to the copyright owner as specified in the copyright notice associated with the article.