



Abstract
Five university-based research groups competed to recruit forecasters, elicit their predictions, and aggregate those predictions to assign the most accurate probabilities to events in a 2-year geopolitical forecasting tournament. Our group tested and found support for three psychological drivers of accuracy: training, teaming, and tracking. Probability training corrected cognitive biases, encouraged forecasters to use reference classes, and provided forecasters with heuristics, such as averaging when multiple estimates were available. Teaming allowed forecasters to share information and discuss the rationales behind their beliefs. Tracking placed the highest performers (top 2% from Year 1) in elite teams that worked together. Results showed that probability training, team collaboration, and tracking improved both calibration and resolution. Forecasting is often viewed as a statistical problem, but forecasts can be improved with behavioral interventions. Training, teaming, and tracking are psychological interventions that dramatically increased the accuracy of forecasts. Statistical algorithms (reported elsewhere) improved the accuracy of the aggregation. Putting both statistics and psychology to work produced the best forecasts 2 years in a row.
The movie Zero Dark Thirty depicts the end of the long hunt for Osama Bin Laden. A Central Intelligence Agency (CIA) operative who has spent years searching for Osama claims that he is living in a compound in Abbottabad, Pakistan. She convinces other people, though the evidence is still uncertain. The CIA director brings a small group together and says, “I’m about to go look the President in the eye, and what I’d like to know . . . is where everyone stands on this thing. Now, very simply. Is he there, or is he not? . . . Yes or no?” The deputy director replies, “We don’t deal in certainty, we deal in probability. . . . I’d say there’s a sixty percent probability he’s there.” Others agree, except for the CIA operative, who says, “One hundred percent, he’s there – okay, fine, ninety-five percent because I know how certainty freaks you guys out – but it’s a hundred!” (Internet Movie Script Database, n.d.).
Governments rely routinely and heavily on intuitive beliefs about high-stakes outcomes. Little is known about how to train the people who make such judgments, largely because scientific evaluations of training methods are expensive, difficult, and seldom conducted (Fischhoff & Chauvin, 2011; Tetlock & Mellers, 2011). A rare opportunity to test forecasting methods—and extend psychology into the geopolitical arena—emerged when IARPA, the Intelligence Advanced Research Projects Activity, sponsored a forecasting tournament. Five university-based research groups competed to find innovative ways to generate the most accurate probabilistic forecasts of high-impact events around the globe. Each group recruited participants to forecast events and devised unique methods to elicit and combine multiple opinions. Each group was then scored on the same accuracy metric, which created a level playing field. This article describes the efforts of our group to embed experiments into the tournament by randomly assigning forecasters to conditions and testing three drivers of accuracy: training, teaming, and tracking.
Training
Coping with uncertainty by improving the accuracy of forecasts is critical for good decision making. The field of judgment and decision making has tested numerous ways to improve intuitive probabilities (Arkes, 1991; Larrick, 2004; Soll, Milkman, & Payne, in press). Promising approaches include statistical training (Fong, Nisbett, & Krantz, 1986), feedback (Benson & Onkal, 1992), exposure to multiple perspectives (Ariely et al., 2000; Herzog & Hertwig, 2009), exposure to historical analogies (Lovallo, Clarke, & Camerer, 2012), decomposition of the problem into subsets (Fischhoff, Slovic, & Lichtenstein, 1978), and explicit consideration of contradictory evidence (Koriat, Lichtenstein, & Fischhoff, 1980).
The forecasting tournament provided an opportunity to test methods of debiasing on a wide range of real-world events extending over long periods. We constructed educational modules on scenario training and probabilistic-reasoning training that drew on state-of-the-art recommendations (O’Hagan et al., 2006). Scenario training taught forecasters to generate new futures, actively entertain more possibilities, use decision trees, and avoid biases such as overpredicting change, creating incoherent scenarios, or assigning probabilities exceeding 1.0 to mutually exclusive and exhaustive outcomes. Probability training guided forecasters to consider reference classes; average multiple estimates from existing models, polls, and expert panels; extrapolate over time when variables were continuous; and avoid judgmental traps such as overconfidence, the confirmation bias, and base-rate neglect. Each training module was interactive and included questions and answers to check participants’ understanding.
Teaming
Numerous studies have shown that predictions based on the aggregate of many people’s judgments are generally more accurate than predictions based on one person’s judgment (e.g., Page, 2007; Soll & Larrick, 2009). This fact leads to a variety of psychological questions. When one has access to many people who make forecasts, how should those people interact in order to generate the most accurate aggregations of predictions? Should they work alone? Should they communicate? When does communication help? When does it hurt? Our research group tested three levels of group influence: no interaction, team interaction, and a compromise approach. Each approach has pros and cons.
When the costs of group interaction exceed the benefits, forecasters should work alone. Independent forecasts will have uncorrelated errors, and those errors should balance out in the aggregate. But independent forecasting means that group members cannot share information, rationales, or processing capacity.
When the benefits of group interaction exceed the costs, forecasters should work in teams. Studies have demonstrated that groups can make process gains when they are cohesive, have strong productivity norms, and share a mental model of the task (Kerr & Tindale, 2004; Levine & Moreland, 1990). Team interaction motivates individuals who wish to perform well in the presence of others (Hertel, Kerr, & Messé, 2000). But teams can suffer from poor dynamics, social loafing (Latané, Williams, & Harkins, 1979), groupthink (Esser, 1998; Janis, 1982), information cascades (Bikhchandani, Hirshleifer, & Welch, 1992), and misplaced competition (McGrath, 1984). Teams have a demonstrated failure to search for unique information, unshared information, or hypothesis-disconfirming information (Kerr, MacCoun, & Kramer, 1996; Stasser & Titus, 1985; Sunstein, 2006).
These approaches stake out extreme positions on the continuum of independence and interdependence. We also examined a compromise approach in which forecasters worked alone, but had knowledge of others’ beliefs. The benefit of this approach is that forecasters have access to a potentially potent signal—the numerical distribution of the crowd’s opinions. But the cost is the risk of mindless “herding,” or free-riding by using a frequent prediction from the group distribution.
Tracking
A large literature on peer effects in the classroom suggests that students benefit from working in cohorts of similar ability levels (see Epple & Romano, 2011, for a review). Grouping students by prior performance can accelerate learning, especially among high achievers (Betts & Shkolnik, 2000). We reasoned that our top “superforecasters” might also benefit from homogeneity of ability. The beneficial effects of tracking would hinge on whether success in geopolitical forecasting was largely attributable to luck or skill. If accuracy was a matter of luck, the predictions of top forecasters in the first tournament (Year 1) would be expected to regress to the mean in the second (Year 2). But if accuracy was a matter of skill, superforecasters would be expected to continue their excellent performance in Year 2 and possibly do even better if they were tracked and consequently working in a much richer intellectual environment.
Method
A 2-year tournament (September 2011–April 2012 for Year 1 and June 2012–April 2013 for Year 2) was conducted. Participants from around the world submitted probability estimates for 199 geopolitical outcomes on the goodjudgmentproject.com Web site; they were encouraged to update their beliefs as often as they wished before the close of each question.
Design
In Year 1, participants were randomly assigned to conditions of a 3 (training: no training, scenario training, or probability training) × 4 (group influence: independent, crowd-belief, team, or prediction-market forecasting) factorial design. Scenario and probability training, administered at the start of the forecasting year, took approximately 45 min, and the modules could be reexamined throughout the tournament. Independent forecasters and crowd-belief forecasters worked alone, but crowd-belief forecasters were given distributional knowledge of others’ forecasts. Team forecasters worked in groups of up to 25 members and interacted on a Web site. Team members could offer rationales and critiques and could share information, including their forecasts (but there was no systematic display of team members’ predictions). Team forecasters received additional training in how to help the group be more accurate by maintaining high standards of evidence and proof. They were taught strategies for explaining their forecasts to others, offering constructive critiques, and building an effective team. Results for prediction-market forecasting are not discussed here.
The Year 2 experiment replicated the most effective approaches in Year 1, examined a new prediction market, and tested tracking separately from regular teams. The design was a 2 (training: no training or probability training) × 3 (group influence: independent, team, or prediction-market forecasting) factorial design, with an additional condition for elite tracking. (Again, results for prediction-market forecasting are not reported here.) Teams were slightly smaller than in Year 1 (i.e., maximum of 15 members). We examined tracking by placing the 60 top performers of Year 1 (5 from each condition) in five teams of 12 members each (superforecaster teams). (See Supplemental Method in the Supplemental Material available online for the instructions and training materials.)
Participants
We recruited forecasters via professional societies, research centers, alumni associations, science blogs, and word of mouth. Entry into the tournament required a bachelor’s degree or higher and completion of a battery of psychological and political tests that took an average of 2 hr. Individuals who met the requirements were largely U.S. citizens (76%) and males (83%); their average age was 36. Almost two thirds (64%) had some postgraduate training. Year 1 participants were invited to participate again in Year 2; we also recruited new participants for Year 2.
Year 1 began with 2,246 participants (1,593 survey respondents and 653 prediction-market traders). Survey respondents were randomly assigned to nine conditions (average of 177 participants per condition). Attrition was 7%. Year 2 started with 1,648 participants (943 survey respondents and 705 prediction-market traders who were either new recruits or returnees). Assignment to conditions proceeded as follows: (a) Year 1 forecasters in conditions that remained in Year 2 stayed put; (b) Year 1 crowd-belief forecasters were randomly assigned to the independent- or team-forecasting condition (unless they were in the top 2% from Year 1 and consequently assigned to the superforecaster condition); (c) forecasters who received scenario training in Year 1 were randomly assigned to no training or probability training; and (d) new recruits were randomly assigned to conditions so that slightly more than 200 were placed in each of the four combinations of training and group influence, 375 were placed in each prediction market, and 60 served in the elite tracking condition. Thus, in Year 2, the no-training condition included some participants who had previously received scenario training, which tipped the scale against finding a statistically significant effect of training. Attrition in Year 2 was only 3%, presumably because most participants (86%) were returnees and quite familiar with the task.
Questions and measures
All forecasters were given the goal of minimizing their average Brier score (Brier, 1950). This score measures individual accuracy; 0 is the best score, and 2 is the worst score. The Brier scoring rule is proper because forecasters are incentivized to report truthfully. Scores are sums of squared deviations between forecasts and reality (occurrence of the event = 1, nonoccurrence of the event = 0), so extreme, incorrect forecasts are heavily punished. If a forecaster said a two-outcome event (i.e., the event occurs or does not occur) was 90% likely to occur (and 10% likely not to occur) and the event did occur, the Brier score would be calculated as (.9 − 1)2 + (.1 − 0)2, which equals .02. If the event did not occur, the Brier score would be (.9 − 0)2 + (.1 − 1)2, which equals 1.62. The sum of these squared deviations was averaged over days and questions for each participant.
Eighty-five and 114 questions closed and were included in the Brier scores in Years 1 and 2, respectively (see Supplemental Method for a list of the questions). Most questions were binomial; the rest were multinomial, with three to five outcomes, or conditional, with two antecedents and two outcomes. Questions remained open for an average of 102 days (range = 2–418 days). Forecasters were asked questions such as, “Will Italy’s Silvio Berlusconi resign, lose re-election/confidence vote, or otherwise vacate office before 1 January 2012?” They predicted the chance the event would occur, on a scale from 0% (certain it will not occur) to 100% (certain it will occur). Participants were encouraged to return to the Web site and update their prediction until the question closed.
Incentives
Forecasters who met the minimum participation requirements received $150 at the end of Year 1 and $250 at the end of Year 2, regardless of their accuracy. Year 2 returnees were given a $100 bonus. Forecasters also received status rewards for their performance via leader boards that displayed the Brier scores for the top 10% of forecasters in each experimental condition and their own score. Those who served in teams (regular teams and superforecaster teams) also saw team Brier scores (defined as medians rather than means, to encourage harmony) for the teams in their condition.
Results
The analyses we present are based on Brier scores, but all main effects and interactions held up with spherical and logarithmic rules, the two next most widely used proper-scoring rules. These rules differ in how severely they penalize extreme overconfidence, with the spherical rule being the most lenient, the logarithmic rule the most punitive, and the Brier scale intermediate. Our findings were robust across all three metrics.
Figure 1 illustrates the effects of training (left side) and teaming and tracking (right side) on standardized Brier scores, averaged over days, questions, and forecasters. Because forecasters chose their own questions, we removed selection effects by standardizing scores within questions. Lower scores indicate greater accuracy.
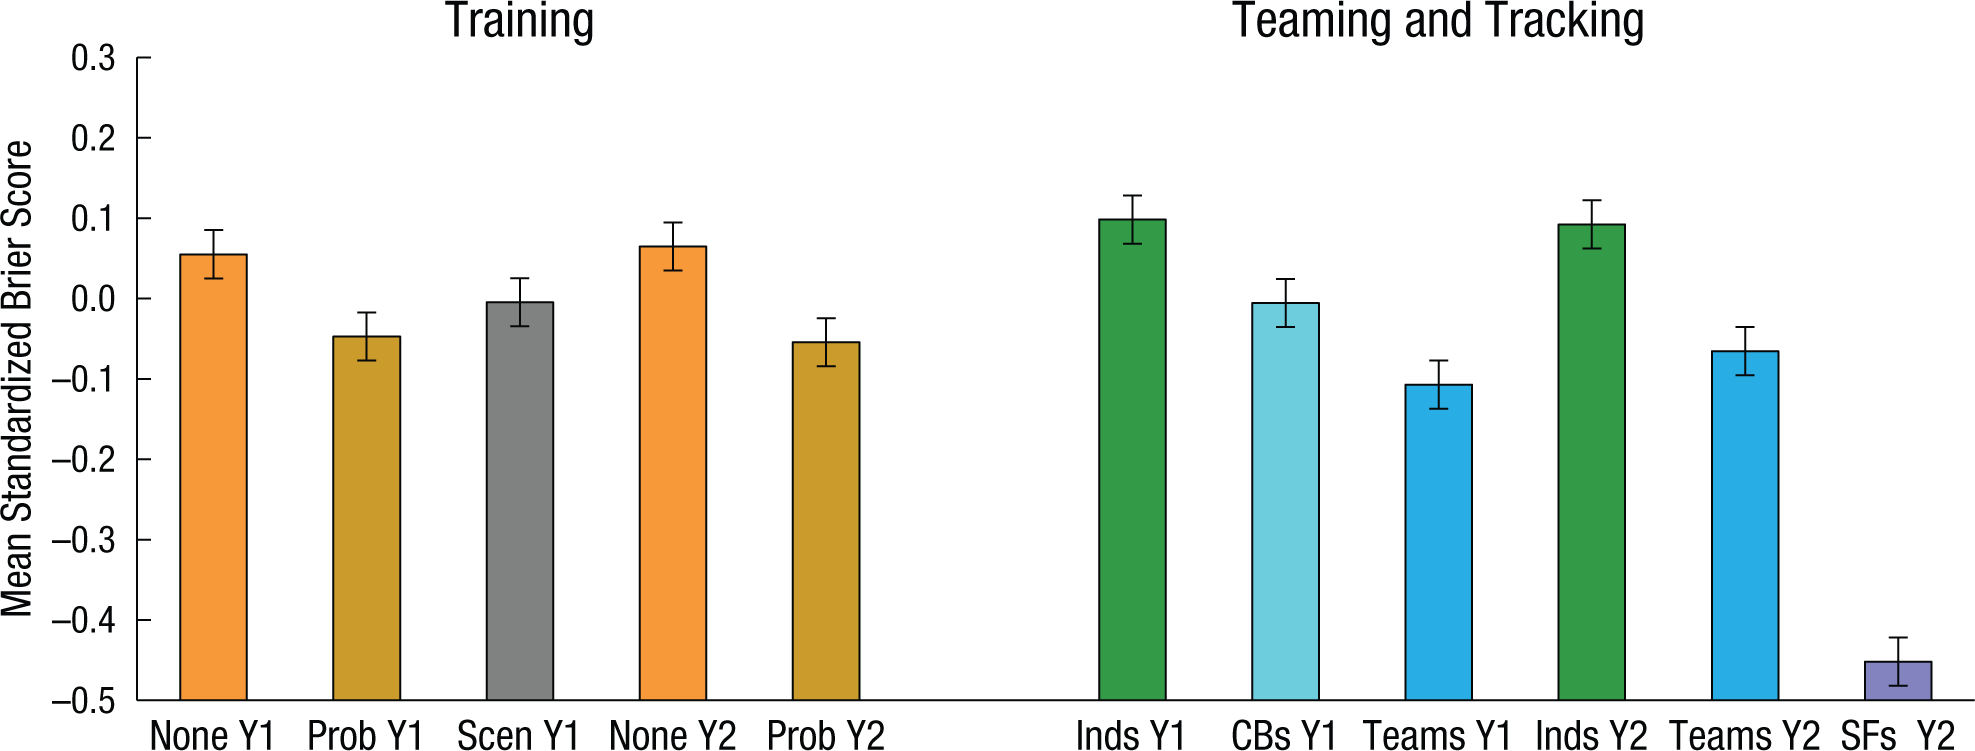
Effects of training, teaming, and tracking on average Brier scores in Year 1 (Y1) and Year (Y2). The bars at the left show results for the no-training (“None”), probability-training (“Prob”), and scenario-training (“Scen”) conditions; the bars at the right show results for independent forecasters (“Inds”), crowd-belief forecasters (“CBs”), team forecasters (“Teams”), and superforecasters (“SFs”). Error bars represent ±2 SEs.
Training
Training improved Year 1 Brier scores, F(2, 1586) = 14.29, p < .001. Probability training was more effective than scenario training, t(1053) = 2.23, p = .026, and scenario training was more effective than no training, t(1056) = 3.25, p < .001. In Year 2, accuracy was better among participants with probability training than among those with no training, F(1, 882) = 19.12, p < .001. Remarkably, a brief probabilistic training module paid off over an extended time (see also Lichtenstein & Fischhoff, 1980).
Teaming
Group influence was also a driver of accuracy in Years 1 and 2, F(2, 1586) = 60.68, p < .001, and F(1, 882) = 62.76, p < .001, respectively. Figure 1 shows that in Year 1, team forecasters were more accurate than crowd-belief forecasters, t(1036) = 5.52, p < .001, and crowd-belief forecasters were more accurate than independent forecasters, t(1120) = 5.92, p < .001. Communication allowed participants to motivate one another, share news articles, and exchange rationales. A greater number of comments made by individuals within teams was associated with greater accuracy, r = −.19 in Year 1 and –.22 in Year 2, t(471) = −5.08, p < .001, and t(415) = −5.24, p < .001, respectively. (Recall that lower scores indicate greater accuracy.) Greater accuracy in teams was due to members who gathered and shared information, encouraged one another, and discussed issues. In addition to showing a main effect of group influence, Year 2 data showed an interaction between training and group influence, F(1, 882) = 5.78, p = .018. Predictions of untrained, independent forecasters were much less accurate than predictions of all other forecasters.
Training and teaming over time
As noted, questions remained open for an average of about 3 months. Therefore, training and teaming could have had beneficial effects at different points in the life cycle of a question. For example, training might have been most effective early, by teaching forecasters to consider multiple reference classes. Team interaction might have been most helpful later on, after individuals had time to gather information. To find out whether the timing of training and teaming effects differed, we computed Brier scores for forecasts made in the first week, the middle 2 weeks, and the last week for all questions that remained open for at least a month. Table 1 summarizes these average scores.
Average Brier Score Accuracy by Time Period in Years 1 and 2
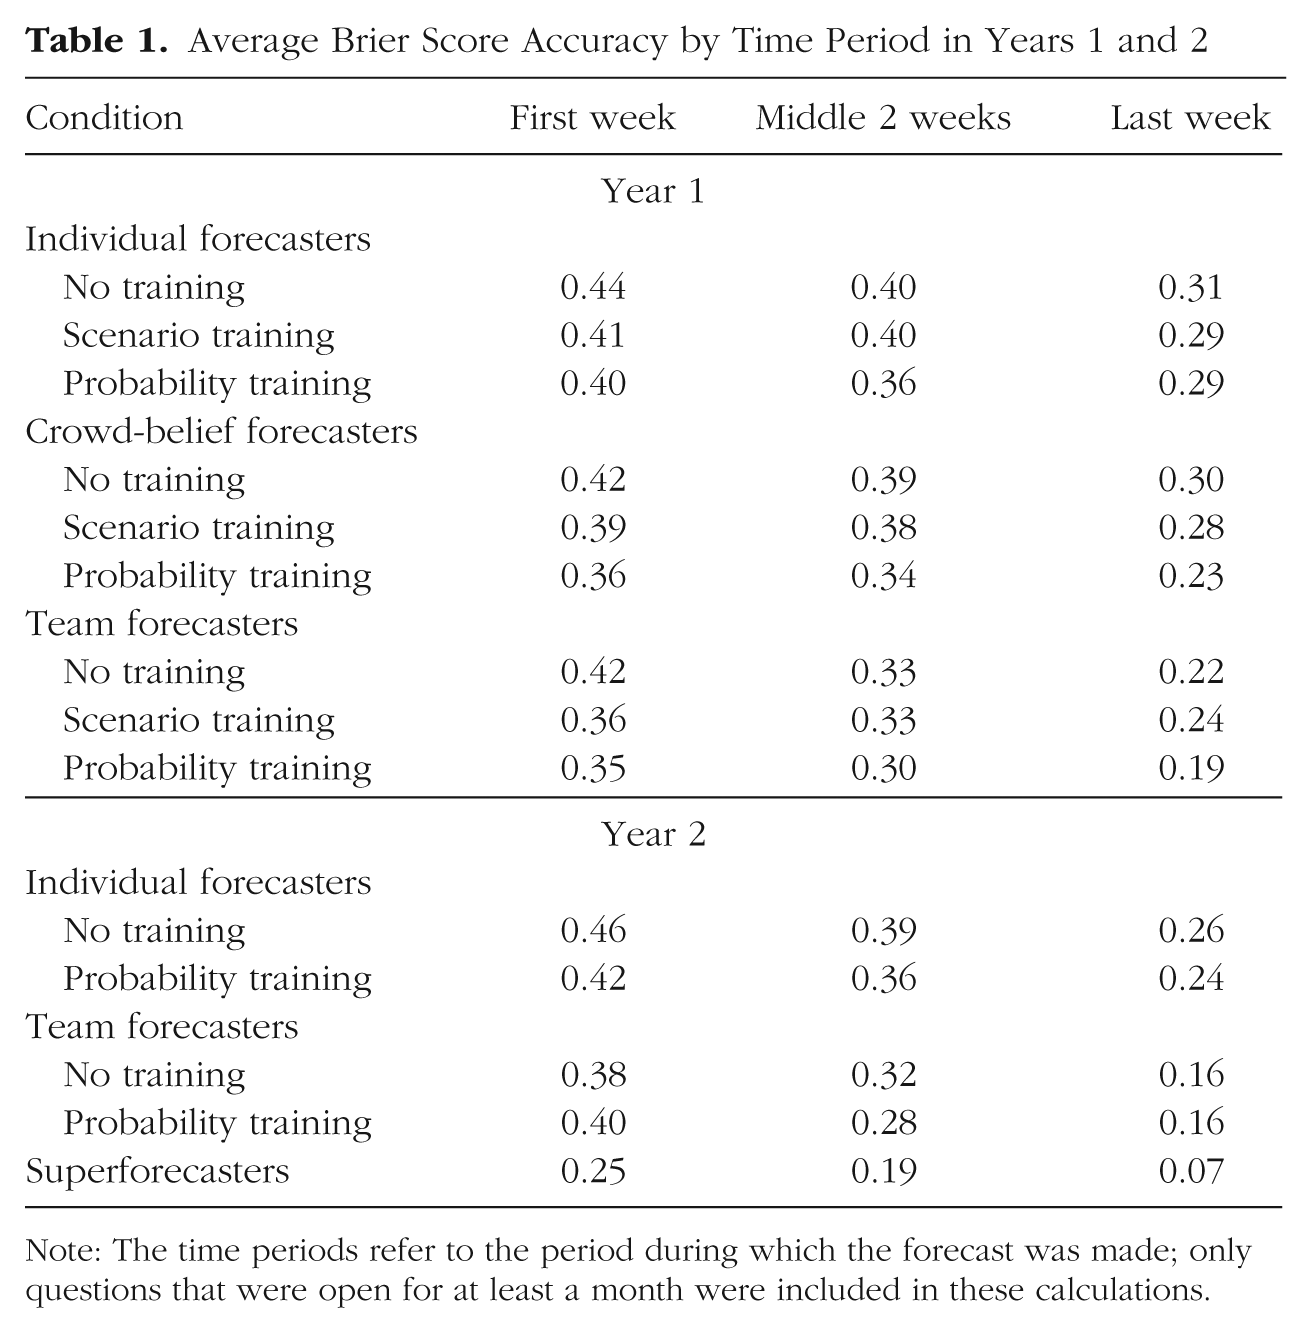
Note: The time periods refer to the period during which the forecast was made; only questions that were open for at least a month were included in these calculations.
Team interaction improved forecasts in all three periods of Year 1, F(2, 1463) = 11.130, p < .001; F(2, 1583) = 8.30, p < .001; and F(2, 1583) = 4.56, p < .011, as well as in all three periods of Year 2, F(1, 832) = 9.74, p = .002; F(1, 882) = 27.43, p < .001; and F(1, 834) = 27.34, p < .001. Training improved forecasts in all periods of Year 1, F(2, 1463) = 6.20, p < .001; F(2, 1583) = 7.76, p < .001; and F(2, 1583) = 6.24, p < .002, and in the middle period of Year 2, F(1, 882) = 6.10, p = .014. In short, both team interaction and training were generally beneficial throughout the duration of a question.
It is reasonable to ask whether the beneficial effects of training or teaming were due to the fact that both variables simply encouraged forecasters to make later forecasts (and presumably more informed forecasts) or to update forecasts more often. We addressed this question using regressions in which we predicted Brier scores from dummy variables representing training and teaming. Then we tested whether the effects of training and teaming remained significant when we added predictors for timing (i.e., the date on which the first forecast was made) and updating (i.e., the number of forecasts made per question).
In separate regressions for Years 1 and 2, participants were treated as random effects. For both years, training and teaming remained significant predictors even when timing and updating were included as predictors. For Year 1, probability training, scenario training, crowd-belief forecasting, and team forecasting remained significant predictors, t(1588) = −4.58, p < .001; t(1588) = 2.70, p < .001; t(1588) = −6.72, p < .001; and t(1588) = −10.99, p < .001, respectively. For Year 2, probability training and team forecasting again remained significant predictors, t(883) = −3.38, p < .001, and t(883) = −7.03, p < .001, respectively. Results suggested that our manipulations had beneficial effects over and beyond those of timing and updating.
Tracking
Figure 1 also displays perhaps the most surprising driver of accuracy. The best performers from Year 1 (i.e., the top 2%) were placed together in elite teams in Year 2. These superforecasters outperformed all other groups by a wide margin. There was no evidence of Year 2 regression to the mean; political forecasting appeared to be at least somewhat skill based, and the acquisition of skill accelerated when top performers worked together.
Measures of engagement
Forecasters were required to make predictions for 25 questions annually in order to receive payments, but most participants made considerably more. We looked at the number of questions responded to as a measure of engagement. This number averaged 48 in Year 1 and 65 in Year 2. This measure varied with group influence in Years 1 and 2, F(2, 1583) = 10.48, p < .001, and F(1, 882) = 17.66, p < .001, respectively. Teams attempted fewer questions than individuals (or crowd-belief forecasters in Year 1). Number of questions attempted also varied with training in Year 1, F(2, 1583) = 3.65, p = .026. Forecasters with either form of Year 1 training attempted fewer questions than those without training. A comparison of superforecasters with regular teams in Year 2 showed that superforecasters responded to 95 questions on average, whereas regular teams responded to 61, t(270) = 6.88, p < .001.
Another measure of engagement is the number of predictions made per question. This measure reflects the tendency to sustain attention. The average number of predictions per question was 1.5 in Year 1 and 1.8 in Year 2. This measure varied with group influence in Year 1, F(2, 1583) = 10.17, p < .001. Independent forecasters and crowd-belief forecasters made an average of 1.3 predictions per question, and teams made an average of 1.5. Group influence also had an effect in Year 2, F(1, 882) = 6.23, p = .013. Independent forecasters made an average of 1.4 predictions per question, and regular teams made an average of 1.6. The surprising result was that superforecasters made an average of 7.8 predictions per question. Their engagement was extraordinary.
Decomposition of skill
Brier scores can be decomposed into three additive parts—variability, calibration, and resolution—two of which bear on forecasting skill (Murphy & Winkler, 1987). 1 Variability is a function of the base rate for events. For example, rain is harder to predict in Philadelphia than in Tucson because Philadelphia weather is more variable. Because variability bears on question difficulty rather than skill, we do not discuss it further.
Calibration reflects the degree to which forecasters display appropriate humility. It is the average mean squared error between forecasts for events and the relative frequencies of those events when the forecasts were made. To calculate calibration, we created small probability bins of .500 to .525, .526 to .575, .576 to .625, and so forth. We then computed the mean squared error between forecasts in each bin and the relative frequency of the corresponding events. Zero indicates perfect calibration, and larger scores indicate worse calibration.
Calibration improved with training in Years 1 and 2, F(2, 1586) = 3.16, p = .04, and F(1, 938) = 3.78, p < .05, respectively. In Year 2, calibration also benefited from group influence, F(1, 938) = 7.07, p = .008, and tracking. Superforecasters were better calibrated than forecasters who had received probability training and were working on regular teams, t(293) = 11.03, p < .001. Figure 2 shows calibration curves for binary questions in the three training conditions in Year 1, and Figure 3 shows calibration curves for binary questions in the two training conditions and the superforecaster condition in Year 2. Forecasts were sorted according to predicted likelihood of the event (confidence) and placed in bins. For each bin, the relative frequency of “correct” predictions is plotted; a prediction was considered to be correct if the outcome judged most likely actually occurred (Fischhoff et al., 1978). Note that all points in Figures 2 and 3 fall below the identity lines, which means that forecasters were overconfident; overconfidence was worse among forecasters without training than among those with training.
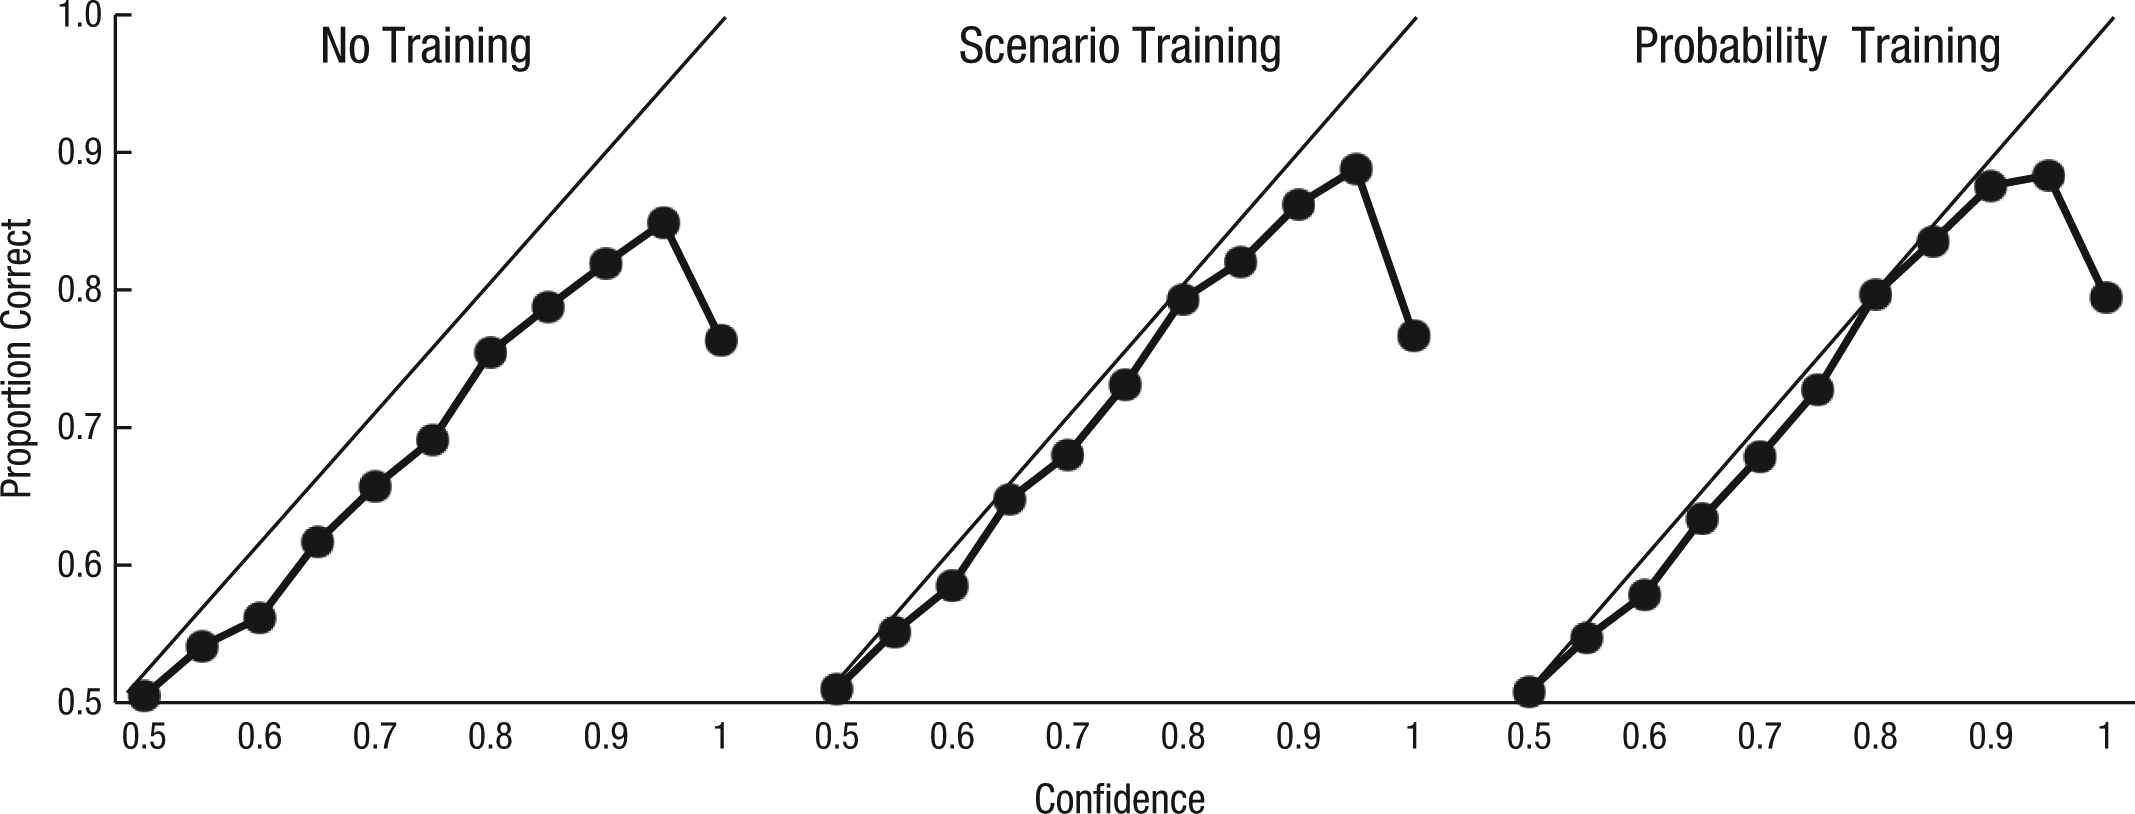
Calibration curves for the three training conditions in Year 1. Forecasts were sorted into bins on the basis of the predicted likelihood of the event (confidence). The proportion of correct forecasts is plotted for each bin. Perfect calibration is represented by the identity line; points below the identity line represent overconfidence. The total numbers of forecasts were 29,997, 27,477, and 25,844 for the no-training, scenario-training, and probability-training conditions, respectively.
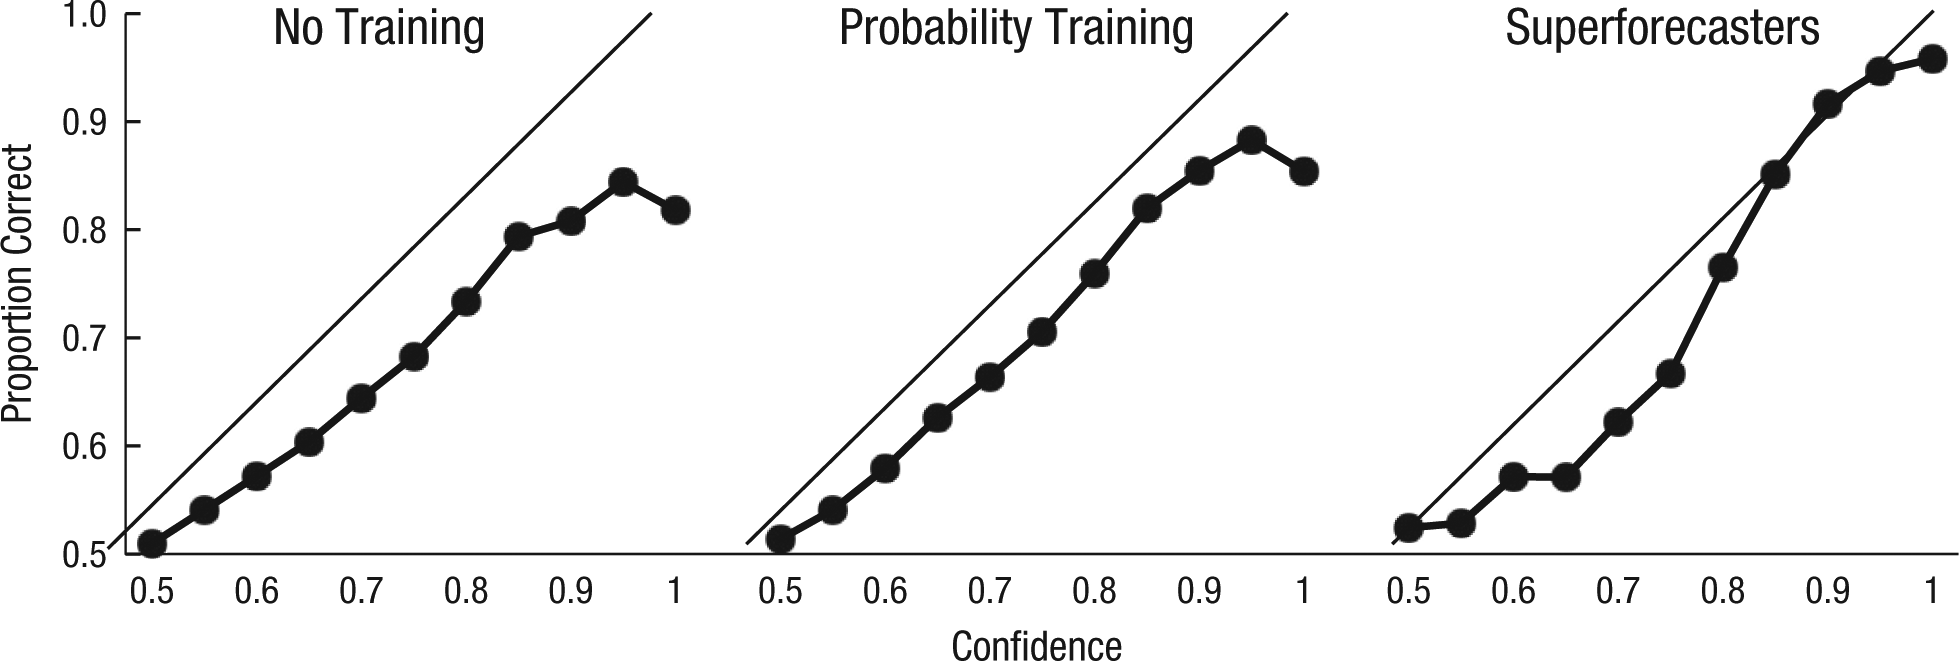
Calibration curves for the two training conditions and the superforecaster condition in Year 2. Forecasts were sorted into bins on the basis of the predicted likelihood of the event (confidence). The proportion of correct forecasts is plotted for each bin. Perfect calibration is represented by the identity line; points below the identity line represent overconfidence. The total numbers of forecasts were 22,888, 23,758, and 4,364 for the no-training, probability-training, and superforecaster conditions, respectively.
Figures 2 and 3 show that calibration tended to be remarkably good. Calibration was worst at forecasts of 100%. The problem was a lack of updating. Forecasts of 100% made in the early days of a question (i.e., first 20% of days) were accurate only about 70% of the time. The same forecasts made in the final 20% of days of a question were correct about 90% of the time. But overall, our geopolitical forecasters were well calibrated. Prior research has shown high calibration among meteorologists predicting rain (Murphy & Winkler, 1984), expert bridge players predicting the chances that they will make a contract (Keren, 1987), and racetrack bettors predicting the winning horse (Johnson & Bruce, 2001). In each of these prior studies, individuals obtained systematic, unambiguous feedback over repeated occasions. Our forecasters also received clear feedback (their Brier scores), and they, too, benefited from extended learning opportunities.
Resolution, the third component of the Brier score decomposition, represents appropriate decisiveness, or skill at differentiating signals from noise. Higher scores indicate greater resolution (see Fig. 4 for average scores). Resolution varied with group influence in Year 1, F(2, 1586) = 78.53, p < .001, and Year 2, F(1, 871) = 60.92, p < .001. Resolution also varied with training in both years, F(2, 1586) = 18.50, p < .001, and F(1, 871) = 16.23, p < .001, respectively. Tracking also enhanced resolution, t(293) = 4.12, p < .001. It is clear that superforecasters’ accuracy was in large part due to their greater resolution relative to all other groups. In sum, calibration and resolution both benefited from training, teaming, and tracking.
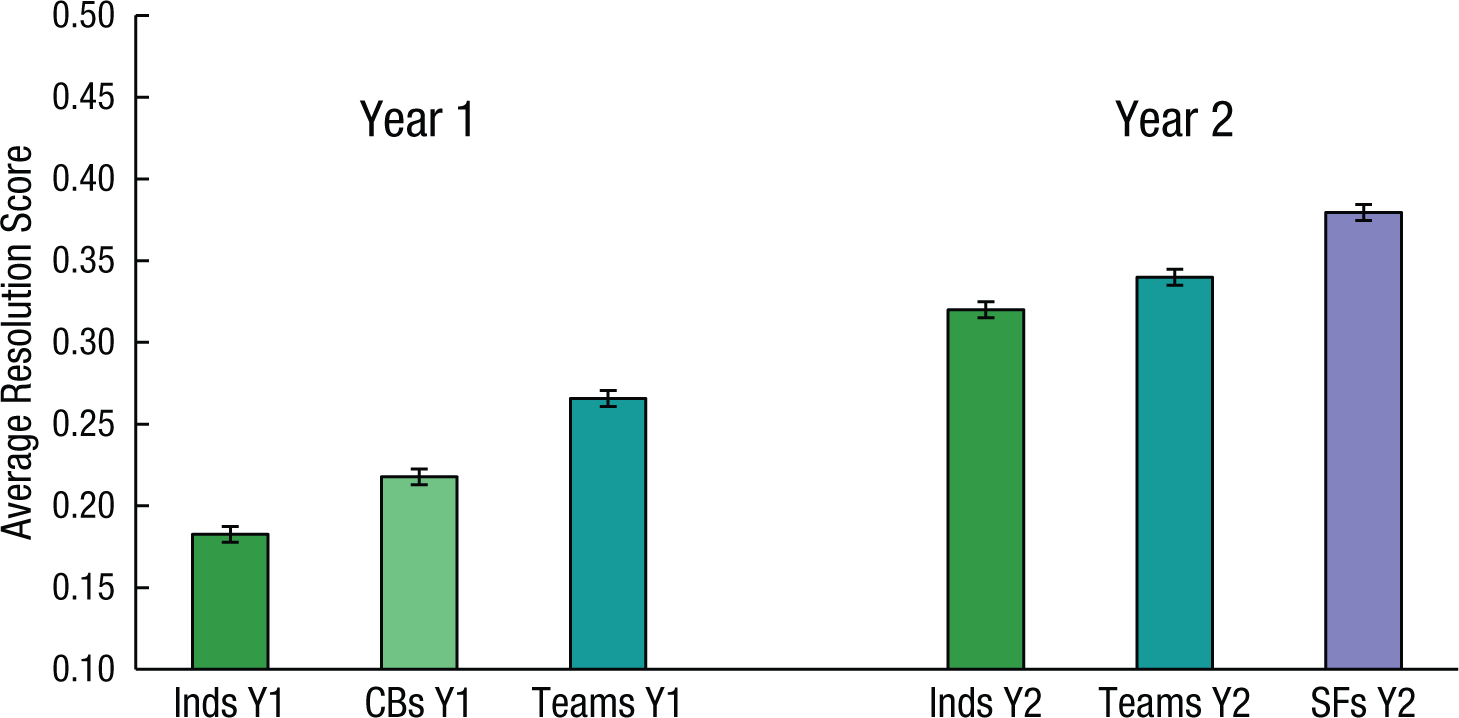
Average resolution score as a function of group influence (“Inds” = independent forecasters; “CBs” = crowd-belief forecasters) in Year 1 (Y1) and as a function of group influence and tracking (“SFs” = superforecasters) in Year 2 (Y2). Error bars represent ±2 SEs.
Discussion
This article reports the first long-term, real-world tests of the efficacy of three psychological manipulations—training, teaming, and tracking—in improving the accuracy of geopolitical forecasts. All three manipulations significantly reduced forecasting errors. The most impressive aspect of training was that, although the module took only about 45 min to complete, the benefits lasted across two periods (each about 8 to 10 months long). Results strongly disconfirm the expectations of pro-independence theorists. Team forecasters were more accurate than crowd-belief forecasters, and crowd-belief forecasters outperformed independent forecasters. Team communication produced enlightened cognitive altruism: sharing of news articles and exchange of rationales. Finally, the pooling of top performers into elite teams with the exalted title of “superforecasters” was the equivalent of a “steroid injection.” Communication, effort, and engagement reached levels that far exceeded our wildest expectations.
Other factors also contribute to good forecasting. Dispositional variables predict skill. Our participants came from a wide range of backgrounds and fields of education. Better forecasters had higher scores on measures of fluid and crystallized intelligence and open-mindedness (results discussed in Mellers, Stone, Metz, Ungar, & Tetlock, 2013). Also, certain statistical algorithms are better than others. As reported elsewhere, our best algorithm in this competition assigned differential weights to forecasters, applied a temporal discounting function, and included a nonlinear transformation that “extremized” the aggregate predictions (for discussion of these statistical algorithms, see Baron, Ungar, Stone, Mellers, & Tetlock, in press; Satopää et al., 2014; and Satopää, Jensen, Mellers, Tetlock, & Ungar, in press).
No one knows how much further improvement is possible in geopolitical forecasting—or how close research is to the optimal forecasting frontier. There are almost certainly pockets of inherent uncertainty in our questions that made it impossible to achieve perfect or near-perfect Brier scores.
Consider a Year 1 question, introduced on September 1, 2011, that asked whether there would be a lethal confrontation (i.e., one resulting in at least one civilian death) of government forces in the South or East China Sea by December 31, 2011. Our best-performing forecasters initially assigned low probabilities to this event (roughly 20%, which reflects the base rate of such events in 4-month periods) and gradually decreased their probability estimates with the passage of time. On December 11, a South Korean coast guard officer was stabbed to death with a shard of broken glass by a Chinese fisherman apprehended for operating illegally in South Korean waters. The murder caught everyone by surprise. Trained teams received an average Brier score of 1.44 on this question, performing even worse than untrained, independent forecasters, who received an average Brier score of 1.31. This question is an example of what Kahneman and Miller (1986) deemed close-call counterfactuals, events that human observers can easily imagine turning out otherwise, and illustrates the difficulty of making accurate predictions in a geopolitical forecasting tournament.
In closing, some methods of geopolitical forecasting really are better than others. We used training, teaming, and tracking to improve forecasts that were then aggregated with statistical algorithms. Our psychological interventions reduced the errors in individual forecasts for events ranging from military conflicts and global leadership changes to international negotiations and economic shifts. Statistical algorithms for combining individual forecasts reduced errors in aggregations (Baron et al., 2014; Satopää et al., 2014; Satopää et al., in press). The best approach to geopolitical forecasting relied on a combination of psychological interventions and statistical algorithms. To improve geopolitical forecasts, one needs insights from both statistics and psychology.
Footnotes
Acknowledgements
We thank David Scott, David Wayrynen, Janna Rapoport, and Phillip Rescober for valuable assistance and Wes Hutchinson for helpful comments and suggestions.
Declaration of Conflicting Interests
The authors declared that they had no conflicts of interest with respect to their authorship or the publication of this article.
Funding
This research was supported by the Intelligence Advanced Research Projects Activity (IARPA) via the Department of Interior National Business Center (DoI/NBC) Contract No. D11PC20061. The U.S. government is authorized to reproduce and distribute reprints for government purposes notwithstanding any copyright annotation thereon. The views and conclusions expressed herein are those of the authors and should not be interpreted as necessarily representing the official policies or endorsements, either expressed or implied, of IARPA, DoI/NBC, or the U.S. government.
Open Practices
We are in the middle of a 4-year forecasting tournament with thousands of forecasters and hundreds of thousands of forecasts. We have multiple ongoing projects, and if the data are made publicly available now, other team members may have their projects jeopardized. We feel that, in this case, it is fair to make the data publicly available after data collection is completed and team members have had the opportunity to publish their results first. Then, we will make the data publicly available. If someone wants to analyze data from our study before that time, we will work with him or her to share as much as possible and make sure that existing projects are not compromised. The complete Open Practices Disclosure for this article can be found at  .
.
Notes
References
Supplementary Material
Please find the following supplemental material available below.
For Open Access articles published under a Creative Commons License, all supplemental material carries the same license as the article it is associated with.
For non-Open Access articles published, all supplemental material carries a non-exclusive license, and permission requests for re-use of supplemental material or any part of supplemental material shall be sent directly to the copyright owner as specified in the copyright notice associated with the article.
