
Abstract
The ability to move upward in social class or economic position (i.e., social mobility) is a defining feature of the American Dream, yet recent public-opinion polls indicate that many Americans are losing confidence in the essential fairness of the system and their opportunities for financial advancement. In two studies, we examined Americans’ perceptions of both current levels of mobility in the United States and temporal trends in mobility, and we compared these perceptions with objective indicators to determine perceptual accuracy. Overall, participants underestimated current mobility and erroneously concluded that mobility has declined over the past four decades. These misperceptions were more pronounced among politically liberal participants than among politically moderate or conservative ones. These perception differences were accounted for by liberals’ relative dissatisfaction with the current social system, social hierarchies, and economic inequality. These findings have important implications for theories of political ideology.
Keywords
The American Dream, the notion that any individual can—with hard work, perseverance, and sound judgment—move up the social ladder, defines the United States’ national ethos. But data from multiple sources suggests that belief in unbounded social mobility is naive. One’s starting position clearly predicts ones’ finishing rank: The correlation between parents’ income level and their children’s income level later in life is approximately .5 (Sawhill, 2008). In cross-national comparisons of intergenerational mobility rates, the United States falls at about the median, lagging behind many European nations, including Denmark, France, and Sweden (Corak, 2006; Isaacs, 2008). Moreover, many are beginning to doubt that America is the “land of opportunity” envisaged by its founders: A recent Gallup poll (Dugan & Newport, 2013) found that only 52% of Americans agreed that there is plenty of opportunity for the average person to get ahead in life—down from 81% a mere 15 years earlier, and the lowest level in over six decades.
In addition, fewer Americans—including those in the middle class—believe they can maintain their standard of living and are less hopeful that their children’s standard of living will surpass their own (Pew Research Center, 2012). Reflecting this belief in declining social mobility and growing inequality between social classes, the general public and many politicians, including President Obama in his 2014 State of the Union address, have begun calling for legislative action. However, no research has actually checked the accuracy of these public perceptions. That there is little opportunity for upward advancement in America, and less opportunity now than in previous generations, is an assumption that many citizens seem to take for granted. But it is one worth investigating, given the wealth of research demonstrating how faulty perceptions of social and economic conditions, such as the level of wealth inequality that exists in the United States, can be (Eriksson & Simpson, 2012; Norton & Ariely, 2011).
The publication of a recent, multidecade report provided us with an opportunity to compare those public perceptions with economic reality. Chetty, Hendren, Kline, Saez, and Turner (2014a, 2014b) compared the tax records of nearly 40 million American adults with those of their parents 20 years earlier, assessing changes in individuals’ economic position relative to their starting point in life (i.e., their parents’ economic position). They also compared individuals born in different decades, from the early 1970s through the mid 1990s, to assess any generational changes in mobility patterns. First, they found (as have Hertz, 2007; Lee & Solon, 2009) that intergenerational mobility rates have not declined, but in fact remained stable during the three-decade period they examined—contrary to popular belief (Dugan & Newport, 2013; Pew Research Center, 2012). Second, their data revealed that Americans enjoy—depending on one’s perspective—a substantial amount of social mobility. For example, of individuals born to parents in the bottom third of the income distribution (i.e., lower-class parents), 49% remained in the bottom third later in life, whereas 51% moved up to the middle or top third. In other words, despite their disadvantaged backgrounds, half of them were upwardly mobile (though still below the two-thirds one might expect based on the American Dream). Moreover, because they utilized much larger sample sizes, actual tax records (instead of self-reported income), and multiple indicators of mobility (e.g., incomes, college attendance rates), Chetty and colleagues’ study yields more precise estimates of social mobility than prior studies, and their findings are consistent with those of other published reports (Pew Research Center, 2013; U.S. Department of the Treasury, 2007). This makes their study the most appropriate standard to gauge our participants’ perceptual accuracy.
We also aimed to test whether intuitions about social mobility differ as a function of political ideology and, if so, how and why. Gallup polling (Dugan & Newport, 2013) has revealed that political ideology predicts beliefs about social mobility, which suggests that one ideological group’s perceptions may be more distorted than others’ (see also Pew Research Center, 2012). And the social psychological literature describes a pair of complementary theories that make relevant predictions. System-justification theory (Jost, Banaji, & Nosek, 2004) contends that people, especially conservatives, are motivated to defend the status quo; to view the existing social system as fair, just, and legitimate; and to engage in rationalizations to maintain that belief. Similarly, social-dominance theory (Sidanius & Pratto, 2001) contends that people, especially conservatives, are motivated to promote and maintain social hierarchies by rationalizing status differences between groups. According to both theories, one of the core rationalizations is that everyone has equal opportunity to get ahead, and therefore one’s outcomes must reflect something about one’s character or makeup (e.g., work ethic, ability) rather than constraints imposed by the system (e.g., resource disparities, discrimination). These two theories imply that conservatives, who are more satisfied than liberals with the status quo and accepting of inequality, should therefore see greater social mobility than there truly is.
On the other hand, there is good reason to suspect that ideological distortion may be bidirectional (Bartels, 2002; Frenda, Knowles, Saletan, & Loftus, 2013; Frimer, Gaucher, & Schaefer, 2014; Graham, Nosek, & Haidt, 2012; Granberg & Brent, 1983; Kahan, 2013; Morgan, Mullen, & Skitka, 2010; Taber & Lodge, 2006; Toner, Leary, Asher, & Jongman-Sereno, 2013; see also Tetlock & Mitchell, 1993). Everyone seeks to confirm his or her vision of reality—this confirmation bias represents a core aspect of human social cognition (Hart et al., 2009; Lord, Ross, & Lepper, 1979). For instance, liberals, principally unhappy with inequality and the status quo, might well underestimate social mobility for the same reasons theories predict that conservatives will overestimate it. The Gallup poll finding that liberals, more than conservatives, have lost faith in the general fairness of the economic system offers some support for this account (Dugan & Newport, 2013). So does evidence that liberals exaggerate income disparities between the rich and poor more (Chambers, Swan, & Heesacker, 2014) and express greater pessimism about general economic conditions (Duch, Palmer, & Anderson, 2000) than conservatives do. Moreover, liberals disagree more than conservatives with the adage that hard work tends to bring success, in which case they should tend to see less possibility of upward mobility (Feather, 1984; Schlenker, Chambers, & Le, 2012).
In the present investigation, we assessed peoples’ perceptions of both current levels of social mobility in the United States (i.e., the percentage of Americans who migrate from one social class to another) and recent historical shifts in mobility (i.e., whether mobility in the United States has increased or declined over the past 40 years). We compared their perceptions with findings from Chetty and colleagues’ (2014a, 2014b) report to determine the extent of inaccuracy—if any—in participants’ social-mobility perceptions. In addition, we assessed individual differences in political orientation, system justification, and social-dominance orientation, which permitted us to test whether conservatives overestimate mobility (as implied by system-justification and social-dominance theories), whether liberals underestimate mobility (as implied by research on whether hard work is believed to lead to success), or both (as implied by the bidirectional perspective).
Study 1
Method
Sample
We recruited 410 American adults from Amazon.com’s Mechanical Turk; each was paid a small fee in compensation. Studies have consistently shown that Mechanical Turk users are more diverse and representative of the U.S. population than are convenience samples of college undergraduates (Paolacci & Chandler, 2014), and they produce high-quality survey data (Buhrmeister, Kwang, & Gosling, 2011). Power calculations indicated that a minimum of 400 participants were needed to achieve a power level of .90, with an alpha level of .05 (one-tailed), assuming small effect sizes (d = 0.3). Thus, we recruited until we had attained this minimum sample size (oversampling in both Studies 1 and 2).
Procedure
The survey was divided into three sections. In the first section, each participant was told to imagine a group of American children born in the early 1980s to parents from one of three social classes (the bottom, middle, or top thirds of the income distribution). He or she was then asked to estimate the percentage of children in that group who ended up in the bottom, middle, and top third of the income distribution by the time they reached their mid 20s, with the three category estimates constrained to total 100%. A graphic displaying a hypothetical “income ladder” accompanied the instructions to aid participants in making their judgments (see Fig. 1). This process was repeated until participants made judgments about all three parental-income levels (with order randomized by the survey software). Next, participants were asked whether (and in which direction) they believed social mobility in the United States had changed over the past 40 years (1 = greatly decreased, 2 = slightly decreased, 3 = stayed the same, 4 = slightly increased, 5 = greatly increased).
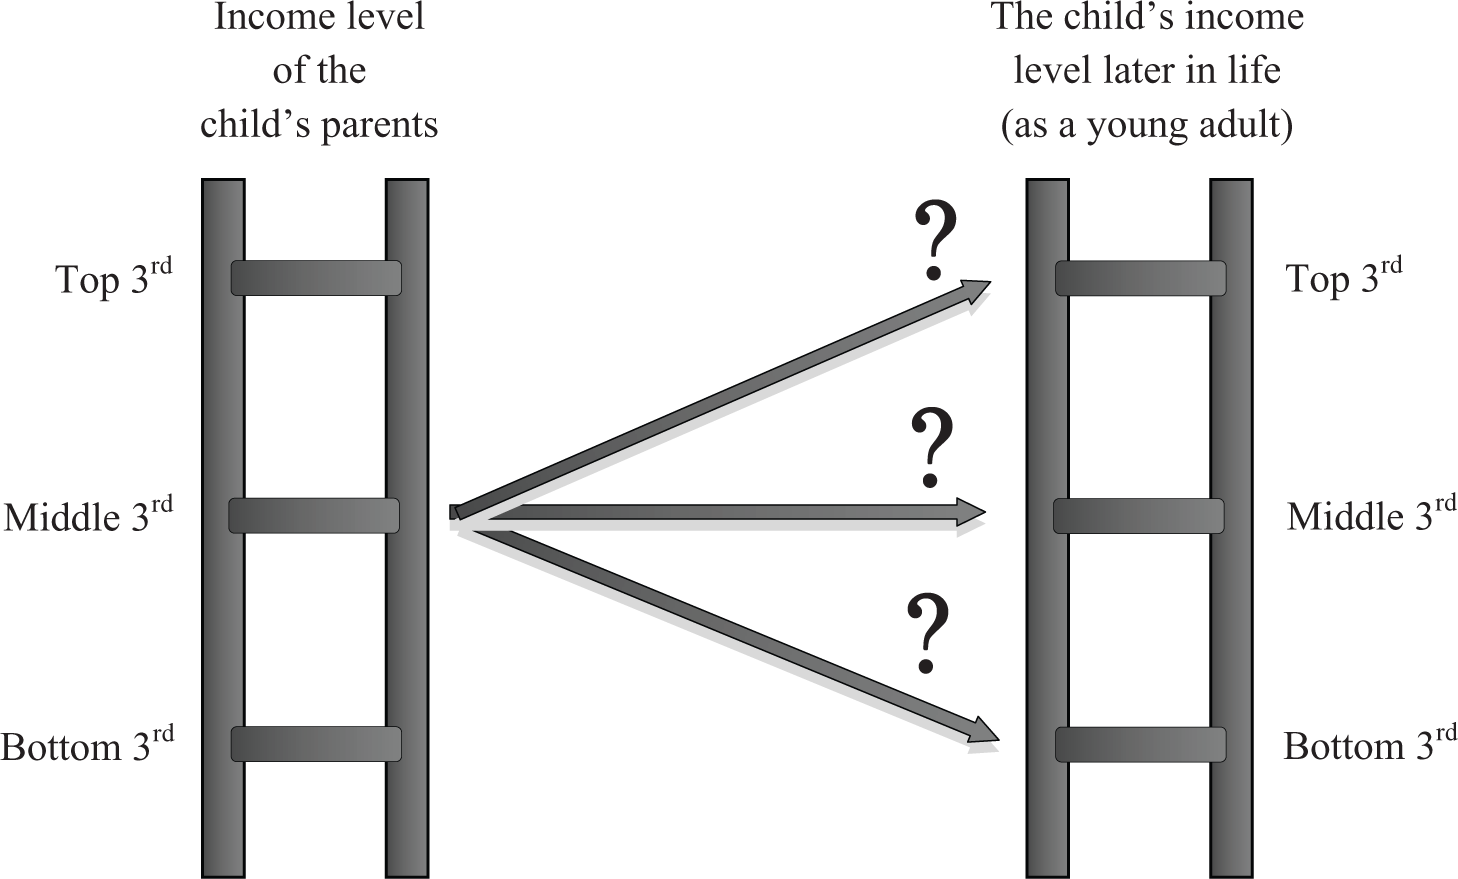
Example graphic shown to participants in Studies 1 and 2, prompting them to indicate the percentage of children born to parents at one of three income levels who would end up at the bottom, middle, and top income levels as adults. The three category estimates were constrained to total 100%. In Study 1, participants provided one set of percentages for each parental-income level, whereas in Study 2, they provided percentages for only one parental-income level.
The next section of the survey contained the 8-item system-justification scale (Kay & Jost, 2003), which assessed participants’ satisfaction with the current social system. Sample items included “In general, you find society to be fair” and “Everyone has a fair shot at wealth and happiness.” Participants rated the items on a scale from 1, strongly disagree, to 5, strongly agree. They also completed the 14-item social-dominance-orientation scale (Pratto, Sidanius, Stallworth, & Malle, 1994), which assessed acceptance of social hierarchies and inequality. Sample items included “This country would be better off if we cared less about how equal all people were” and “This country would be better off if we cared less about increased economic equality” (reverse coded); ratings were made on a scale from 1, very negative reaction, to 5, strongly positive reaction. Scores on the system-justification (α = .87) and social-dominance-orientation (α = .94) scales were each averaged, with higher scores indicating greater satisfaction with the current social system and greater acceptance of social hierarchies and inequality. The final section assessed basic demographic characteristics, specifically political ideology (1, strongly liberal, to 5, strongly conservative), age, gender, education level, household income, race/ethnicity, and political-party affiliation. 1 Table S1 in the Supplemental Material available online provides information on the demographic characteristics of our sample.
Results
In the analyses examining ideological differences, ideology was treated as a continuous variable (using the full range of responses to the 5-point ideological self-description question). However, in certain cases, we report focused comparisons between conservatives and liberals (and moderates), and for these we grouped participants who responded to the ideology question with 1 and 2 as liberals, 3 as moderates, and 4 and 5 as conservatives.
Current social mobility
We analyzed social-mobility judgments in a 3 (parents’ income level) × 3 (child’s income level) fully within-subjects analysis of variance (ANOVA). 2 To control for differences associated with participants’ age, gender, education level, and household income, we included these variables as covariates.
The results, displayed in Figure 2, reveal an overall bias toward underestimating social mobility. That is, participants underestimated the percentage of upwardly or downwardly mobile individuals who transitioned later in life into a different social class from the one they were born into. Correspondingly, they overestimated the number of individuals who were socially immobile, that is, who remained in the same social class they were born into. For example, participants assumed that only 39% of individuals born to lower-class parents were able to make it to the middle or upper classes later in life, when in reality 51% did so, and they assumed that 61% remained in the lower class, when in reality only 49% did so. Although participants underestimated social mobility at all three parental-income levels, their perceptions were especially distorted regarding individuals from middle-class backgrounds, of whom they estimated only 46% transitioned to a different social class, compared with the actual figure of 65%. This pattern was confirmed by a two-way interaction between parents’ and child’s income levels on mobility estimates, F(4, 1620) = 5.99, η p 2 = .02.

Results from Study 1: percentage of children at the bottom, middle, and top income levels later in life as a function of their parents’ income level. The graph shows participants’ estimates (±1 SEM) along with the actual percentages.
As predicted, liberals and conservatives differed in their perceptions of current mobility (see Fig. 3); the two-way interaction mentioned in the previous paragraph was qualified by a three-way interaction with participants’ political ideology, F(4, 1616) = 16.74, η p 2 = .04. 3 All participants, regardless of their political ideology, underestimated social mobility. However, consistent with the bidirectional perspective, results showed that politically liberal participants underestimated mobility to a greater degree than did moderate and politically conservative participants. This was true for all three parental-income levels, except for individuals from middle-class backgrounds (i.e., parents in the middle third). Regarding this category, liberals and conservatives underestimated mobility to an approximately equal degree, t(323) = 0.66, 95% confidence interval (CI) for the difference = [−2.89, 5.81], d = 0.08. Yet the errors they made for this category were in opposite directions and are especially revealing about their intuitions concerning how mobility manifests itself: Liberals underestimated the percentage of individuals from middle-class backgrounds who were upwardly mobile more than did conservatives, t(323) = −3.78, 95% CI for the difference = [−8.72, −2.75], d = 0.38, whereas conservatives underestimated the percentage who were downwardly mobile more than did liberals, t(323) = −2.05, 95% CI for the difference = [−8.38, −0.16], d = 0.25.

Results from Study 1: percentage of children at the bottom, middle, and top income levels later in life as a function of their parents’ income level. The graph shows estimates (±1 SEM) separately for conservative, moderate, and liberal participants along with the actual percentages.
We next tested whether these ideological differences were mediated by attitudes toward the existing social system (i.e., system justification) and toward social hierarchies and inequality (i.e., social-dominance orientation). Consistent with prior research (Chambers, Schlenker, & Collisson, 2013), the present results showed that greater political liberalism was associated with more negative attitudes toward the system (r = .38) and greater opposition to social hierarchies and inequality (r = .48). In turn, negative attitudes toward the social system and opposition to social hierarchies and inequality each predicted perceptions of lower social mobility (see Figs. S1 and S2 in the Supplemental Material). When participants’ scores on system-justification and social-dominance orientation were entered simultaneously as covariates in the model with political ideology, both were involved in independent three-way interactions with parents’ and child’s income level on mobility estimates—system justification: F(4, 1608) = 16.72, η p 2 = .04; social-dominance orientation: F(4, 1608) = 12.10, η p 2 = .03—and they attenuated the three-way interaction with political ideology, F(4, 1608) = 0.77, η p 2 = .02, which provided initial evidence of mediation. Furthermore, when each variable was entered individually in the model with political ideology, each were involved in a three-way interaction—system justification: F(4, 1612) = 24.34, η p 2 = .06; social-dominance orientation: F(4, 1612) = 19.63, η p 2 = .05. Further, each substantially reduced but did not eliminate the three-way ideology interaction—system justification: F(4, 1612) = 4.64, η p 2 > .01; social-dominance orientation: F(4, 1612) = 2.87, η p 2 > .01, which indicates that both are partial mediators.
Changes in social mobility
Overall, participants indicated that social mobility has declined over the past 4 decades, contrary to recent evidence suggesting that it has remained relatively stable (Chetty et al., 2014a, 2014b). Approximately 56% of participants thought that social mobility has declined either “slightly” or “greatly,” compared with only 15% who thought it has remained stable and 29% who thought it has increased to any extent: The mean rating of 2.50 was lower than the scale midpoint of 3, the latter representing a response of no perceived change, one-sample t(409) = −8.13, 95% CI for the difference = [−0.62, −0.38], d = 0.40.
Here, too, the predicted ideological differences emerged. One-sample tests comparing ratings with the midpoint of 3 indicated that liberals erroneously perceived mobility as declining (M = 2.21), t(234) = −10.14, 95% CI for the difference = [−0.94, −0.63], d = 0.66, whereas moderates (M = 2.82), t(84) = −1.24, 95% CI for the difference = [−0.46, 0.11], d = 0.14, and conservatives (M = 2.93), t(93) = −0.55, 95% CI for the difference = [−0.31, 0.18], d = 0.06, accurately perceived it as remaining stable. A larger percentage of liberals (67%) than moderates (44%) or conservatives (40%) thought that mobility had declined either slightly or greatly, and a smaller percentage thought that mobility has either remained stable (liberals: 12%, moderates: 19%, conservatives: 20%) or increased to any extent (liberals: 21%, moderates: 38%, conservatives: 40%). Overall, liberals perceived a greater decline in mobility than either moderates, t(318) = −3.95, 95% CI for the difference = [−0.92, −0.31], d = 0.49, or conservatives, t(323) = −4.92, 95% CI for the difference = [−1.01, −0.43], d = 0.58, whose perceptions did not differ, t(173) = −0.59, 95% CI for the difference = [−0.48, 0.26], d = 0.09.
Negative attitudes toward the social system and opposition to social hierarchies and inequality were both associated not only with political liberalism (as reported in the previous section) but also with the perception of declining mobility (rs = .49 and .25, respectively). In turn, multiple mediation tests revealed that system justification mediated the relation between liberalism and the perception of declining mobility, whereas social-dominance orientation had no unique mediating role (bootstrapped tests of the indirect effects—system justification: b = 0.17, 95% CI = [0.12, 0.23]; social-dominance orientation: b = 0.02, 95% CI = [−0.04, 0.06]).
Study 2
In Study 2, we attempted to directly replicate the results of Study 1, except with several slight methodological changes. First, because participants in Study 1 judged all three parental-income levels, it is possible that their judgments of one category may have influenced their judgments of the other categories. To avoid this potential biasing influence, we asked participants in Study 2 to rate only one category. Second, given that system justification and social-dominance orientation are conceptually and empirically related constructs (Chambers et al., 2013), and because we found evidence for the unique mediating role of system justification, we chose to focus exclusively on this variable in Study 2. Third, whereas political-orientation and system-justification measures came after the key social-mobility judgments in Study 1, we counterbalanced the order of these measures in this study (i.e., either before or after mobility judgments).
Method
We recruited 455 American adults from Amazon.com’s Mechanical Turk, who were paid a small fee in compensation (see Table S1 in the Supplemental Material for sample characteristics). With the exceptions noted in the previous paragraph, the judgment task and measures were identical to those in Study 1.
Results
Responses to the system-justification scale were averaged (α = .85) to form a composite score for each participant. As in Study 1, we included participants’ age, gender, education level, and household income as covariates in all analyses.
Current social mobility
We analyzed mobility judgments in a 2 (order of measures) × 3 (parents’ income level) × 3 (child’s income level) mixed-model ANOVA, with the last factor as the only within-subjects variable. None of the effects of interest were qualified by order of measures, so this variable was dropped from further analyses.
Once again, participants underestimated social mobility (see Fig. 4). At all three parental-income levels, they underestimated the percentage of individuals who migrated into a different social class from the one they were born into, and they overestimated the percentage who remained in the same social class. And they underestimated mobility especially for individuals from middle-class backgrounds, which replicated Study 1’s results. These patterns were confirmed by the interactive effect of parents’ and child’s income level on mobility estimates, F(4, 894) = 208.72, η p 2 = .48.

Results from Study 2: percentage of children at the bottom, middle, and top income levels later in life as a function of their parents’ income level. The graph shows participants’ estimates (±1 SEM) along with the actual percentages.
When participants’ political ideology was added to the model, the two-way interaction of parents’ and child’s income level was qualified by a predicted three-way interaction with ideology, F(6, 888) = 3.14, η p 2 = .01. Figure 5 shows that for individuals from middle- and upper-class backgrounds, all participants (regardless of political ideology) underestimated mobility and did so to approximately equal degrees. However, regarding individuals from lower-class backgrounds, the ideological differences observed in Study 1 were replicated. Specifically, one-sample tests comparing judgments with 51.1% (the actual percentage who moved up to the middle or upper class) indicated that politically liberal participants underestimated the percentage who were upwardly mobile, t(92) = −5.35, 95% CI for the difference = [−15.22, −6.98], d = 0.55, whereas moderate, t(34) = −1.27, d = 0.21, and conservative, t(27) = 0.81, d = 0.15, participants did not. Indeed, liberals underestimated upward mobility to a greater extent than did conservatives, t(119) = −3.26, 95% CI for the difference = [−23.90, −5.85], d = 0.66.

Results from Study 2: percentage of children at the bottom, middle, and top income levels later in life as a function of their parents’ income level. The graph shows estimates (±1 SEM) separately for conservative, moderate, and liberal participants along with the actual percentages.
Negative attitudes toward the social system (i.e., system nonjustification) were associated with political liberalism (r = .33) and with perceptions of lower mobility (see Fig. S3 in the Supplemental Material); this replicated the findings of Study 1. Moreover, negative attitudes toward the system mediated the relation between liberalism and perceptions of lower mobility. When participants’ system-justification scores were entered as a covariate in the model with political ideology, there was a three-way interaction with system justification, F(6, 882) = 4.50, η p 2 = .03, whereas the three-way interaction with ideology was almost fully attenuated, F(6, 882) = 1.48, η p 2 = .01, which suggests that system justification fully mediated its relation.
Changes in social mobility
Once again, as determined using one-sample tests comparing ratings with the scale midpoint of 3, participants generally believed that social mobility has declined over the past four decades (M = 2.52), t(454) = −8.56, 95% CI for the difference = [−0.59, −0.37], d = 0.40; and again, politically liberal participants perceived mobility as declining (M = 2.33), t(276) = −9.51, 95% CI for the difference = [−0.81, −0.53], d = 0.57, and to a lesser extent, so did politically moderate participants (M = 2.71), t(98) = −2.43, 95% CI for the difference = [−0.53, −0.05], d = 0.24. In contrast, conservatives perceived no change in mobility (M = 2.94), 95% CI for the difference = [−0.33, 0.20], d = 0.05. Approximately 64% of liberals said mobility has declined “slightly” or “greatly” over the prior four decades (vs. 51% of moderates and 37% of conservatives), whereas only 13% of liberals believed it has remained the same (vs. 16% of moderates and 27% of conservatives), and 23% believed it has increased (vs. 33% of moderates and 37% of conservatives). Overall, liberals perceived a greater decline in mobility than either moderates, t(374) = −2.72, 95% CI = [−0.65, −0.10], d = 0.38, or conservatives, t(354) = −4.05, 95% CI = [−0.90, −0.31], d = 0.51, whose ratings did not significantly differ, t(176) = −1.28, 95% CI = [−0.58, 0.13], d = 0.19.
As in Study 1, negative attitudes toward the social system were associated with political liberalism (see the previous section) and with a belief in declining social mobility (r = .32). And once again, negative system attitudes mediated the relation between liberalism and the belief in declining mobility (bootstrapped tests of the indirect effect: b = 0.08, 95% CI = [0.04, 0.12]).
General Discussion
These two studies reveal both accuracy and systematic bias in Americans’ perceptions of social mobility (see Jussim, Cain, Crawford, Harber, & Cohen, 2009, for a discussion of the co-occurrence of perceptual accuracy and bias). On one hand, our participants showed awareness that social mobility is bounded, to some extent, and that one’s starting position in life strongly predicts one’s finishing position. They judged (accurately) that Americans born into a given social class were more likely to remain there than move to a different class. Nevertheless, they underestimated the actual amount of movement between social classes. The number of Americans from lower- and middle-class backgrounds who moved up in social position (and the number of Americans from upper-class backgrounds who moved down) was greater than our participants estimated. Moreover, despite evidence that mobility in America has remained stable throughout the last 40 years, a majority of our participants believed mobility has declined (consistent with public-opinion polls, e.g., see Dugan & Newport, 2013). Much of this pessimism about social mobility, we suspect, is driven by the popular media’s intensive coverage of the recent economic downturn, high unemployment rates, and rising wealth inequality, as well as public and political debates over these issues.
We also uncovered evidence that mobility beliefs are divided (and distorted) along ideological lines. Politically liberal participants underestimated current levels of mobility in the United States and exaggerated how much mobility has declined in the recent past more than did moderate and politically conservative participants. In part, this was due to liberals perceiving lower mobility in general, and less upward mobility in particular, than moderates or conservatives. Indeed, one of the more consistent effects across both studies was that liberals underestimated upward mobility, especially among individuals from lower-class backgrounds. Moreover, we found that liberals’ relative pessimism about mobility appears to be accounted for by their relative dissatisfaction with the current system, social hierarchies, and inequality. These findings are consistent with the bidirectional perspective, which posits that error and bias can occur at both ends of the ideological spectrum.
Ideologically motivated bias has been claimed to be a uniquely conservative affliction (Feygina, Goldsmith, & Jost, 2010; Jost, Glaser, Sulloway, & Kruglanski, 2003; Napier & Jost, 2008); our findings challenge this view and are more consistent with a growing body of evidence suggesting that both liberals and conservatives engage in motivated reasoning processes in defense of their worldviews and that both are vulnerable to distorting different aspects of social, economic, and environmental realities (e.g., Kahan, 2013; Tetlock & Mitchell, 1993). Rather than treating motivated reasoning as unique to any particular ideology (Jost et al., 2003), we believe that a more fruitful and scientifically tenable approach is for researchers to recognize that motivation is a general feature of the human condition and to begin investigating the myriad ways in which both ideologies, embracing different moral foundations (Graham, Haidt, & Nosek, 2009), may distort different facets of reality in a manner congruent with their particular worldviews. Liberals, and those who view the social system as unfair, may exaggerate the system’s negative features (as in the present case with social mobility), just as conservatives and those who view the system as fair may exaggerate its positive features. More broadly, our research highlights the utility of comparing perceptions of social and economic conditions (e.g., unemployment, crime, and poverty rates) with objective indicators for evaluating theories of ideology, and for pinpointing the sources and consequences of ideologically motivated distortion.
Some potential limitations of our research deserve mention. First, we relied on Internet-based convenience samples, raising questions of whether the same patterns would be observed with a nationally representative sample of Americans. We note, however, that nationally representative public-opinion polls have yielded findings very similar to ours—specifically, the perception of declining mobility and economic opportunity (and their association with ideology; see Dugan & Newport, 2013). In addition, given that all participants underestimated mobility, irrespective of their political ideologies (and other demographics), this general underestimation effect appears to be robust and therefore very likely would be replicated in representative samples. Nonetheless, future research with larger, nationally representative samples would be worthwhile.
Second, because Chetty and colleagues (2014a, 2014b) assessed mobility only among Americans in their mid to late 20s, one may wonder if this appropriately reflects changes in mobility across the lifetime and therefore whether their data constitute a valid accuracy criterion for calibrating perceptions. First, we note that Chetty and colleagues’ results correspond very closely with those of other independent studies that have assessed intergenerational mobility across much wider age ranges (Hertz, 2007; Lee & Solon, 2009). Second, one’s chances of changing social classes are likely to be greater over a much wider time frame (e.g., one’s entire lifetime) than within a narrow time frame. Therefore, if anything, Chetty and colleagues’ data underestimate the true amount of social mobility, which implies that participants in the present research may have underestimated mobility even more than their responses indicate.
In conclusion, we found that our participants did not accurately predict the rate of social mobility in America, which—despite growing fears in the American public about limited opportunities for economic advancement and widening class divisions—remains greater both now and over the recent past than many people seem to realize.
Footnotes
Declaration of Conflicting Interests
The authors declared that they had no conflicts of interest with respect to their authorship or the publication of this article.
Open Practices
All data and materials have been made publicly available via Harvard Dataverse Network and can be accessed at http://thedata.harvard.edu/dvn/dv/kenswan. The complete Open Practices Disclosure for this article can be found at http://pss.sagepub.com/content/by/supplemental-data. This article has received badges for Open Data and Open Materials. More information about the Open Practices badges can be found at https://osf.io/tvyxz/wiki/view/ and ![]() .
.
Notes
References
Supplementary Material
Please find the following supplemental material available below.
For Open Access articles published under a Creative Commons License, all supplemental material carries the same license as the article it is associated with.
For non-Open Access articles published, all supplemental material carries a non-exclusive license, and permission requests for re-use of supplemental material or any part of supplemental material shall be sent directly to the copyright owner as specified in the copyright notice associated with the article.