
Abstract
Acoustic rhythms are pervasive in speech, music, and environmental sounds. Recent evidence for neural codes representing periodic information suggests that they may be a neural basis for the ability to detect rhythm. Further, rhythmic information has been found to modulate auditory-system excitability, which provides a potential mechanism for parsing the acoustic stream. Here, we explored the effects of a rhythmic stimulus on subsequent auditory perception. We found that a low-frequency (3 Hz), amplitude-modulated signal induces a subsequent oscillation of the perceptual detectability of a brief nonperiodic acoustic stimulus (1-kHz tone); the frequency but not the phase of the perceptual oscillation matches the entrained stimulus-driven rhythmic oscillation. This provides evidence that rhythmic contexts have a direct influence on subsequent auditory perception of discrete acoustic events. Rhythm coding is likely a fundamental feature of auditory-system design that predates the development of explicit human enjoyment of rhythm in music or poetry.
“The perception, if not the enjoyment, of musical cadences and of rhythm is probably common to all animals, and no doubt depends on the common physiological nature of their nervous systems.” This conjecture, put forward by Charles Darwin (1871, p. 333), has recently become a topic of intense interest, both explicitly and unwittingly. Explicitly, research on animals’ ability to synchronize their movements to a beat has revealed some success stories, but it has also revealed more variability than Darwin might have expected (Patel, 2014). More unwittingly, recent demonstrations of the tendency (a) for neural oscillations to entrain to rhythmic features of stimuli (Howard & Poeppel, 2012; Stefanics et al., 2010), (b) for intrinsic neural oscillation and stimulus phase to modulate attention and perception (Henry & Obleser, 2012; Howard & Poeppel, 2010; Lakatos, Karmos, Mehta, Ulbert, & Schroeder, 2008; Ng, Schroeder, & Kayser, 2012) even beyond the auditory modality (Romei et al., 2008; van Dijk, Schoffelen, Oostenveld, & Jensen, 2008), and (c) for attention to be allocated in oscillatory pulses (de Graaf et al., 2013; Landau & Fries, 2012; Song, Meng, Chen, Zhou, & Luo, 2014; VanRullen, 2013) is consistent with an exceptionally broad neural mechanism for rhythmic entrainment that forms the foundation of sensation across species (Schroeder & Lakatos, 2009), consistent with Darwin’s claim.
Although much progress has been made recently in uncovering underlying effects of intrinsic and entrainable neural rhythms in visual perception, hearing presents a different situation in that rhythmic information appears to be coded explicitly as a perceptual feature. Indeed, research in humans and other mammals has provided evidence for the existence of neural codes for representing periodic acoustic information, typically assessed using amplitude-modulated wideband noise signals (Barton, Venezia, Saberi, Hickok, & Brewer, 2012; Baumann et al., 2011; Giraud et al., 2000; Langner, Dinse, & Godde, 2009; Langner, Sams, Heil, & Schulze, 1997). For example, in the cat inferior colliculus, neurons tuned to particular modulation rates have been found (Langner & Schreiner, 1988; Schreiner & Langner, 1988), and in human auditory cortex, modulation rate or “periodicity” maps have been uncovered using functional MRI (Barton et al., 2012). Such findings are consistent with the hypothesis that, in addition to spectral filtering accomplished by the cochlea, the auditory system extracts periodicity information computationally (Borst, Langner, & Palm, 2004) and filters acoustic signals into modulation-rate channels (Dau, Kollmeier, & Kohlrausch, 1997a; Dau, Kollmeier, & Kohlrausch, 1997b).
But what function (or functions) does rhythmic information serve? Is it simply another acoustic feature allowing the listener to hear the difference between types of rhythms, for example, the difference between a trot and a gallop or a waltz and a samba? Or does rhythmic coding subserve a more fundamental function in hearing? Research involving speech, another stimulus with strong rhythmic features (Peelle & Davis, 2012), suggests the latter by demonstrating that disrupting the natural rhythm of a sentence degrades intelligibility (Ghitza & Greenberg, 2009; Peelle & Davis, 2012) and, further, that phase information in low-frequency neural oscillations predicts sentence intelligibility (Luo & Poeppel, 2007). It has been argued that the rhythm in speech and other sounds provides a predictive cue to the time of arrival of subsequent critical bits of information (Engel, Fries, & Singer, 2001; Giraud & Poeppel, 2012). These predictions are instantiated via stimulus-driven entrainment or phase-locking of neural oscillations (or periodicity-coding channels) that in turn modulate neuronal excitability for maximal sensitivity during critical time windows (Giraud & Poeppel, 2012; Lakatos et al., 2008; Lakatos et al., 2005).
Recent electrophysiological recordings in monkey auditory cortex have shown that entrained oscillatory activity to a train of pure tone beeps persisted even after the stimulation ceased (Lakatos et al., 2013), which lends support to the hypothesis that rhythmic contexts could indeed influence subsequent perception. Unfortunately, behavioral correlates of these persisting oscillations were not reported. Some related behavioral work on timing-based attention provides at least prima facie suggestive evidence: When the interstimulus interval between distractor tones predicts the time of presentation of a target tone, pitch judgments are more accurate by up to 10% compared with when the interstimulus interval does not predict target presentation (Jones, Moynihan, MacKenzie, & Puente, 2002). However, it is unclear whether this sort of temporal attention is due to bottom-up auditory entrainment (our interest here) or from some top-down temporal expectation (Spaak, de Lange, & Jensen, 2014).
In the present experiment, we sought to assess whether a rhythmic acoustic stimulus would induce an oscillation in perception that matched the period of the entrained stimulus and persisted for several cycles, even after the driving stimulus stopped oscillating. Such an effect has not yet been shown in audition, in which findings are limited to cases in which an oscillating stimulus persists in the test phase (thus limiting inferences regarding their predictive utility; e.g., Henry & Obleser, 2012) or cases in which an entrained neural oscillation exhibits poststimulus persistence with no behavioral correlates presented (Lakatos et al., 2013). A similar effect has recently been reported in vision (Spaak et al., 2014) but using a modulation rate (10 Hz) that failed to show an effect in hearing (İlhan & VanRullen, 2012). Given the low-frequency modulation rate of many naturally occurring sounds, such as speech, we explored this question at a correspondingly lower modulation rate (3 Hz). To reduce temporal-prediction effects, we avoided a punctate entrainment stimulus and used amplitude-modulated noise instead, which is more similar to the envelope modulation characteristic of natural rhythmic stimuli, such as speech. We further reduced temporal-prediction effects by using a target stimulus (a 1-kHz tone) that differed from the entrainment stimulus—unlike Jones et al. (2002), who used tones both as the rhythmic context and the target, thus potentially encouraging perceptual grouping. We also ensured that the phase of the amplitude-modulated cycle provided no reliable cue to the arrival time of the target.
Method
Five 1 adult human listeners with normal hearing were exposed to a wideband Gaussian-noise stimulus that lasted 4 s per trial. The noise was amplitude-modulated at 3 Hz (80% modulation depth) for the first 3 s of the stimulus duration (the entrainment phase), then the modulation waveform ended on the cosine phase of the next cycle, which left the final 1-s portion of the noise stimulus unmodulated (Fig. 1). On half of the trials, a 1-kHz tone (50-ms duration with a 5-ms rise-and-decay time) was presented at one of nine temporal positions during the unmodulated portion of the noise stimulus. These temporal positions started at the offset of the modulation and were successively spaced 83.3 ms apart, which is equal to one-quarter of the modulation period. Thus, the nine temporal positions of the tonal signal covered two full cycles of the expected modulation waveform had the modulation continued during this period. Because each cycle of modulation at 3 Hz was equal to 0.333 s, the tone signal was presented between 3 and 3.666 s after noise onset (i.e., 0 to 0.666 s after termination of noise modulation). A follow-up study examined the third and fourth cycles of the expected modulation waveform, using a noise stimulus with a duration of 4.5 s and tone pulses presented at time points between 3 and 4.333 s after noise onset (0 and 1.333 s after termination of noise modulation).

Gaussian-noise waveform used for entrainment and temporal positions of the nine tones used to detect entrainment. The noise was amplitude-modulated at 3 Hz (80% modulation depth) for the first 3 s, then unmodulated for 1 s. On half of the trials, a 1-kHz tone was presented at one of nine temporal positions (indicated here by colored bars) during the unmodulated portion of the noise stimulus. The green bars represent the zero-, one-, and two-cycle time positions (i.e., peaks of the expected modulating waveform, had it continued).
On each trial of a single-interval two-alternative forced-choice task, the subject was required to press one of two keys (“1” or “2” on a QWERTY keyboard) to indicate whether or not a tonal signal was present during the unmodulated segment of the masking noise. The prior probability of a signal occurring on a given trial was .5. When a tone was presented, its temporal position was selected randomly from one of the nine values, and its level was selected from one of five values covering a range of 12 dB to allow measurement of psychometric functions. Each run consisted of 100 trials, and each subject completed a minimum of 20 runs.
Stimuli were generated using MATLAB (The MathWorks, Natick, MA) on a Sony Lenovo T400 computer and presented at a rate of 44.1 kHz through 16-bit digital-to-analog converters and Sennheiser headphones (eH 350) in a steel-walled acoustically isolated chamber (IAC Acoustics, Stafford, TX). The noise stimulus was presented at a nominal level of 70 dB (A-weighted). All procedures were approved by the University of California, Irvine, Institutional Review Board.
Results 2
Figure 2 shows psychometric functions averaged across all 5 subjects for the five signal levels used in our main experiment. Trials associated with the second point on the psychometric function (at 3 dB in Fig. 2) were selected for further analysis because this was near the steepest point of the psychometric slope (between .7 and .9), and analyzing these trials maximized the likelihood of observing variations in performance.

Mean proportion of correctly detected tones as a function of signal level in the main experiment. Error bars show ±1 SEM.
Figure 3 shows the proportion of correctly detected tonal signals as a function of temporal position in the unmodulated masking noise. Note that signal detection performance for all subjects modulated at a rate equal to the noise modulation; performance modulation was antiphasic to the expected modulation, with peak performance occurring near expected dips and poorest performance associated with expected modulation peaks. Signal (tone) level was held constant for the data shown in Figure 3, but performance varied significantly from approximately 65% to 90% (on average). The d′ values, as expected, also modulated cyclically by as much as 1.25 units from approximately 1.5 to 2.75 depending on the temporal position of the tone signal relative to the expected modulation phase (see Fig. S1 in the Supplemental Material available online).
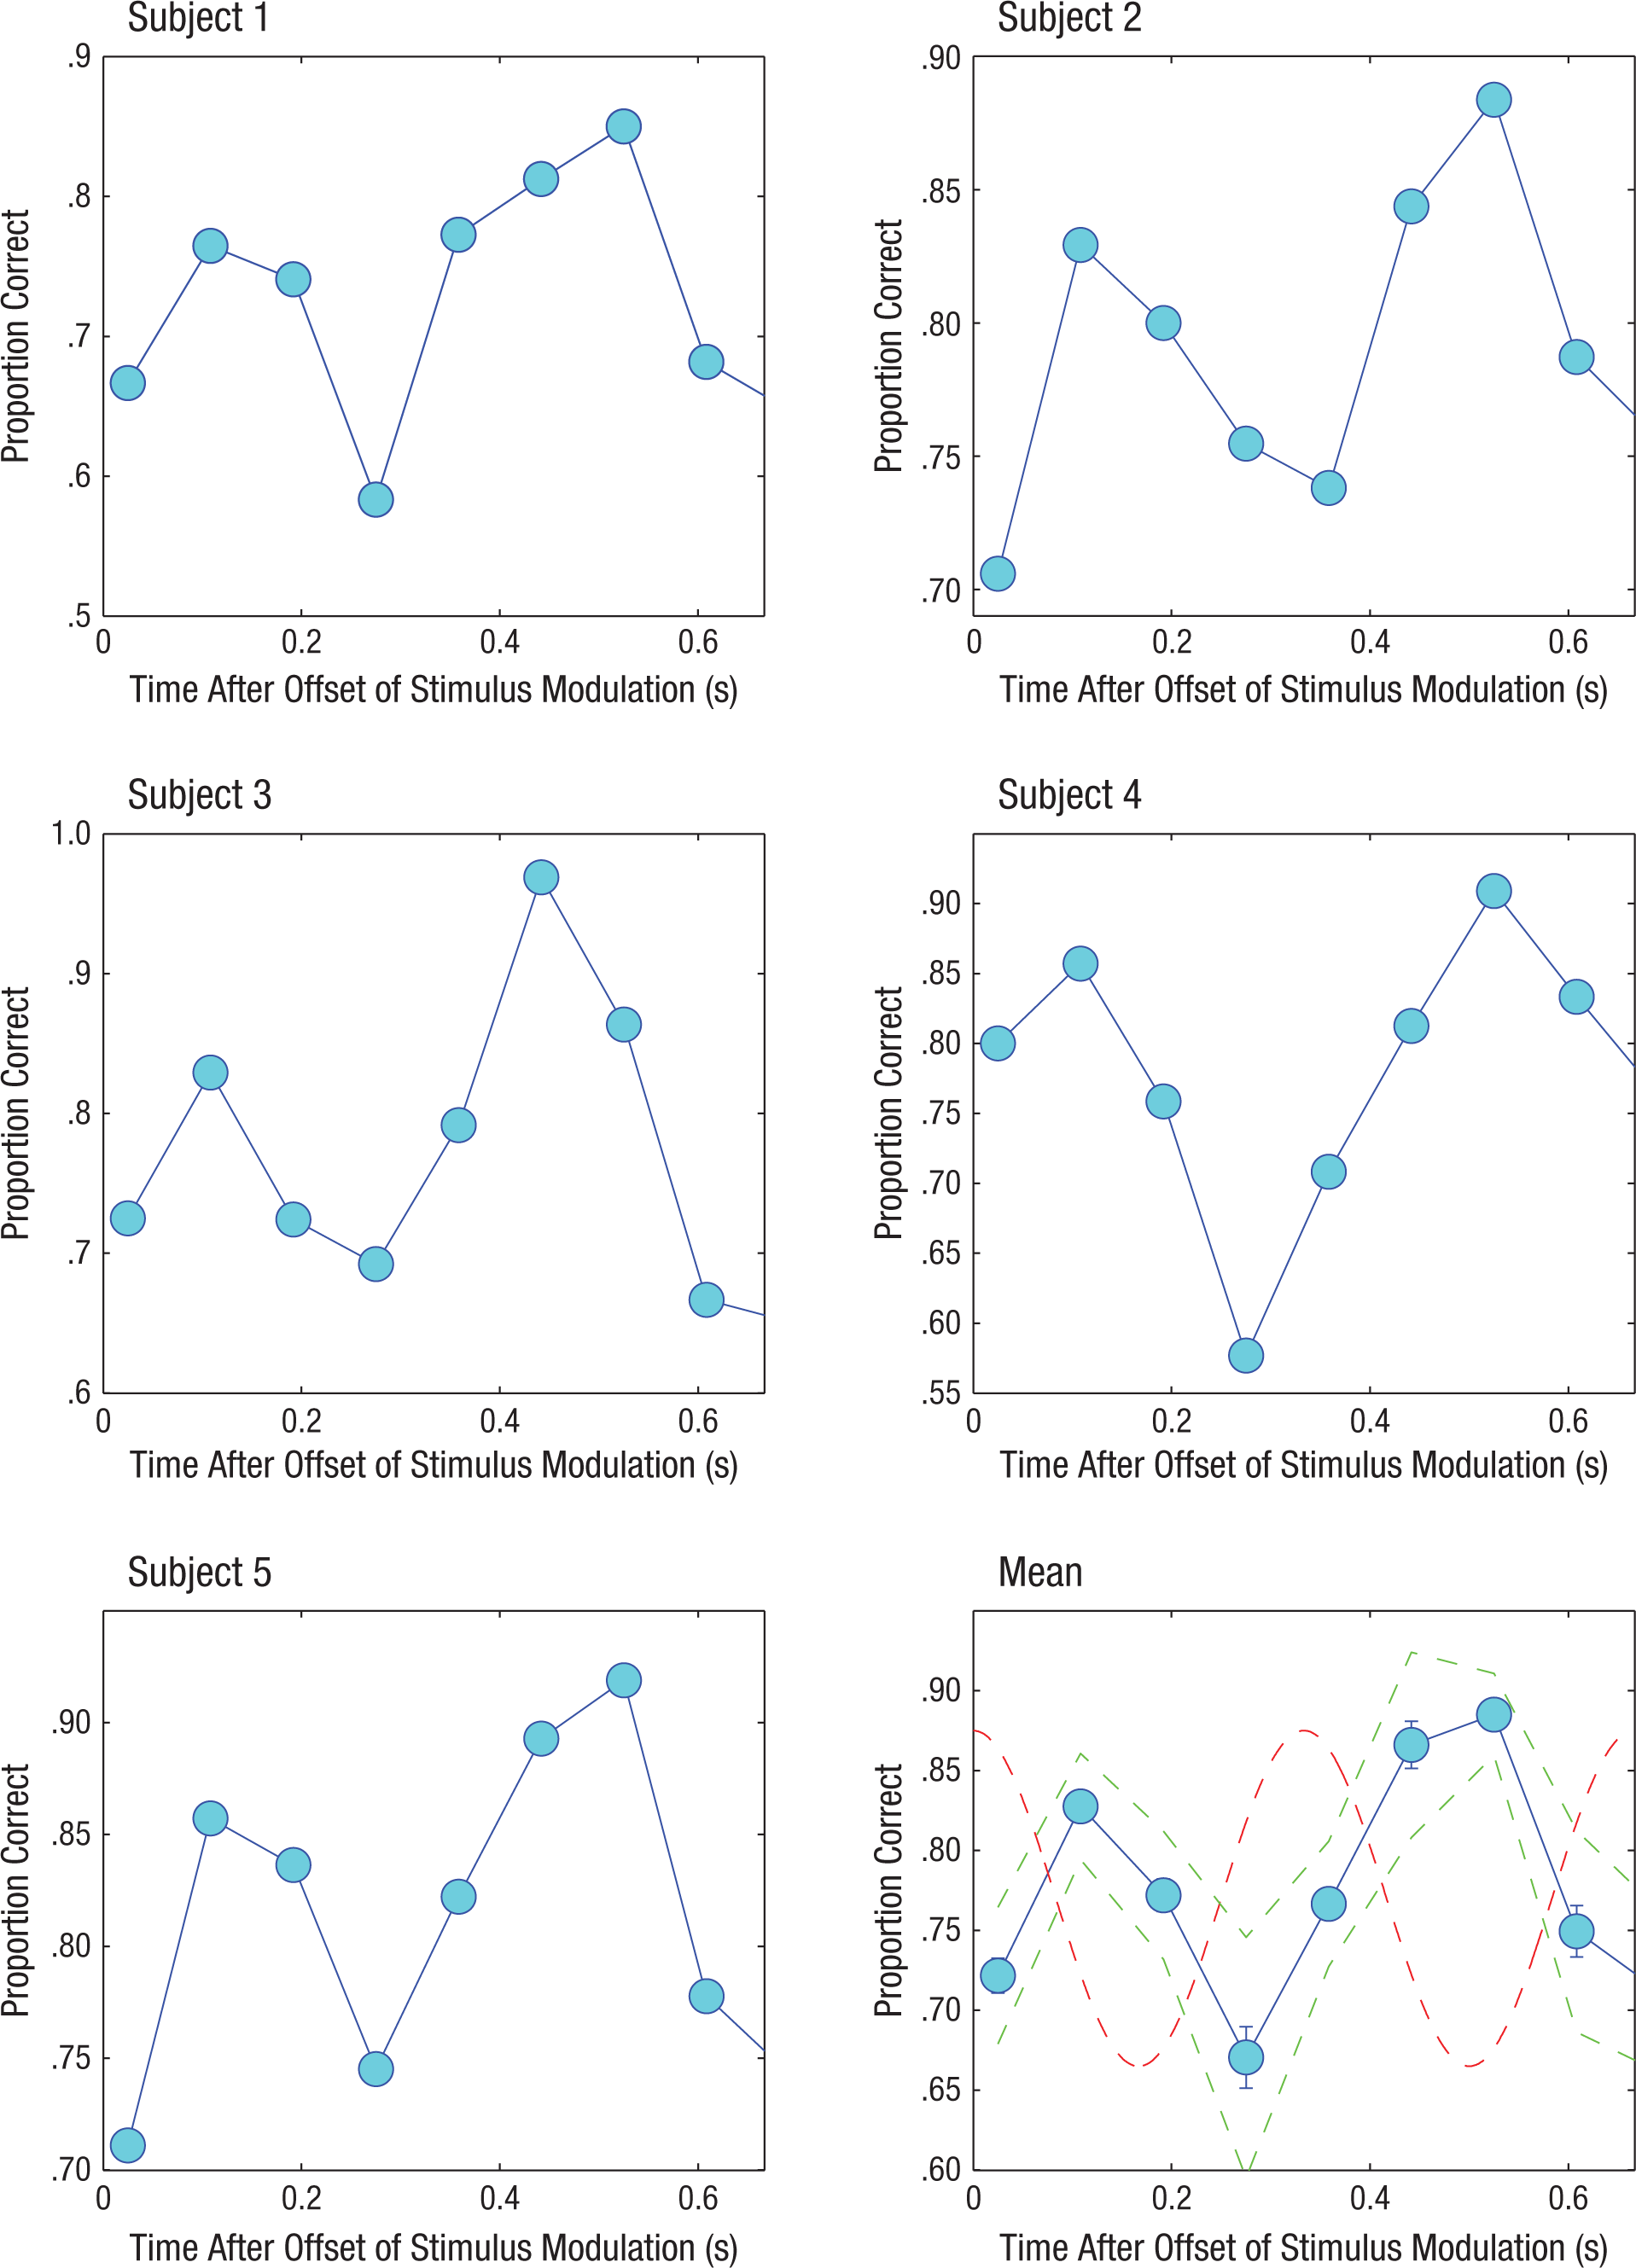
Mean proportion of correctly detected tones as a function of time after offset of noise modulation in the main experiment. Results are shown separately for each subject, with averaged results across subjects presented on the bottom right. The dashed sinusoidal curve shows the expected modulation of the masking noise, had it continued, and the dashed lines in phase with the data points represent 95% confidence intervals. Error bars represent ±1 SEM.
A single-factor repeated measures analysis of variance conducted on the data shown in Figure 3 revealed a highly significant effect of temporal position, that is, the modulation phase at which the tone signal was presented, F(8, 32) = 10.61, p < .001. We next conducted pairwise t-test comparisons across all permutations of temporal positions. The large number of significant results (see Table 1) suggests that the significance of the F value was not based on the deviation of signal detection performance at a single temporal position but was instead based on results from systematically different detection performances at different phases of the expected modulation waveform.
Temporal Positions That Were Significantly Different, as Determined by Pairwise t-Test Comparisons

p < .05. **p < .01. ***p < .001.
Next, we examined signal detection performance curves for the 5 subjects (see Fig. 4, in which each curve is normalized to a peak of unity). To further analyze the pattern of change in detection performance as a function of the temporal position of each tone relative to the phase of the expected noise modulation, we calculated the Fourier transforms of these detection curves. We found that the peak of the amplitude spectrum for all five curves occurred at 3 Hz, which is the frequency of the expected noise modulation. In addition, we examined the phase spectra of these waveforms and found that at the 3-Hz frequency, all five had starting phases near −π/2, the exact opposite phase from that associated with the phase of noise modulation (π/2), which suggests that detection patterns were antiphasic to the noise-modulation pattern.
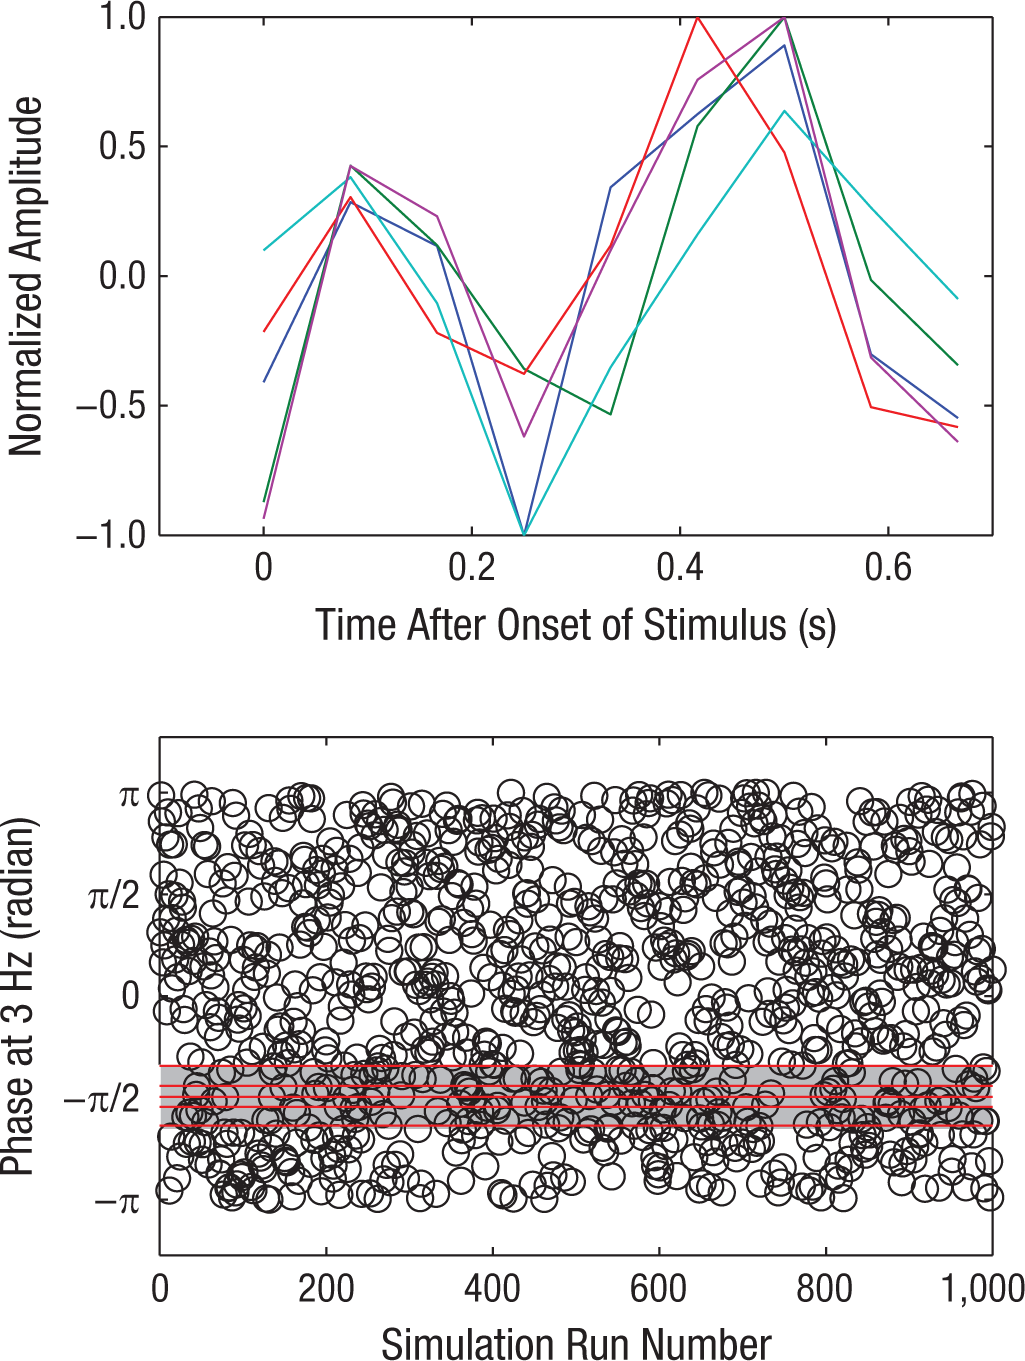
Signal detection performance in the main experiment. The top panel shows signal detection curves for each subject shown in Figure 3 normalized to a peak of unity. Data were averaged, the average was then subtracted from each point, and the result was divided by the largest value in that set. This yielded peaks at either 1 or −1. The red lines in the bottom panel show phase spectra calculated from the Fourier transform of the curves in the top panel. Open circles show the results of a 1,000-run simulation in which the positions of the nine points of each curve in the top panel were randomized, and the starting phase of the resultant waveform was calculated from its Fourier spectrum at 3 Hz (see the text for details).
In further support of this finding, we conducted a computational simulation for each observer by scrambling the positions of the detection points of each curve shown in the top panel of Figure 4 and calculating their Fourier phase spectrum at 3 Hz. Results for 1,000 such random scrambles are shown as open black circles in the bottom panel of Figure 4. The chance likelihood of all five starting phases occurring within 0.5 radians of −π/2 is 2π−5 or p < .0005. Thus, our analysis shows that both at the group and individual levels, signal detection performance during the nonmodulating segment of the noise was modulated at the same frequency but antiphasic to the noise-modulation envelope.
Given that we observed significant modulation in signal detection during the unmodulated part of the masking noise and no evidence that the modulation in performance was declining, we conducted a follow-up experiment in which we measured signal detection at temporal positions associated with the third and fourth cycles of the expected masker modulation to determine how modulation of performance may decline as a function of time. Three of the 5 subjects who participated in the main experiment returned for the follow-up experiment. Figure 5 shows the proportion of correctly detected tones when the signal occurred during the third and fourth expected modulation cycles (cf. Fig. 3, in which the signal occurred during the first and second expected modulation cycles). To facilitate visual comparison, we combined these data with the data for the same 3 subjects from the main experiment. Modulation of performance significantly declined and was less consistent during the third and fourth expected cycles of masker modulation than during the first and second expected cycles, although one can still observe some residual modulation in performance.
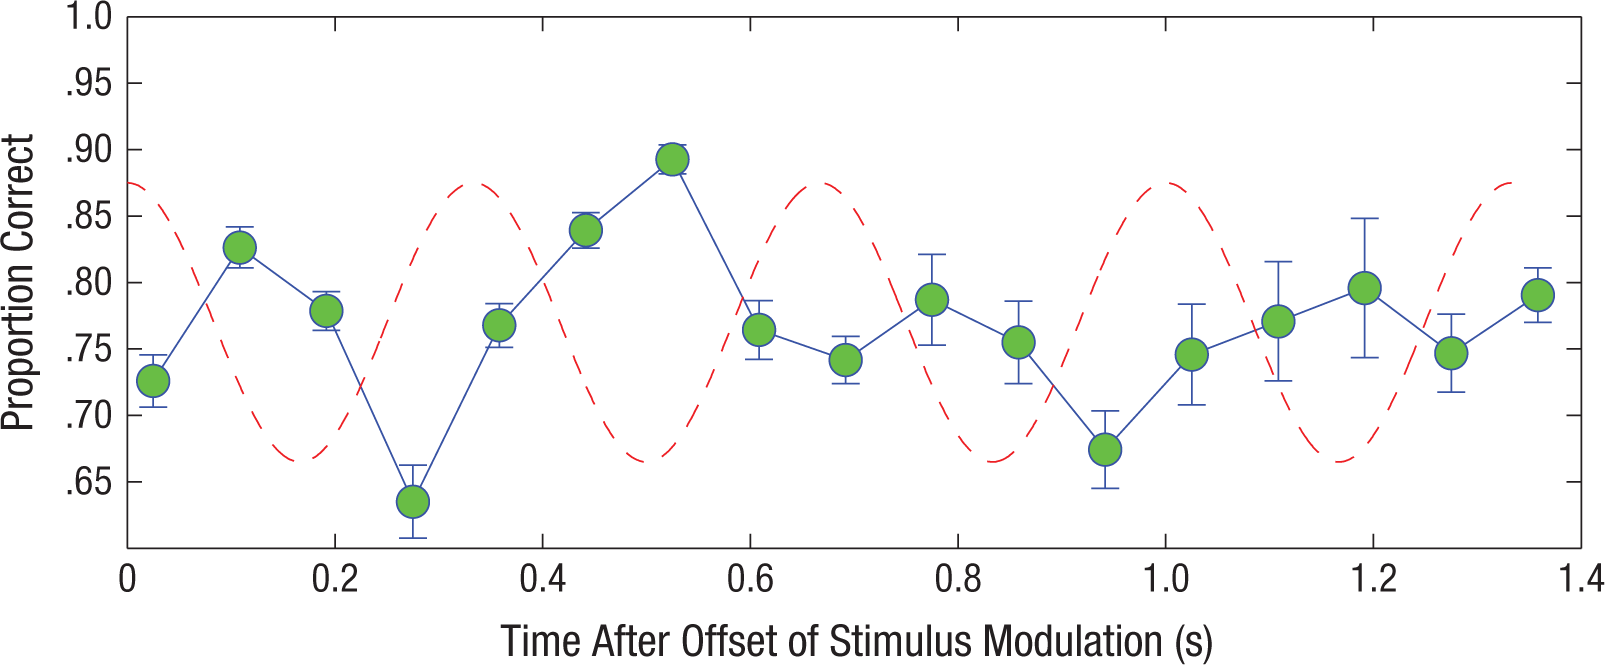
Mean proportion of correctly detected tones as a function of time after offset of noise modulation. Results for the 3 subjects who participated in both the main and follow-up experiments are collapsed across experiments. Data are shown across all four cycles after the offset of stimulus modulation. Error bars represent ±1 SEM.
Discussion
Our findings show that a rhythmic acoustic context induces subsequent oscillations in the perception of a nonrhythmic, discrete acoustic event. The effect was substantial in magnitude, resulting in accuracy differences up to approximately 25% and d′ fluctuations greater than 1.0 (i.e., more than a standard-deviation fluctuation; cf. the ~10% attentional effects reported by Jones et al., 2002). Similar findings have been reported in the visual domain (de Graaf et al., 2013; Spaak et al., 2014), which indicates a general computational mechanism.
The antiphasic oscillation of perceptibility is evidence against a simple attentional, expectation-based account of our findings (Spaak et al., 2014), which is a likely explanation for previous auditory studies showing that temporal rhythms can enhance detectability for the same stimulus type presented in phase with the rhythm (Arnal, Doelling, & Poeppel, 2014; Jones et al., 2002; ten Oever, Schroeder, Poeppel, van Atteveldt, & Zion-Golumbic, 2014). In the present experiments, if listeners used the peak of the amplitude-modulated pulses to predict stimulus arrival, one would expect the best detection performance at the peak, not the trough, of the expected modulation cycle. This suggests that our experiment tapped into a bottom-up mechanism reflecting the organization of the auditory system itself rather than a top-down attention-driven mechanism reported previously (Jones et al., 2002).
A previous study (Neuling, Rach, Wagner, Wolters, & Herrmann, 2012) reported a prima facie similar result to ours using oscillating transcranial direct-current stimulation (tDCS) for continuous entrainment (maintained during the detection interval) instead of amplitude-modulated noise that transitioned to unmodulated noise. The researchers reported that the phase of the induced neural oscillation predicted detection performance over a single oscillation cycle, with better detection during the negative compared with the positive half wave of the stimulation cycle. Interpretation of this study is complicated by the fact that tDCS induces discomfort, which would oscillate with the stimulation cycle and could therefore indirectly modulate performance as a function of discomfort rather than entrained neural oscillation. In contrast, our study provides a direct demonstration that prior rhythmic entrainment induces a subsequent oscillation in perception that persists over several duty cycles.
There are at least two possible explanations regarding the source of the presently observed rhythmic-entrainment effect. One possibility draws on the idea of nested theta-gamma neural-oscillation circuits. The hypothesis is that the slow theta oscillations entrain to the slow stimulus-envelope modulation (e.g., as is typical in speech and in our amplitude-modulated stimulus), which in turn modulates gamma activity in local neural networks involved in processing acoustic features (Giraud & Poeppel, 2012). According to one version of this claim, there is an antiphase relation between theta oscillations and gamma activity (gamma peak = theta trough; Giraud & Poeppel, 2012). This explanation seems to fit our observations if we assume that the phase relation between our amplitude-modulated stimulus and gamma oscillation was aligned.
Another possible explanation is suggested by considering how the signal-to-noise ratio during the detection interval would have varied had the modulation of the entrainment phase continued into the detection interval: The signal-to-noise ratio would be greatest during the troughs of the modulation, which is where the best signal detection performance was found. Therefore, the effect may be explained as a form of perceptual aftereffect, an echoic trace of the entrained stimulus. The existence of modulation-rate coding in human auditory cortex (Barton et al., 2012) provides a possible neural source for generating such an aftereffect. This may also explain the recent observation that the power and phase of electroencephalogram-recorded theta oscillations generated while listening to a mixture of environmental sounds are stronger on target-miss trials than on target-hit trials (Ng et al., 2012). This effect was interpreted neurocomputationally as evidence for a “precluding but not ensuring” role for theta oscillations. But if theta power and phase reflect stimulus-driven rhythmic entrainment, as much work suggests (Howard & Poeppel, 2012; Luo & Poeppel, 2007), then the echoic trace of a strongly entrained rhythm may add periodic noise at that frequency to subsequent stimulus presentations, which would lead to an increased detection threshold and more misses on trials that are phase-aligned with the entrainment than on trials that are not phase-aligned.
We are left with several interesting observations: (a) Stimulus rhythms entrain neural oscillations and modulate perception, (b) the phase relation between stimulus rhythms and behavior can vary depending on the task and the stimuli, and (c) both bottom-up mechanisms (present experiment) and top-down mechanisms (Jones et al., 2002; Lakatos et al., 2013) appear to be in play. A critical task for future research will be to understand the interaction of these effects and their neural bases. For example, one major question concerns the relation between modulation-rate coding (channels or filters) in the auditory system and endogenous neural rhythms, which are found throughout the brain. Both seem to respond to similar stimulus features in the auditory domain but have largely been studied independently. One possibility is that modulation-rate coding is a mechanism for bottom-up rhythmic processing of sound, whereas endogenous neural rhythms provide a mechanism for attentional selection (Lakatos et al., 2013).
Overall, our findings are broadly consistent with the claim that the rhythm of a stimulus and the rhythm of the brain modulate perception. Whether the effect of rhythmic entrainment in the auditory system reflects a generalized perceptual mechanism or the output of specific channels for coding rhythmic patterns remains an open question. In either case, such mechanisms, likely present in a range of species, could lay the computational groundwork for the development of higher-level uses for rhythmic coding, such as music, and thus validate in part Darwin’s claim of cross-species rhythmic perception.
Footnotes
Declaration of Conflicting Interests
The authors declared that they had no conflicts of interest with respect to their authorship or the publication of this article.
Funding
This research was supported in part by the National Institutes of Health (Grant No. DC03681) and by the National Science Foundation (Grant No. BCS-1329255).
Notes
References
Supplementary Material
Please find the following supplemental material available below.
For Open Access articles published under a Creative Commons License, all supplemental material carries the same license as the article it is associated with.
For non-Open Access articles published, all supplemental material carries a non-exclusive license, and permission requests for re-use of supplemental material or any part of supplemental material shall be sent directly to the copyright owner as specified in the copyright notice associated with the article.