



Abstract
We estimated ideological preferences of 3.8 million Twitter users and, using a data set of nearly 150 million tweets concerning 12 political and nonpolitical issues, explored whether online communication resembles an “echo chamber” (as a result of selective exposure and ideological segregation) or a “national conversation.” We observed that information was exchanged primarily among individuals with similar ideological preferences in the case of political issues (e.g., 2012 presidential election, 2013 government shutdown) but not many other current events (e.g., 2013 Boston Marathon bombing, 2014 Super Bowl). Discussion of the Newtown shootings in 2012 reflected a dynamic process, beginning as a national conversation before transforming into a polarized exchange. With respect to both political and nonpolitical issues, liberals were more likely than conservatives to engage in cross-ideological dissemination; this is an important asymmetry with respect to the structure of communication that is consistent with psychological theory and research bearing on ideological differences in epistemic, existential, and relational motivation. Overall, we conclude that previous work may have overestimated the degree of ideological segregation in social-media usage.
You can observe a lot by watching.
The spread of Internet usage has expanded the quantity and variety of political information to which citizens have access and has created unprecedented opportunities for communicating with peers about current events. Research on the effects of group diversity on decision-making quality (Hong & Page, 2004) has sometimes been taken to suggest that technological transformations should contribute to a more robust and pluralistic form of public debate (Mutz, 2006). However, to the extent that individuals expose themselves to information that simply reinforces their existing views (e.g., Ditto & Lopez, 1992; Garrett, 2009a, 2009b; Sears & Freedman, 1967), greater access to information may foster selective exposure to ideologically congenial content, resulting in an “echo chamber” environment that could facilitate social extremism and political polarization (Adamic & Glance, 2005; Iyengar & Hahn, 2009; Prior, 2007). By the same token, perceptions of political polarization may be exaggerated for partisan and other reasons (Van Boven, Judd, & Sherman, 2012; Westfall, Van Boven, Chambers, & Judd, 2015).
Previous investigations of selective exposure to media have relied either on self-reported survey responses (Gentzkow & Shapiro, 2011; Pfau, Houston, & Semmler, 2007), which are subject to measurement error and social-desirability bias, or on behavior exhibited in laboratory experiments (Garrett, 2009b; Iyengar & Hahn, 2009; Prior, 2007), which may be low in external validity. An ideal setting for the study of mass-level polarization would be one that allows researchers to unobtrusively observe behavioral choices in the environment in which they naturally occur (Webb, Campbell, Schwartz, & Sechrest, 1966) and to infer the characteristics of individuals who engage in such behavior (Back et al., 2010). The use of social-media data satisfies the first condition, but, until recently, estimates of individual-level characteristics of social-media users have been calculated only for small, self-selected samples (Conover et al., 2011; Kosinski, Stillwell, & Graepel, 2013) or have focused on variables that are of little direct relevance to the study of ideological polarization (Golder & Macy, 2011).
In the research reported here, we leveraged a method that generates valid estimates of the ideological positions of extremely large numbers of social-media users, building on techniques developed by Barberá (2015). We exploited an underutilized dimension of social-media data sets, namely, the structures of observable social networks. More specifically, we built on the notion that decisions about whom to “follow” on platforms such as Twitter convey information about individual users’ political preferences. This follows from the notion that individuals tend to interact with others who are similar rather than dissimilar to themselves (McPherson, Smith-Lovin, & Cook, 2001). Our approach built on the logic of latent space models (Hoff, Raftery, & Handcock, 2002) and spatial following models (Barberá, 2015), but we relied on a mathematical approximation using correspondence analysis (Greenacre, 1993) to ensure that our method was computationally tractable even with large-scale networks involving millions of nodes. Furthermore, because our method did not rely on text-processing techniques, it was not subject to methodological limitations that are associated with textual or content analysis.
The extent to which citizens exhibit patterns of ideological polarization in online exchanges remains an open debate. Some researchers have reported high levels of clustering along party lines (Conover, Gonçalves, Flammini, & Menczer, 2012), characterizing social-media platforms as echo chambers, whereas others have found that ideological segregation online is low in absolute terms—with open cross-ideological exchanges and exposure to ideological diversity being fairly common (Bakshy, Messing, & Adamic, 2015). One possible explanation for the variability in results is that some studies have relied on self-selected samples of partisan individuals, whereas others have not (Bakshy et al., 2015; Conover et al., 2012; Westfall et al., 2015). Another is that some studies have excluded social-media platforms from their analysis (Gentzkow & Shapiro, 2011), despite the predominant role that social-networking sites play in online political communication. Our network-based estimates overcame these problems and enabled us to investigate exposure to social-media messages about a wide set of issues. We expected to observe higher levels of ideological segregation in tweets (Twitter messages) related to political issues (or partisan identities) and lower levels in tweets that focused on other types of current events.
Some psychological perspectives suggest that liberals and conservatives would be equally likely to engage in selective exposure to information that confirms their preexisting opinions and would exhibit equivalent levels of ideological homophily, insofar as processes such as dissonance reduction, identity maintenance, and motivated reasoning are both highly general and prevalent in the general population (e.g., Hogg, 2007; Kahan, 2013; Munro et al., 2002). Other perspectives suggest that conservatives—because of heightened epistemic, existential, and relational needs to reduce uncertainty, threat, and social discord—would be more likely than liberals to prefer an echo-chamber environment (Jost, Glaser, Kruglanski, & Sulloway, 2003; Jost & Krochik, 2014; Stern, West, Jost, & Rule, 2014). Prior research focusing on traditional forms of media usage is inconclusive; some studies have obtained symmetrical patterns of selective exposure, dissonance avoidance, and ideological conformity (Iyengar & Hahn, 2009; Knobloch-Westerwick & Meng, 2009; Munro et al., 2002; Nisbet, Cooper, & Garrett, 2015), whereas others have suggested that conservatives are indeed more likely than liberals to exhibit these types of behaviors (Garrett, 2009b; Iyengar, Hahn, Krosnick, & Walker, 2008; Lau & Redlawsk, 2006; Mutz, 2006; Nam, Jost, & Van Bavel, 2013; Nyhan & Reifler, 2010; Sears & Freedman, 1967).
We analyzed “big data” sources to investigate both of these research questions, namely, (a) the extent to which the online media environment resembles an echo chamber characterized by selective exposure, ideological segregation, and political polarization or a “national conversation” in which individuals of differing ideological persuasions read and retweet one another’s messages and (b) whether liberals and conservatives behave similarly or dissimilarly in their use of social media when it comes to sharing information about politics and current events. By estimating the ideological preferences and social-network structures of 3.8 million Twitter users in the United States, we were able to examine patterns of public interaction and information diffusion with respect to 12 different political and nonpolitical issues.
Method
There is a limited but growing literature on how to infer social-media users’ attributes on the basis of their network positions. Although ideology is one of the key predictors of social and political behavior (Jost, 2006), only a handful of studies have attempted to measure ideology using social-media data (e.g., Back et al., 2010; Conover et al., 2011; Kosinski et al., 2013). These studies have relied on self-selected samples and relatively crude operationalizations of ideology. Furthermore, previously used methods are not easily scalable to large social-media networks, which raises concerns about the validity of inferences drawn with respect to the entire population of users.
A latent space model of political ideology
Our approach builds on the theoretical logic of latent space models as applied to social-network data (Hoff al., 2002). These models assume that the positions of individuals in an unobserved social space can be inferred on the basis of observed connections among them insofar as such connections are governed by the principle of homophily. In other words, if individuals are embedded in networks that are homogeneous with regard to sociodemographic and behavioral characteristics, then their connections can be interpreted as indications of similarity. There is reason to believe that social networks are indeed homophilous when it comes to political ideology (see Barberá, 2015; Bond & Messing, 2015).
Our statistical model assumes that the probability of a connection between user i and user j, both nodes of a given network, is negatively related to dij, their distance in a latent ideological space:

The model further assumes that the probability of a connection between i and j is independent of the probability of a connection between i and another user k, given user i’s and user j’s ideological positions and the random effects α i and β j , which account for the differences in their baseline probability of being connected to other users. By estimating dij, we obtain the relative positions of both user i and user j in the latent ideological space.
Latent space models are usually estimated using Markov-chain Monte Carlo methods, because standard maximum likelihood approaches are intractable for medium-to-large networks (Barberá, 2015; Shortreed, Handcock, & Hoff, 2006). However, this Bayesian approach becomes computationally inefficient for large-scale networks, such as those that are found on social-media sites. Therefore, we used correspondence analysis (Greenacre, 1993) to estimate latent parameters and reduce computational costs.
1
Correspondence analysis assumes that users are located in a multidimensional space, and it computes users’ positions by minimizing the distance with respect to political accounts using a weighted euclidean metric. The first step in this method is to standardize the matrix
To ensure that our estimation method located users in an ideological latent space, we initially restricted our matrix of connections to users’ decisions about whom to “follow” regarding a subset of popular accounts with high ideological discrimination, such as accounts of the president, legislators, candidates for public office, media outlets, and interest groups. In Section 3.2 of the Supplemental Material available online, we summarize the results of a series of predictive checks, which demonstrated that the fit of our model was adequate; in other words, distance in the latent ideological space we identified was indeed predictive of the decisions users made about whom to follow.
Sampling of topics and users
In our analysis of online ideological polarization in the United States, we investigated the structure and content of Twitter conversations about 12 significant (political and nonpolitical) events and issues that arose from 2012 through 2014 (see Table 1). The political topics included issues that were discussed more frequently by Republicans than by Democrats (e.g., the U.S. federal budget) and issues that were discussed more frequently by Democrats than by Republicans (e.g., marriage equality, raising the minimum wage), as well as topics discussed equally by both (e.g., the 2012 presidential campaign, 2013 government shutdown, and 2014 State of the Union address). The nonpolitical topics ranged from sports and entertainment events (the 2014 Super Bowl, Winter Olympics, and Academy Awards) to mass tragedies (the Boston Marathon bombing, Newtown school shooting, and use of chemical weapons during the Syrian civil war). We identified a set of keywords for each topic and then used open-source tools developed by the Social Media and Political Participation (SMaPP) Lab (smapp.nyu.edu) at New York University (see SMaPP, n.d.) to collect a total of nearly 150 million tweets that mentioned any of those keywords from the Twitter Streaming API (application program interface).
Summary of the Tweet Collections on 12 Political and Nonpolitical Topics

Note: The collections were based on searches for specific terms. Sample terms are listed in this table; the complete list of search terms used for all 12 collections is provided in Table S3 in the Supplemental Material.
The sample of individuals in our study comprised all Twitter users who posted at least one tweet in this collection and followed at least one of the 1,206 political accounts we identified in the analysis described in the next section. We also applied simple activity, location, and spam filters (see Section 2.2 of the Supplemental Material) to try to ensure that all Twitter users included in our analysis corresponded to actual citizens (i.e., we excluded “ghost accounts” and “bots”). After applying these filters, we obtained a sample of 3.8 million active Twitter users in the United States.
Estimating and validating ideological placement
Our procedure for estimating ideological placement consisted of three stages (see Section 1 of the Supplemental Material for more details). First, we computed the ideological coordinates for users who followed at least 10 political accounts; this allowed us to identify the ideological latent space. Our initial list of political accounts included the Twitter accounts of the president and vice president, the Democratic and Republican parties, all members of Congress with more than 5,000 followers, and other relevant political figures (see Table S1 in the Supplemental Material for the complete list). Second, we expanded this list of political accounts to include other accounts that were commonly followed by liberal and conservative users in our sample (see Table S2 in the Supplemental Material). For instance, in this step, we added the accounts of Obama for America, The Huffington Post, Ready for Hillary, and Stephen Colbert (popular among liberals), as well as those of Rush Limbaugh, Bobby Jindal, Tucker Carlson, and the Tea Party (popular among conservatives). Finally, we projected these additional accounts and their followers onto the same latent space to estimate the ideological positions of our entire sample of 3.8 million individuals, including the original political elites used to initiate the estimation process. The fact that the model estimated ideological positions for elites and nonelites was especially useful because it provided multiple options for validation.
As illustrated in Figure 1, we were indeed able to validate the ideology estimates using a range of offline measures. Figure 1a demonstrates that statewide medians of Twitter-based estimates of ideology in the United States were highly correlated with statewide averages of ideology calculated on the basis of survey and sociodemographic data (Lax & Phillips, 2012). Turning to elites, as shown in Figure 1b, we found that our ideological estimates for members of the House and Senate were highly correlated with a measure of ideology based on their roll-call votes in Congress, the current “gold standard” for estimating legislative ideology (Clinton, Jackman, & Rivers, 2004). 3 Capitalizing on the public availability of party-registration data in some states, we matched a sample of Twitter accounts from California, Pennsylvania, Florida, Arkansas, and Ohio with voter-registration records (using full names and residential counties) and concluded that our Twitter-based ideal point estimates of ideology were good predictors of party registration, as indicated by the low degree of overlap in the distributions of ideological estimates for Democrats and Republicans, shown in Figure 1c. In particular, we found that setting a value of 0.5 in the latent ideological dimension as a threshold to distinguish registered Democrats from Republicans allowed us to correctly classify the party registration of 78% of matched voters. These tests confirmed that for the users in our sample, our method yielded ideology estimates that corresponded well to conventional measures of political ideology.
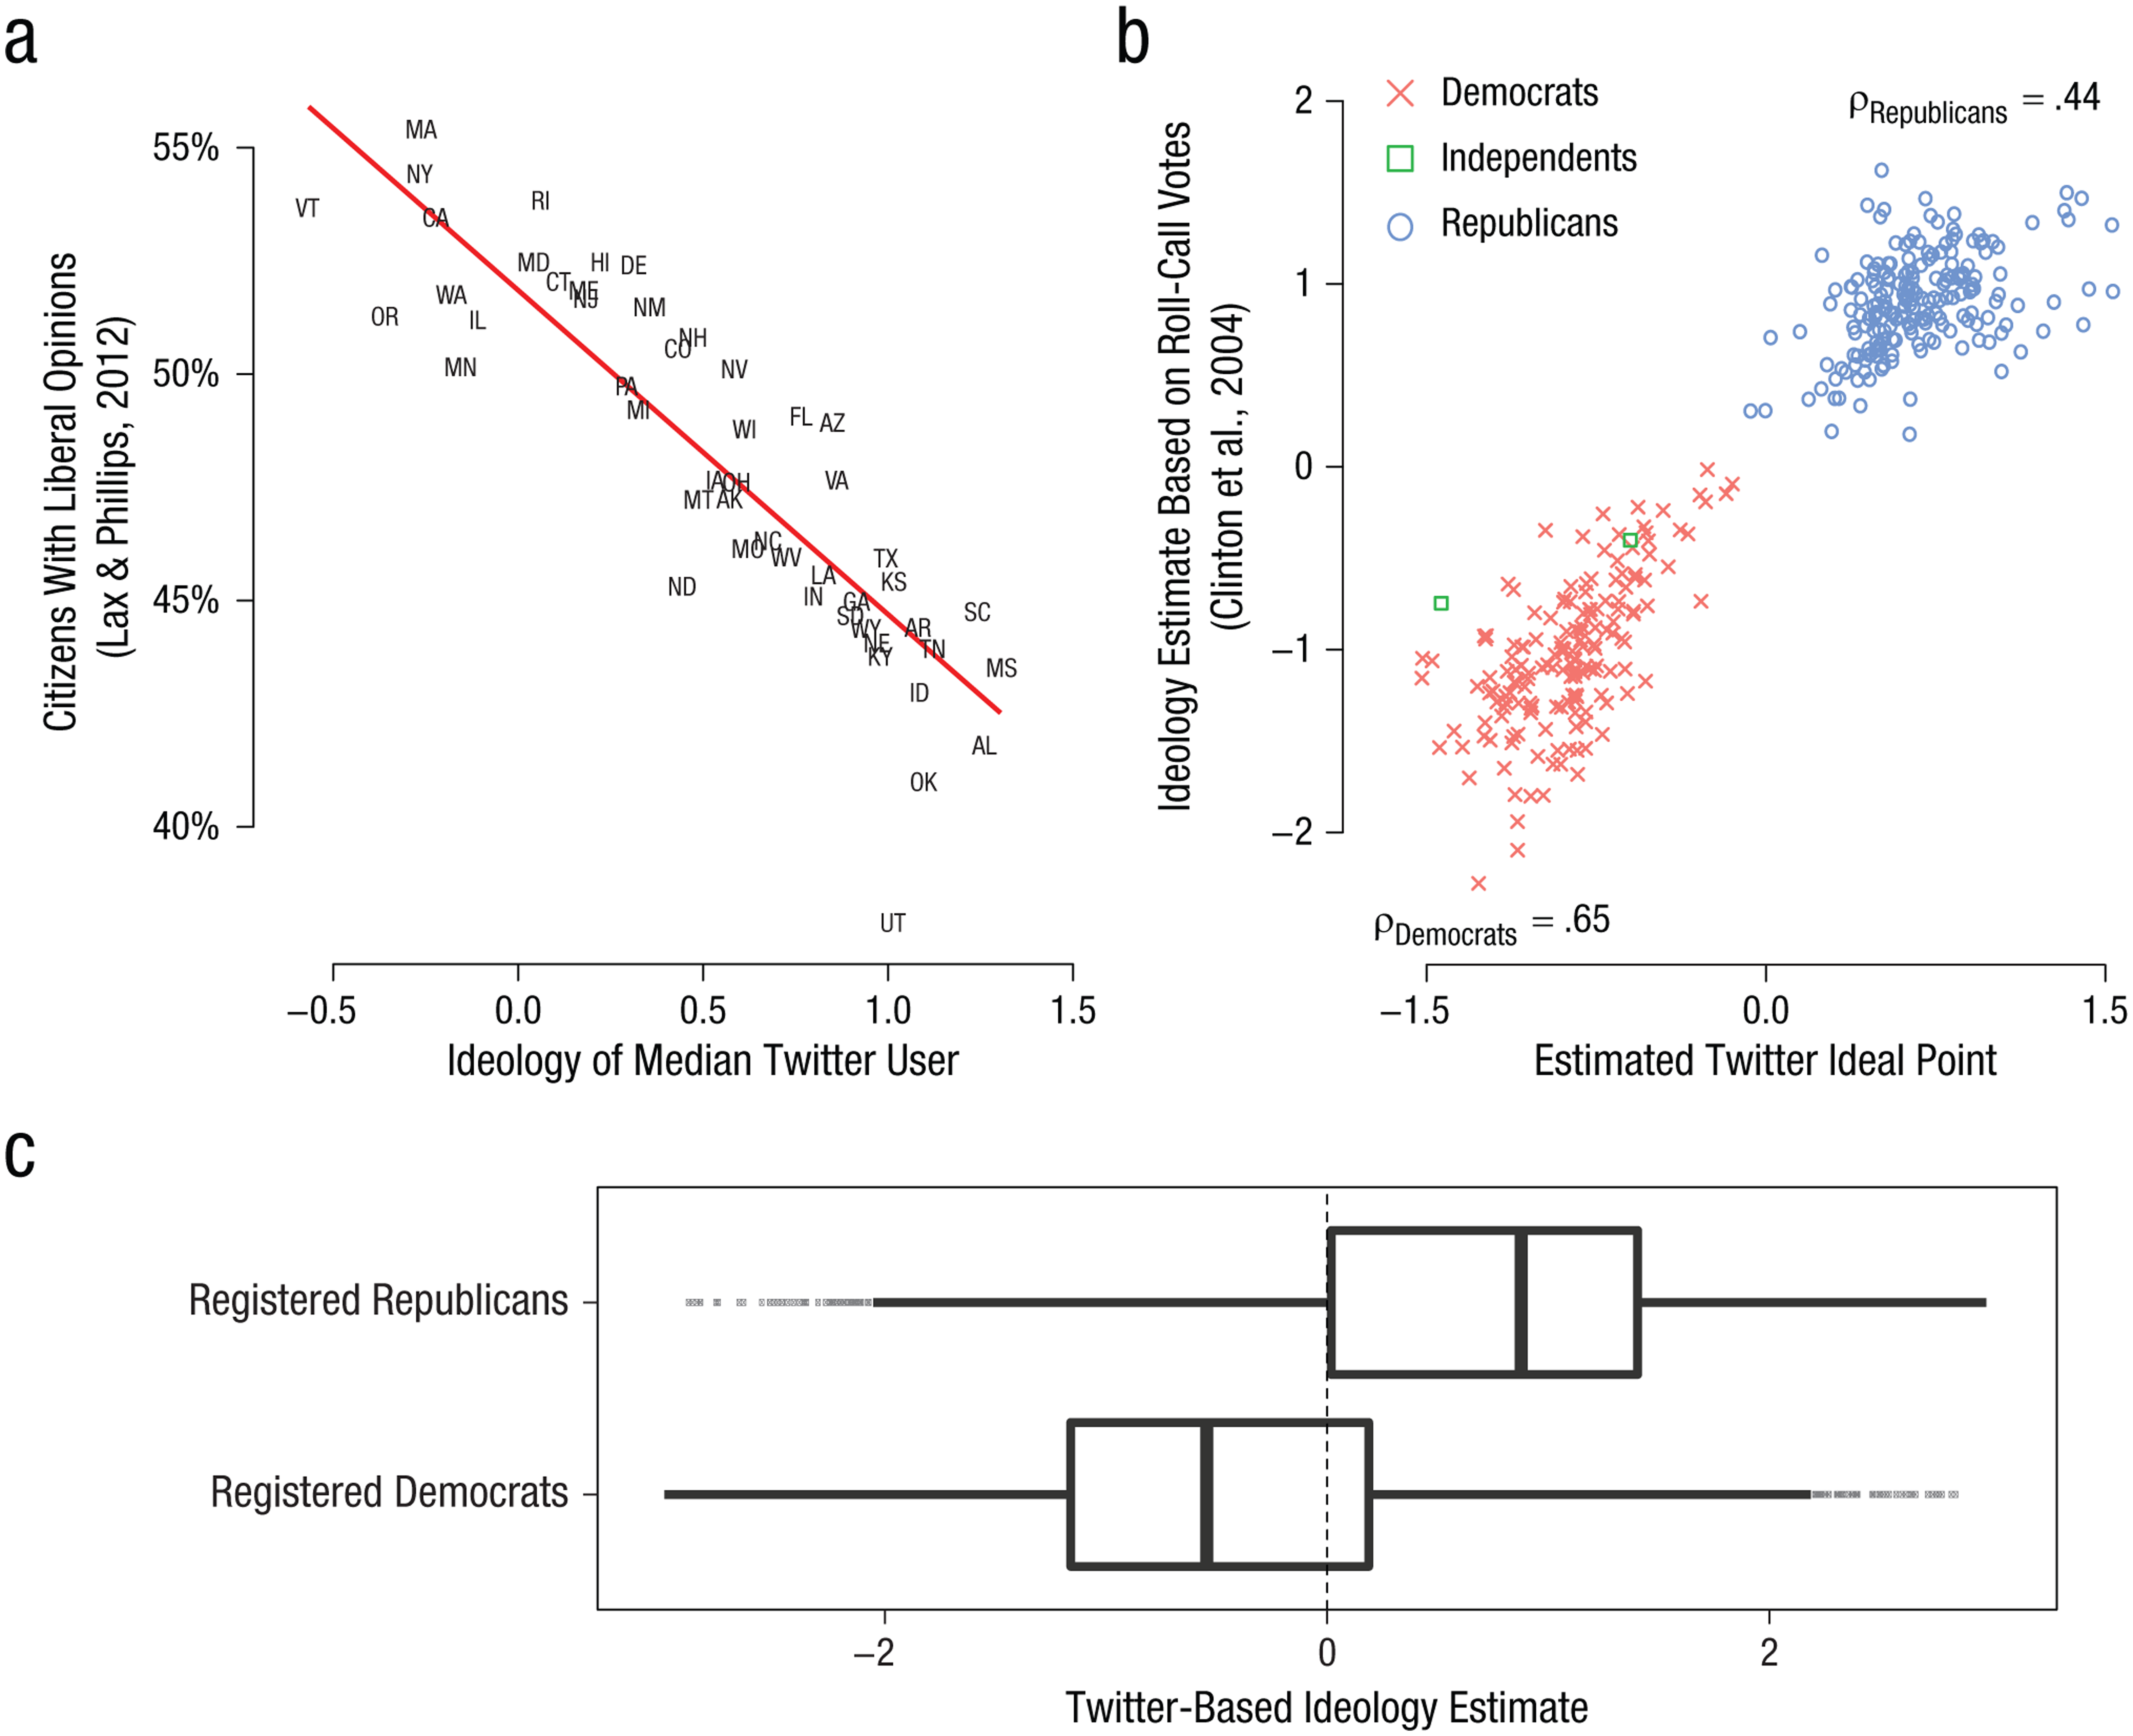
Results of the tests validating the procedure for estimating ideological placement. The graph in (a) illustrates the correlation (r = .87) between the estimated ideological location of the median Twitter user in each state on a liberal-conservative latent scale and the percentage of citizens holding liberal opinions across different issues (estimated by Lax & Phillips, 2012, using a combination of survey and sociodemographic data). The graph in (b) illustrates the correlation (r = .95) between the ideal point estimates of the ideology of the 365 members of the 113th U.S. Congress with more than 5,000 followers, based on their Twitter follower networks, and the Congress members’ ideology scores estimated from roll-call votes (Clinton et al., 2004). Within-party correlations are also shown. The graph in (c) displays the distribution of Twitter-based ideology estimates of a sample of Twitter users who were registered as Republicans and Democrats in California, Florida, Pennsylvania, Arkansas, and Ohio in 2012. For each group of voters, the box indicates the values of the 25th, 50th, and 75th percentiles of the ideology distribution, whereas the ends of the whiskers indicate the highest and lowest values within 1.5 times the interquartile range. Values beyond the end of the whiskers (outliers) are displayed as points. The dotted line indicates the position of the average voter (0, by construction).
Results
Estimating ideological segregation and polarization
Our analysis focused on one of the most common forms of interaction on Twitter: retweeting, which involves reposting another user’s content with an attribution to the original author. Retweeting can be taken as an indicator of information diffusion, but not necessarily message endorsement (González-Bailón, Borge-Holthoefer, & Moreno, 2013). We utilized three different metrics of polarization: (a) the percentage of retweets that took place among individuals who were ideologically similar, (b) the degree of ideological homogeneity in communities of users detected in the retweet network, and (c) the average ideological extremity of the content that was spread via retweets.
We found that polarization levels varied significantly as a function of time and topic. The heat maps in Figure 2 show the percentage of retweets on each of the 12 topics according to the estimated ideology of the tweets’ original authors and of the users who retweeted the messages. With respect to political issues such as the government shutdown and marriage equality, the vast majority of retweets occurred within ideological groups, as indicated by the shading clustered along the 45° lines in Figure 2a. That is, liberals tended to retweet tweets from other liberals, and conservatives were especially likely to retweet tweets from other conservatives. For example, 38% of all retweets concerning the 2012 election took place among extreme conservatives (more than 1 SD to the right of the mean), and 28% took place among extreme liberals (more than 1 SD to the left of the mean)—although each of these groups represented only 16% of the users in our sample.

Ideological polarization in retweeting of content on (a) the six political topics and (b) the six nonpolitical topics in the tweet collections. The intensity of the shading of each cell (of size 0.25 SD × 0.25 SD) represents the percentage of retweets that were published originally by users with estimated ideology of x and retweeted by users with estimated ideology of y. The highest level of polarization—which would occur if users spread only information transmitted by those who were ideologically indistinguishable from themselves—would correspond to 100% of retweets falling along the 45° line.
At the same time, not all conversations were consistent with the traditional echo-chamber view of Internet communication (Garrett, 2009a). As Figure 2b shows, retweets about nonpolitical topics, such as the Boston Marathon bombing, the 2014 Super Bowl, and the 2014 Winter Olympics, surmounted ideological boundaries, as indicated by the lack of shading clustered around the 45° line in the heat maps, except at the far right for some topics. Thus, current events that are unrelated to politics do seem to have the capacity to stimulate discussion among individuals who differ in their political opinions. In other words, we found that ideological homophily in the propagation of content related to nonpolitical events is low; in this sense, discussions of current events do not strictly conform to the image of an echo chamber.
Figures 3a and 3b provide additional evidence of topic-specific dynamics in retweeting. For the collections pertaining to the 2012 presidential-election campaign and the 2014 Super Bowl, we treated each dyadic interaction as an edge (line) of a network in which each node (dot) was a social-media user. We then used a force-directed layout algorithm to generate graphic depictions of these large-scale networks and looked for clusters, or “cliques,” of users so that we could determine whether these groups were ideologically homogeneous. This algorithm placed users who retweeted each other’s tweets often very close to one another and placed users who rarely or never interacted further apart. The network of retweets concerning the election campaign (Fig. 3a) appears to have had two large and distinct ideological clusters, one composed of conservatives and the other of liberals. These groups of users were distant from one another because of the relatively low level of cross-ideological interaction overall. By contrast, the network of retweets concerning the Super Bowl does not display any large cluster that is clearly identifiable and ideologically homogeneous (Fig. 3b); instead, there are many small, heterogeneous clusters, which indicates that liberals and conservatives interacted with each other to a considerable degree.

Additional results on polarization in retweeting behavior. The graphics in (a) and (b), which were created using a force-directed layout algorithm, depict the retweet networks for the tweet collections on the 2012 election and the 2014 Super Bowl. Each node (dot) represents one user (from a random sample, weighted by activity), and each edge (line) represents a retweet. Nodes are colored according to the ideology estimate of the corresponding user, from very conservative (dark red) to very liberal (dark blue). Edges are colored according to the ideology estimate of the user whose tweet was retweeted. White color denotes areas with a large number of nodes whose placement in the figure overlap. The bar graph (c) displays the average level of political polarization for each of the 12 collections in our study. Polarization was calculated as the average absolute distance, for all retweets on a topic, between the original author and the ideological center. Higher levels of polarization imply that the information that was spread via retweets featured content that was more ideologically extreme. The graph in (d) illustrates the evolution of this index of polarization in information diffusion as a function of the number of days passed since each collection was started. Results are shown for a selection of five issues. Each data point indicates the estimated polarization index for a given day, and the curves correspond to local regression lines with loess smoothing, with 95% confidence intervals in gray.
Figure 3c summarizes the average ideological extremity of retweeted content, computed as the average absolute distance, for all retweets on each topic, between the original author and the ideological center. The obtained values indicate that discussions of topics such as the minimum wage and the government shutdown were highly polarized, with the most frequently dispersed content generated by a relatively extreme set of authors. In contrast, tweets about the Super Bowl and the Boston Marathon bombing, to take two examples, were more likely to be retweeted if they were generated by middle-of-the-road sources than if they were generated by more extreme sources.
Finally, we found that Twitter responses to some specific events—such as the tragic elementary-school shooting in Newtown, Connecticut—exhibited a dynamic shift from national conversation to echo chamber (see Fig. 3d, which shows the polarization index for five issues on a day-to-day basis). The initial pattern of information diffusion was intermediate, but the level of polarization increased over time, as the conversation shifted from the tragedy to a debate over gun-control policy. A similar pattern—in the opposite direction—was discernible in our collection of tweets related to the possibility of a military intervention in Syria. There was an initial increase in polarization as liberals and conservatives debated the issue, before attention to the topic subsided and the level of polarization dropped.
Estimating ideological asymmetry
To investigate whether there is an ideological asymmetry in segregation and polarization, we used Poisson regression models to estimate the baseline probability that one user would retweet another user’s post given the observed marginal rates of retweeting by liberals and conservatives as well as their likelihood of being retweeted. By computing these expected rates of retweeting, we could then examine whether cross-ideological retweets were more or less likely to occur than would be expected on the basis of chance (see Section 5 of the Supplemental Material for additional details). Figure 4 summarizes the results of this analysis.
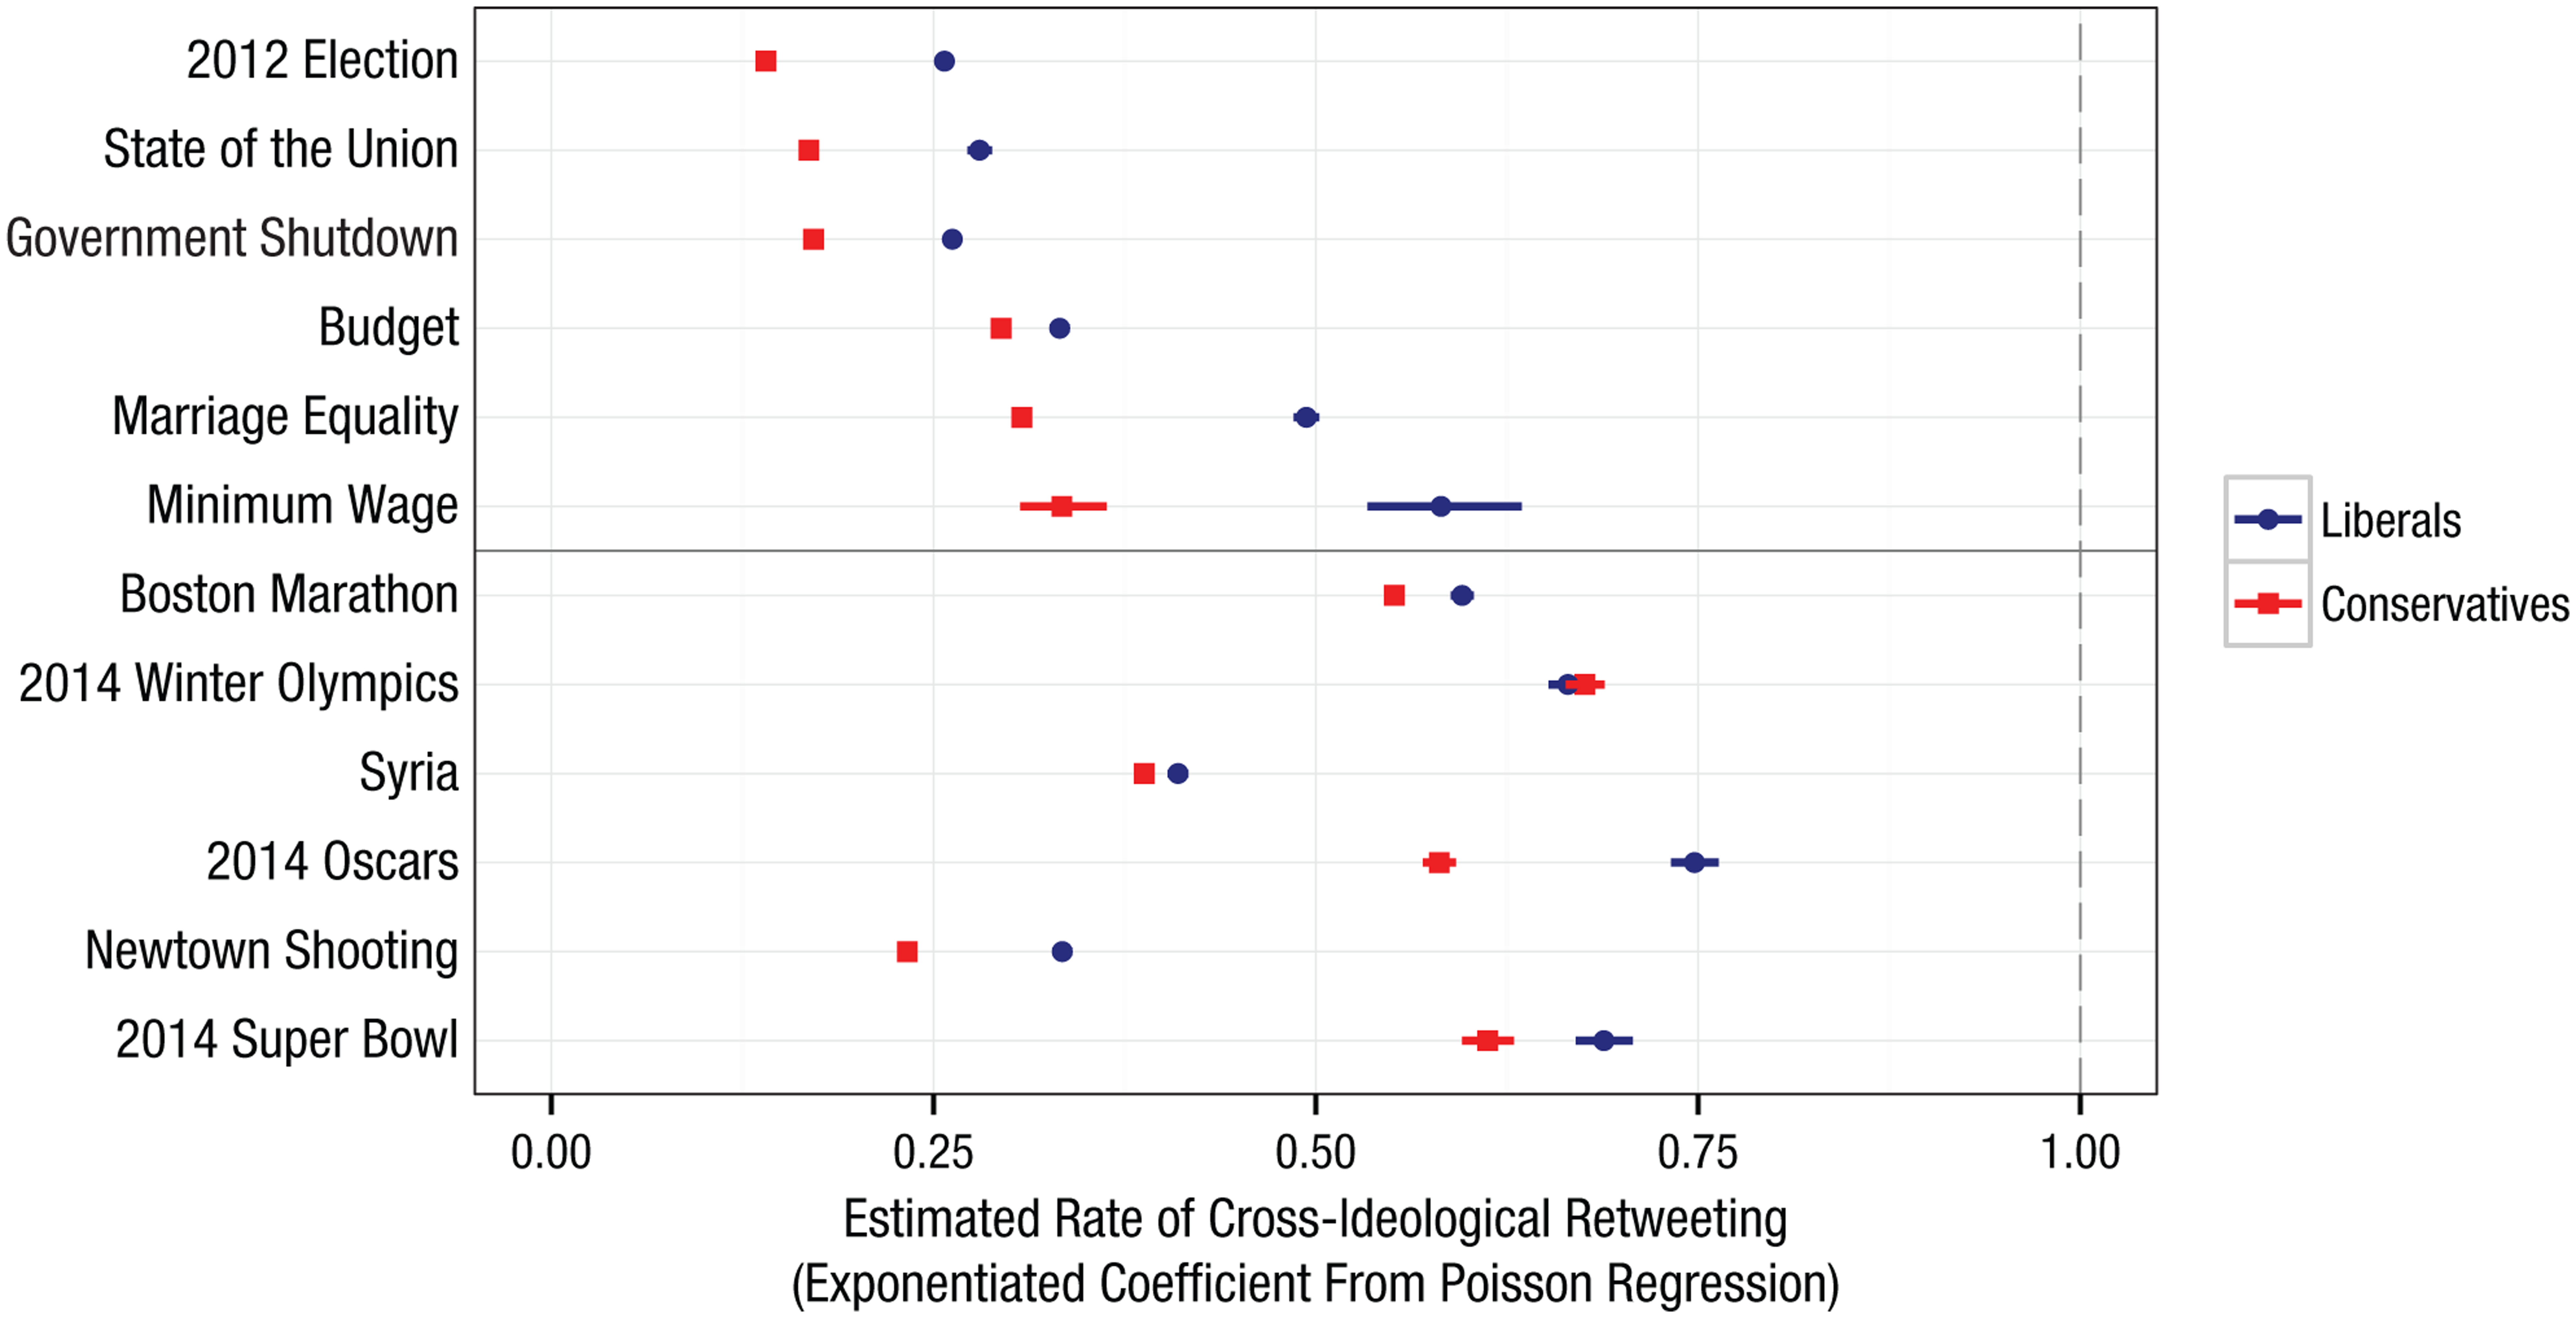
Liberal-conservative asymmetries in cross-ideological retweeting. The graph shows the estimated rate of cross-ideological retweeting for each tweet collection and for each ideological group after adjusting for each group’s propensity to retweet and be retweeted; each point corresponds to an exponentiated coefficient of a Poisson regression for the indicated topic and ideological group. The error bars indicate 99.9% confidence intervals (not visible in some cases because of their small size). An exponentiated coefficient of 1 (highlighted by the dashed vertical line) would indicate identical retweeting rates for individuals of the same and different ideological orientations—that is, a rate of cross-ideological retweeting that is equal to the rate of within-group retweeting.
Our analysis yielded three main results that are consistent with theory and research pertaining to ideological differences in epistemic, existential, and relational motivation. First, for all of the political topics, liberals were significantly more likely to engage in cross-ideological retweeting than were conservatives. For each retweet that took place between individuals of the same ideological orientation, there were between 0.20 and 0.30 cases of conservatives retweeting liberals, with some variation across topics, and between 0.25 and 0.50 cases of liberals retweeting conservatives. Second, the rates of cross-ideological retweeting were generally higher for nonpolitical topics than for political topics, although in all cases they were lower than would be expected in the absence of ideological considerations (i.e., to the left of the vertical dashed line in Fig. 4). Third, the ideological asymmetry in cross-ideological retweeting was generally smaller in magnitude for nonpolitical than for political topics. For the Boston Marathon bombing and the Super Bowl, the difference between liberals’ and conservatives’ rates of cross-ideological retweeting was small, and in the case of the Winter Olympics, the difference between liberals and conservatives was not statistically significant.
General Discussion
Overall, we observed that online communication structures are flexible and situation-specific, and that the aggregate level of political polarization depends heavily on the nature of the issue. For example, Twitter discussions of the 2012 election, the 2013 government shutdown, and the 2014 State of the Union Address resembled an echo chamber: Information about these events was exchanged primarily among individuals with highly similar ideological preferences. By contrast, responses to the Boston Marathon bombing in 2013, the 2014 Super Bowl, and the 2014 Winter Olympics fit the pattern of a national conversation, with individuals of differing ideological persuasions frequently reading and retweeting one another’s messages. Public discussion of other issues, such as the aftermath of the Newtown shooting in 2012, reflected a dynamic process, beginning as national conversations but transforming fairly rapidly into highly polarized exchanges. With respect to both political and nonpolitical topics, liberals were more likely than conservatives to engage in cross-ideological retweeting. We do not know the extent to which such behavior was carried out ironically or for the purpose of ideological criticism; in any case, it does seem that liberals were more likely than conservatives to expose themselves to differing opinions and to circulate those opinions. 4
Our research has important implications for the study of social behavior, political communication, and democratic theory. First, we observed considerable variation across time periods and topics in the extent to which conversations on Twitter were politically polarized. This suggests that some previous studies may have overestimated the degree of mass political polarization. Our results reveal that homophilic tendencies in online interaction do not imply that information about current events is necessarily constrained by the walls of an echo chamber; in some cases, information diffusion permeates the entire network (see Bakshy et al., 2015, for a similar conclusion). Second, from a normative perspective, the fact that individuals receive news and information from diverse ideological sources may improve the quality of the informational environment, as well as the fidelity of political representation (Mutz, 2006). These findings highlight the rich potential of social-media platforms to capture the dynamics of public opinion, and they illustrate the value of using social-media data to examine questions about human behavior in naturally occurring social and political contexts.
Conclusion
The ability to estimate the ideological preferences of millions of Twitter users provides a historically unique opportunity to investigate political communication, ideological segregation, and political polarization, along with many other forms of social and political behavior. Our analysis revealed that communication structures are dynamic and flexible and that citizens do come into contact with information from diverse ideological perspectives, which is often assumed to redound to the benefit of social capital, political representation, and public policy. The popularization of social media as a means of communication within interpersonal networks is not inevitably bounded by ideological contours, especially when it comes to nonpolitical issues and events. When it comes to explicitly political issues, individuals are clearly more likely to pass on information that they have received from ideologically similar sources than to pass on information that they have received from dissimilar sources. At the same time, we observed that liberals are significantly more likely than conservatives to participate in cross-ideological dissemination of political and nonpolitical information. This suggests that an important and underappreciated ideological asymmetry may exist in the structure and function of online political communication.
Footnotes
Acknowledgements
The authors gratefully acknowledge the assistance of data scientists Duncan Penfold-Brown and Jonathan Ronen of New York University’s Social Media and Political Participation (SMaPP) Lab, as well as comments on earlier versions of this article by Hal Arkes, Ken Benoit, Sam Gosling, Dustin Tingley, and several anonymous reviewers.
Declaration of Conflicting Interests
The authors declared that they had no conflicts of interest with respect to their authorship or the publication of this article. None of the funders were required to approve the publication of this article.
Funding
This research was supported by the INSPIRE program of the National Science Foundation (Award SES-1248077), the New York University Global Institute for Advanced Study, and Dean Thomas Carew’s Research Investment Fund at New York University.
Open Practices
All data have been made publicly available through the Harvard Dataverse Network and can be accessed at https://dx-doi-org.web.bisu.edu.cn/10.7910/DVN/F9ICHH. All materials have been made publically available at https://github.com/SMAPPNYU/echo_chambers. The complete Open Practices Disclosure for this article can be found at http://pss.sagepub.com/content/by/supplemental-data. This article has received badges for Open Data and Open Materials. More information about the Open Practices badges can be found at https://osf.io/tvyxz/wiki/1.%20View%20the%20Badges/ and  .
.
Notes
References
Supplementary Material
Please find the following supplemental material available below.
For Open Access articles published under a Creative Commons License, all supplemental material carries the same license as the article it is associated with.
For non-Open Access articles published, all supplemental material carries a non-exclusive license, and permission requests for re-use of supplemental material or any part of supplemental material shall be sent directly to the copyright owner as specified in the copyright notice associated with the article.
