
Abstract
Implicit social biases are ubiquitous and are known to influence social behavior. A core diagnostic criterion of autism spectrum disorders (ASD) is abnormal social behavior. We investigated the extent to which individuals with ASD might show a specific attenuation of implicit social biases, using Implicit Association Tests (IATs) involving social (gender, race) and nonsocial (nature, shoes) categories. High-functioning adults with ASD showed intact but reduced IAT effects relative to healthy control participants. We observed no selective attenuation of implicit social (vs. nonsocial) biases in our ASD population. To extend these results, we supplemented our healthy control data with data collected from a large online sample from the general population and explored correlations between autistic traits and IAT effects. We observed no systematic relationship between autistic traits and implicit social biases in our online and control samples. Taken together, these results suggest that implicit social biases, as measured by the IAT, are largely intact in ASD.
Keywords
Autism spectrum disorder (ASD) is a neurodevelopmental disorder diagnosed in part by profound difficulties in social and communicative behaviors. These difficulties are often the most disabling aspect of the disorder, especially in high-functioning individuals (American Psychiatric Association, 2013). Although people with ASD often have normal intellect, they process faces atypically (see Schultz, 2005), have difficulty interpreting social cues (Baron-Cohen, Wheelwright, & Jolliffe, 1997), and show impaired perspective taking and theory of mind (Moran et al., 2011). In addition, relative to typically developed (TD) individuals, people with ASD attend differently to social stimuli (Dawson et al., 2004), are less responsive to social rewards (Lin, Rangel, & Adolphs, 2012), and invest less energy in reputation management (Izuma, Matsumoto, Camerer, & Adolphs, 2011). It has been proposed that attenuated social motivation in people with ASD catalyzes the atypical development of social cognition by reducing their exposure to, and therefore fluency with, social stimuli (Chevallier, Kohls, Troiani, Brodkin, & Schultz, 2012).
Prejudices (i.e., stored evaluations of people, places, and things) and stereotypes (i.e., associations between social groups and particular attributes) guide decision making in a complex social world. These social biases 1 form early in development; for instance, by age 6, White children explicitly judge White individuals to be preferable to, and more likeable than, Black individuals (Baron & Banaji, 2006), perceive boys to be better at math than girls (Cvencek, Meltzoff, & Greenwald, 2011), and demonstrate explicit knowledge of the stereotypic associations between gender labels and toys (Martin, Wood, & Little, 1990). However, by age 10, children begin to adjust their reporting of such attitudes when explicitly asked about them (Baron & Banaji, 2006), which suggests the emergence of self-presentation concerns and reputation-management strategies.
In contrast to explicit measures of bias, implicit measures assess automatic associations between concepts and evaluations or attributes and, therefore, are less susceptible to self-presentation effects. For instance, in the Implicit Association Test (IAT), observers must rapidly categorize concepts (e.g., flowers, insects) and evaluations (e.g., good, bad), or concepts (e.g., White person, Black person) and attributes (e.g., mental, physical), using response mappings that are either congruent or incongruent with typical associations. The different response mappings are used in separate blocks. The reaction time (RT) advantage for congruent trials relative to incongruent trials (IAT effect) indicates the strength of the association between the concepts. The IAT has been used widely to demonstrate the existence of strong implicit biases, even among people who explicitly report not to hold these biases (Baron & Banaji, 2006). Furthermore, performance on the IAT has been shown to predict real-world behaviors despite explicit preferences to act in an unbiased manner (Kubota, Li, Bar-David, Banaji, & Phelps, 2013; Stanley, Sokol-Hessner, Banaji, & Phelps, 2011).
Acquisition of these social biases requires a person to be sensitive to social group information—that is, to categorize people according to psychologically relevant dimensions (e.g., race, gender, age, sexual orientation; see Bigler & Liben, 2007, for a review). Furthermore, meaning must be attached to these social groupings: Associations between social categories and attributes or evaluations must be encoded as they are observed in the environment (Bigler & Liben, 2007). For instance, individuals must pick up on overt statements linking social groups to attributes (e.g., “African Americans are violent”) or on covariation occurring in the environment (e.g., all U.S. presidents have been male). Given the evidence for impaired processing of social information in ASD (see also Kennedy & Adolphs, 2012), we hypothesized that social stereotypes and prejudices should be selectively attenuated in individuals with ASD. In contrast, nonsocial stereotypes and prejudices should be unaffected in ASD.
The handful of extant studies on this topic is inconclusive. Hirschfeld, Bartmess, White, and Frith (2007) found that young children with ASD were able to make normal behavioral attributions based on culturally transmitted race and gender stereotypes. This seemingly fluent use of explicit stereotype knowledge was found despite clear deficits in social-cognitive ability (e.g., theory of mind). In contrast, Kirchner, Schmitz, and Dziobek (2012) reported reduced implicit social biases in adults with ASD: Although they showed a significant (nonzero) IAT effect, it was smaller than in control participants. These results suggest that implicit social bias may be attenuated in ASD even when explicit social knowledge is relatively intact. The few studies on social biases in ASD have differed greatly in methodology and focused on a narrow range of biases, so that comparisons across different domains (e.g., social vs. nonsocial) or types of bias (evaluative vs. stereotype) are difficult. For instance, studies finding no ASD-linked abnormalities in social bias have used behavioral measures to which both implicit and explicit processes likely contributed (Da Fonseca, Santos, Rosset, & Deruelle, 2011; Hirschfeld et al., 2007), whereas the one study reporting reduced social bias in ASD used only a single IAT (Kirchner et al., 2012). Perhaps most important, none of these previous studies included a nonsocial control condition, which severely limits the conclusions that can be drawn about the social specificity of the findings.
We addressed these shortcomings by systematically investigating the magnitude of social and nonsocial implicit bias in ASD, as measured by the IAT. In addition, given evidence of distinct neural underpinnings for evaluative implicit biases (i.e., concept-evaluation associations) and stereotype implicit biases (i.e., concept-attribute associations; see Amodio, 2014, for a review), we included IAT tests for both types of bias to explore possible dissociations in ASD. First, we tested people with a diagnosis of ASD and matched control participants in the laboratory; we then extended the investigation to the general population, testing participants over the Internet. We report all measures, conditions, and data exclusions, as well as how we determined our sample sizes.
Method
Participants
Pilot study and sample-size determination
In a prior pilot study, we tested 15 to 22 individuals with ASD (depending on the task) and 37 matched control participants. Fourteen people in the ASD group and 10 in the control group also participated in the main study reported here; the sole criterion for their inclusion in the main study was availability. The pilot study found suggestive evidence for reduced implicit social biases in the ASD group (d for the between-groups effect ranged from 0.26 to 0.99 across the multiple IAT tasks used), but had low power because of the small sample size.
Given the initial findings of this pilot study, we recruited participants for further studies. Given the size of our participant pool, as well as ongoing recruitment and dropout rates, we aimed at a sample of 30 individuals with ASD for in-lab testing. Because our ASD sample size was necessarily limited, we supplemented the in-lab testing with an Internet-based study that could provide a larger sample size; on the basis of our prior findings and results reported in the literature, we decided that a sample size of 200 TD adults would be more than sufficient to detect any putative effects.
Laboratory samples
Our sample size and data-collection stopping rule were determined by the size of our participant pool. Thirty high-functioning adults with ASD were recruited. To be included in the study, participants had to meet the cutoff scores for ASD on the Autism Diagnostic Observation Schedule (ADOS, Module 4; Lord et al., 2000) and the diagnostic criteria for autism or Asperger’s syndrome according to the fourth edition of the Diagnostic and Statistical Manual of Mental Disorders (American Psychiatric Association, 1994). In addition, they had to be verbal, high functioning (Full Scale IQ above 85), located in the greater Los Angeles metropolitan area, and willing and able to complete all tests. IQ was assessed using one of the Wechsler tests: the first or second edition of the Wechsler Abbreviated Scale of Intelligence (Wechsler, 1999, 2011); the third or revised edition of the Wechsler Adult Intelligence Scale (Wechsler, 1981, 1997); or the third edition of the Wechsler Intelligence Scale for Children (in the case of 1 participant whose IQ was assessed during adolescence; Wechsler, 1991). Three participants were excluded from the final analyses because of extremely slow responding (e.g., inability to complete the tasks within the time span of their visit to the lab). Table 1 provides further details on the 27 remaining participants (23 male; 20 White, 3 Asian, 3 multiracial, 1 Indian).
Background Information for Each Participant Group

Note: The table presents means, with standard deviations in parentheses. Participants in the autism spectrum disorder (ASD) group were tested in the laboratory. Participants in the control group were matched to the ASD group and also tested in the laboratory. Participants from the general population (Mechanical Turk, or MTurk, workers) were tested on online versions of the stereotype Implicit Association Tests (IATs) or the evaluative IATs. Autism symptoms were assessed with the Autism Spectrum Quotient (AQ; Baron-Cohen, Wheelwright, Skinner, Martin, & Clubley, 2001), the Broad Autism Phenotype Questionnaire (BAPQ; Hurley, Losh, Parlier, Reznick, & Piven, 2007), and the Autism Diagnostic Observation Schedule (ADOS; Lord et al., 2000); higher scores indicate greater impairment. For the ADOS, the table presents data on the Communication score, the Reciprocal Social Interaction score, and the summed score (Communication + Social Interaction); the cutoffs listed indicate the minimum scores for diagnosing autism and ASD, respectively.
Thirty-eight neurologically and psychiatrically healthy American adults with demographic characteristics similar to those of the ASD group and no family history of ASD were recruited through our control database (30 male; 26 White, 5 Asian, 2 Black, 1 American Indian or Alaskan Native, 3 multiracial, 1 unspecified). Control participants were matched to our ASD sample on age, gender, and IQ (see Table 1 for further details).
All participants had normal or corrected-to-normal vision and gave informed consent under a protocol approved by the institutional review board of the California Institute of Technology.
Online samples
We recruited 401 adults to complete either the stereotype (n = 201) or the evaluative (n = 200) IAT tasks using Amazon’s Mechanical Turk (MTurk). The participant pool was restricted to MTurk workers who were located in the United States, had completed more than 1,000 Human Intelligence Tasks (HITs), and had an approval rating higher than 98%. Of this original 401, 59 were excluded for failing to complete the full battery of tests, for ignoring our instructions not to repeat tasks, or for making excessive errors (pressing the incorrect key two to four times on a single trial on more than 5% of trials or pressing the incorrect key more than four times on any single trial). Our final sample consisted of 342 American adults (183 male; 287 White, 20 Asian, 15 Black, 3 American Indian or Alaskan Native, 11 multiracial, 6 unspecified; see Table 1).
Materials
Implicit Association Tests
We administered five IATs, three social and two nonsocial. The social IATs were the race evaluative IAT, which tested associations between White and Black faces and positive and negative words (Greenwald, McGhee, & Schwartz, 1998); the race stereotype IAT, which tested associations between White and Black faces and words referring to mental and physical attributes (Amodio & Devine, 2006); and the gender stereotype IAT, which tested associations between male and female names and words related to career and family (Nosek, Banaji, & Greenwald, 2002). The nonsocial IATs were the nature evaluative IAT, which tested associations between words referring to flowers and insects and positive and negative words (Greenwald et al., 1998), and a novel shoe stereotype IAT, which tested associations between sneakers and dress shoes and words related to sports and business. The shoe stereotype IAT was designed specifically to be a nonsocial comparison for the social stereotype IATs, tapping into concept-attribute rather than concept-evaluation associations. Descriptions of the IAT stimuli are provided in the Supplemental Material available online.
Autism-related assessments
The Autism Spectrum Quotient (AQ; Baron-Cohen, Wheelwright, Skinner, Martin, & Clubley, 2001) and the Broad Autism Phenotype Questionnaire (BAPQ; Hurley, Losh, Parlier, Reznick, & Piven, 2007) were administered to all groups. The AQ is widely used to quantify autistic traits in the general population and to screen for possible ASD (which must then be diagnostically assessed with other instruments). The BAPQ has been used to quantify autism-like traits both in first-degree relatives of individuals with ASD (Hurley et al., 2007; Sasson et al., 2013) and in the general population (Wainer, Ingersoll, & Hopwood, 2011). Table 1 presents mean scores on these instruments for all groups.
Explicit scales
The following self-report scales were administered to assess explicit bias. Ratings on each scale were summed and reverse-coded as needed.
Modern Sexism Scale (MSS): This eight-item scale assesses relatively modern attitudes and beliefs about women (Swim, Aikin, Hall, & Hunter, 1995); higher scores reflect more strongly stereotypical beliefs and attitudes about gender.
Modern Racism Scale (MRS): This seven-item scale measures beliefs and attitudes toward Black Americans (McConahay, Hardee, & Batts, 1981); higher scores reflect stronger anti-Black beliefs and attitudes.
Internal and External Motivation Scales (IMS and EMS): This instrument assesses internal (five questions) and external (five questions) motivations for responding in unprejudiced ways (Plant & Devine, 1998); higher scores reflect higher levels of the indicated type of motivation.
Semantic differential (Greenwald et al., 1998): On 7-point scales (e.g., beautiful = 1, ugly = 7), participants rated the extent to which they associated Black people, White people, flowers, and insects with positive and negative words. Difference scores were computed (White – Black; flowers – insects) such that higher scores reflected more stereotype-congruent beliefs (e.g., that flowers are good and insects are bad).
Gender-role bias: As has been done in previous studies (White & White, 2006), to assess gender stereotypes regarding career and family life, we asked participants to rate the extent to which a man or a woman would perform better at various tasks (e.g., “take care of the home,” “manage employees”; 1 = man would perform better, 3 = man and woman would be equal, 5 = woman would perform better). Higher scores reflected more stereotype-congruent beliefs (i.e., that men are better at career-related tasks than women and women are better at family-related tasks than men).
Race occupation bias: Participants rated the extent to which a Black person or a White person would be more likely to excel at various occupations (e.g., college professor, basketball player; 1 = White more likely to excel, 3 = equal likelihood, 5 = Black more likely to excel). Higher scores reflected more stereotype-congruent beliefs (i.e., that Whites are intellectually inclined and Blacks are physically inclined).
Shoe-type bias: For this two-item measure, participants rated the relative extent to which a dress shoe and a sneaker would be linked to sports and to business activities (1 = sneakers are more closely related to the activity, 3 = both types of shoes would be appropriate for the activity, 5 = dress shoes are more closely related to the activity). Higher scores reflected more stereotype-congruent beliefs (i.e., that sneakers are associated with sports and dress shoes are associated with business).
Design and procedure
Standard procedures for administering the IAT were followed (Lane, Banaji, Nosek, & Greenwald, 2007; Nosek, Greenwald, & Banaji, 2005). In addition, both the order of congruent and incongruent blocks and the response hand were randomly counterbalanced across participants within the ASD, control, and two MTurk groups. The explicit scales were completed in Qualtrics, and the IATs were administered using a modified version of an open-source JavaScript Web program (Mason & Allon, 2013) based on the standard IAT (Greenwald et al., 1998; Lane et al., 2007). Table S1 in the Supplemental Material provides additional information on IAT administration, using the nature evaluative IAT as an example.
Participants in the ASD and control groups received all five of the IATs, split into two sessions: the evaluative session (nature evaluative IAT and race evaluative IAT, in random order) and the stereotype session (gender stereotype IAT, race stereotype IAT, and shoe stereotype IAT, in random order). The AQ and BAPQ were administered once, during the first session. The order of these two sessions was counterbalanced across participants, and sessions were separated by a median of 89.6 min (minimum of 38 min) to reduce practice effects. Total testing duration (excluding the break between sessions) was approximately 1 to 1.5 hr.
Participants recruited through MTurk completed only one of the two sessions (i.e., evaluative or stereotype) to reduce the possibility of attrition due to testing duration and due to the necessity of ensuring a break between the sessions. For all participants, explicit scales relevant to the specific session completed (stereotype or evaluative) were always administered after the other measures (see Fig. S1 in the Supplemental Material for a complete outline of test order).
Data analysis
Our data analysis focused on effect-size estimates and bootstrapped estimates of 95% confidence intervals (CIs; see Cumming, 2014). For the IATs, we report group mean D scores (effect-size estimates), computed according to the improved scoring algorithm (Lane et al., 2007). Specifically, we deleted trials with RTs greater than 10,000 ms and subjects for whom more than 10% of trials had RTs less than 300 ms. Next, we computed the inclusive standard deviation of RTs for (a) all trials in the two practice blocks (one incongruent and one congruent block) and (b) all trials in the two test blocks (see Table S1 in the Supplemental Material for block structure). We then computed the mean RT for each of these four blocks, computed the mean RT difference between the incongruent and congruent conditions for practice and test blocks separately, divided each difference score by its associated inclusive standard deviation, and computed D as the equal-weight average of the two resulting ratios. A positive D score indicated that participants held associations that are common in the United States (i.e., flowers–good, insects–bad; dress shoes–business, sneakers–sports; White–good, Black–bad; White–mental, Black–physical; male–career, female–family). For between-groups (control vs. ASD) comparisons, we report Cohen’s d effect-size estimates (Lakens, 2013). We calculated bootstrapped 95% CIs for estimates of the means using bootci.m in MATLAB (releases 2013b and 2014a; The MathWorks, Inc., Natick, MA; 10,000 bootstrap samples per estimate).
Results
IAT effects
Figure 1a shows the mean D score for each IAT for each participant group (plots of individual participants’ data are provided in Fig. S2 in the Supplemental Material). These data clearly show that IAT effects for the MTurk and control groups were very similar, that is, well within the 95% CIs of each other. In addition, the mean IAT effects for the MTurk samples were similar in magnitude to what has been reported in previous studies of the general population—race evaluative IAT: D = 0.44, 95% CI = [0.38, 0.50] (previous range of reported means: 0.45–0.52; Nosek et al., 2005); race stereotype IAT: D = 0.32, 95% CI = [0.27, 0.38] (previous range: 0.17–0.29; Amodio & Devine, 2006); and gender stereotype IAT: D = 0.37, 95% CI = [0.32, 0.41] (previous range: 0.42–0.46; Nosek et al., 2005). Figure 1a presents data from the whole (heterogeneous) online sample, but in keeping with approaches used in previous studies, in Table S2 in the Supplemental Material, we have provided IAT data separately for the White MTurk participants (n = 287) and for male (n = 183) and female (n = 159) participants. IAT effects were highly similar across these subsets of participants, with one exception being that female participants showed a stronger effect on the nature evaluative IAT (D = 0.85, 95% CI = [0.78, 0.91]) than did males (D = 0.66, 95% CI = [0.58, 0.73]).
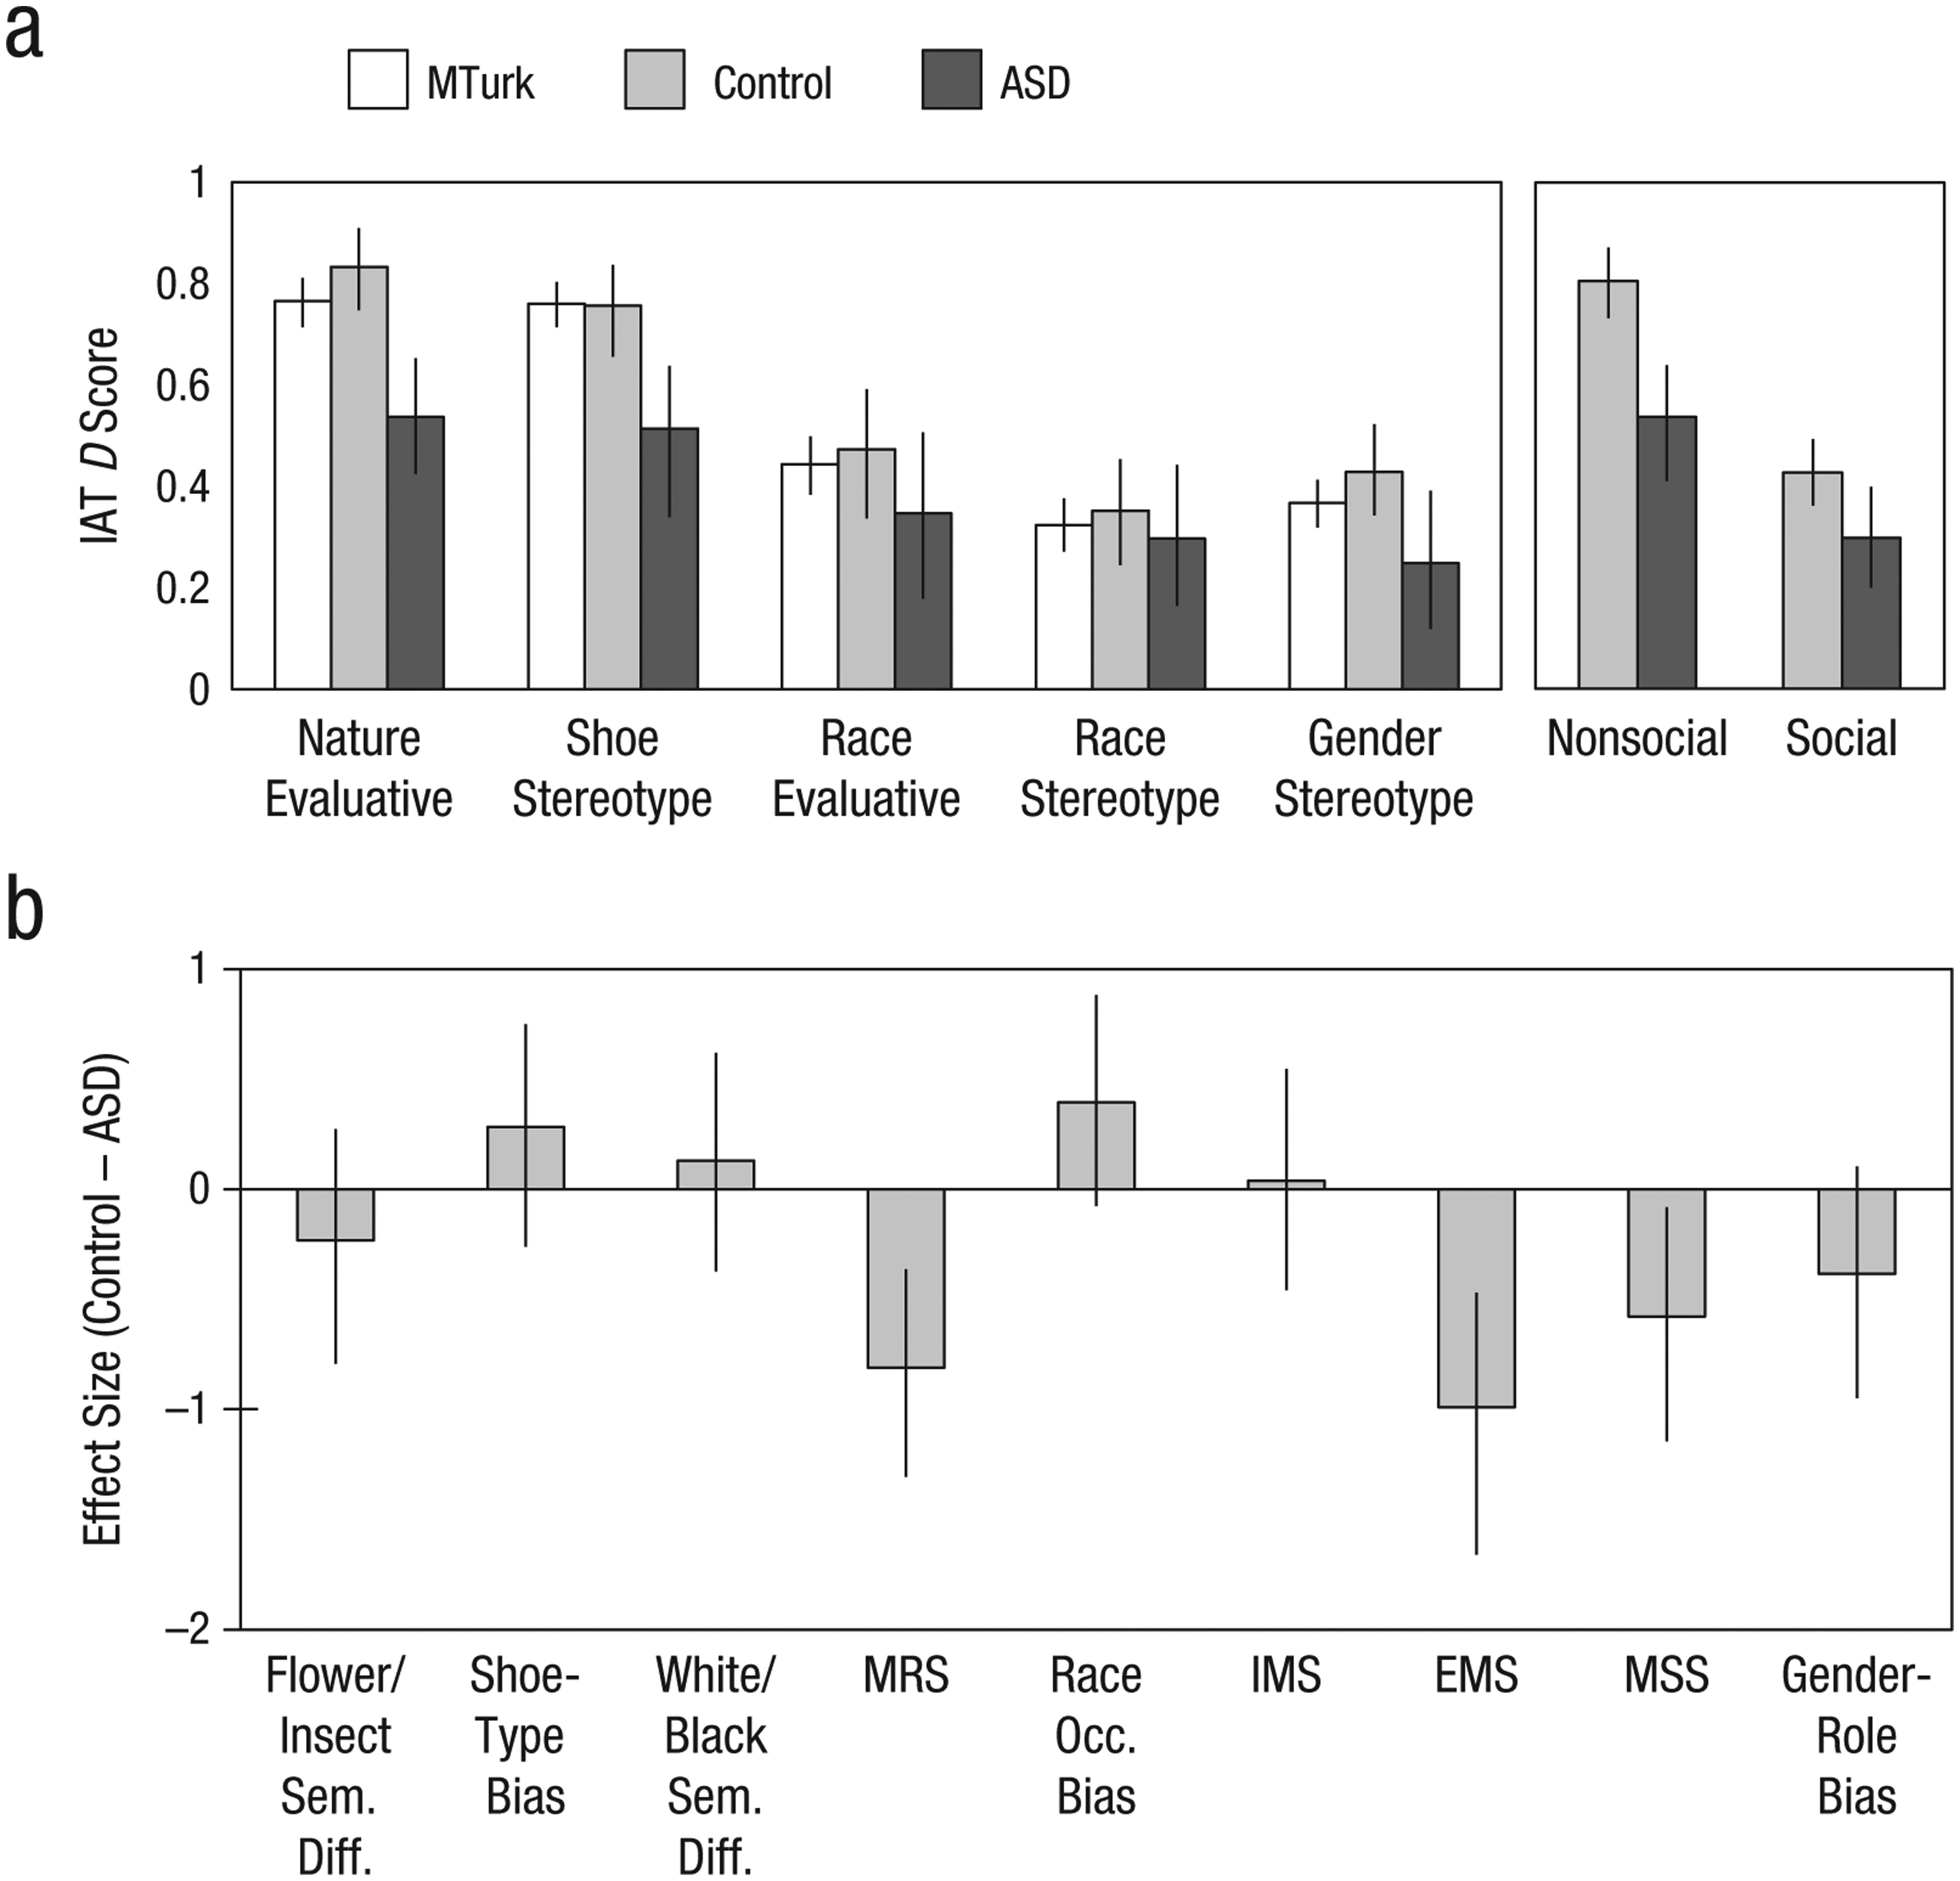
Comparisons of the participant groups’ responses on the Implicit Association Tests (IATs) and the explicit scales. In (a), the mean D score is shown for each of the five IATs, separately for the Mechanical Turk (MTurk), control, and autism spectrum disorder (ASD) groups. In addition, the graph on the right shows the average D score across the nonsocial IATs and the social IATs, separately for the control and ASD groups. The graph in (b) shows Cohen’s d for the mean difference between the control and ASD groups’ responses on each of the explicit scales (Sem. Diff. = semantic differential; MRS = Modern Racism Scale; Occ. = occupation; IMS = Internal Motivation Scale; EMS = External Motivation Scale; MSS = Modern Sexism Scale). Error bars represent 95% confidence intervals (estimated with a bootstrap procedure). Note that different MTurk groups completed the evaluative (N = 164) and stereotype (N = 178) IATs (for the control group, n = 36 for the nature evaluative IAT and 38 for all other IATs; for the ASD group, n = 26 for the gender stereotype IAT and 27 for all other IATs). (For the explicit scales, n = 38 for the control group and 27 for the ASD group.)
Figure 1a also indicates that, overall, the ASD group showed intact IAT effects across all tests (i.e., all 95% CIs excluded zero). Furthermore, although the IAT effects of the ASD group were slightly reduced relative to those of the control group, there was no evidence of an interaction between group and IAT type (i.e., social vs. nonsocial or evaluative vs. stereotype). To investigate whether the ASD group showed a selective reduction in social bias, we calculated mean D scores for the social IATs and the nonsocial IATs (see the graph on the right in Fig. 1a) and estimated Cohen’s d for the difference between the group means (control – ASD). The effect-size estimate for the group difference was large for the nonsocial IATs (d = 1.03, 95% CI = [0.57, 1.58]) and medium for the social IATs (d = 0.56, 95% CI = [0.05, 1.14]); in each case, the 95% CI excluded zero. However, the effect sizes for the social and nonsocial IATs did not differ from each other (i.e., the 95% CIs overlapped). These findings strongly suggest an effect of group (i.e., greater IAT effects for the control group than for the ASD group), but no interaction between group and the social content of the IAT. 2 Similarly, the between-groups effect size for evaluative IATs (i.e., nature and race evaluative IATs) was medium (d = 0.76, 95% CI = [0.25, 1.38]) and similar to the effect size for stereotype IATs (i.e., gender, race, and shoe stereotype IATs; d = 0.75, 95% CI = [0.25, 1.32]). These results suggest that ASD is not associated with a disproportionate impairment in one particular type of bias.
Because our ASD sample size was limited, we supplemented our main analysis by including additional data from our pilot study (nonoverlapping participants only) for the three IATs that were administered in both studies (gender stereotype, race evaluative, nature evaluative 3 ). This increased the size of the ASD group by 8 (2 females) and the size of the control group by 27 (3 females; see Table S4 in the Supplemental Material for demographic information for these participants). Bringing up our sample size to 100 (35 ASD and 65 control participants matched on Full Scale, Verbal, and Performance IQ as well as age), we found that the pattern of results did not change: The ASD group had smaller IAT effects than the control group, but this was consistent across the social tasks (d = 0.49, 95% CI = [0.04, 1.02]) and the nonsocial tasks (d = 0.70, 95% CI = [0.29, 1.18]; see Table S5 in the Supplemental Material for a summary of results for the two groups).
Explicit scales
For each of the explicit scales, we calculated the effect size (Cohen’s d; Lakens, 2013) of the group difference (control – ASD) and the 95% CI around the effect size (see Fig. 1b). Positive values would indicate a larger reported bias in the control group than in the ASD group (see Table S6 in the Supplemental Material for the online samples’ average scores on the explicit measures). In contrast to the IAT results, the results for the explicit measures revealed no scales on which the ASD group reported less bias overall than the control group (i.e., no positive d values had 95% CIs that excluded zero). In fact, the ASD group expressed stronger race-related (MRS, EMS) and gender-related (MSS) explicit biases than the control group.
Correlations between IAT effects and ADOS scores (ASD group)
Although group effects were consistent across social and nonsocial IATs, it was possible that the summary statistics obscured a relationship between individual differences in autism severity and IAT effects. To investigate this possibility, we focused on the data from the ADOS (Module 4), the gold standard in the field for quantifying current behavioral symptoms of autism. The ADOS consists of a structured interaction between a trained experimenter and the participant (duration of about 1 hr), which is videotaped and scored to consensus by trained raters (Lord et al., 2012). New scoring algorithms, including a new calibrated severity score for a Social Affect (SA) domain, have recently been developed (see Hus & Lord, 2014). Given this novel scoring algorithm, and some ambiguity concerning which scoring methods might be most appropriate to use for correlational analyses, we calculated correlations between IAT effects and four ADOS-derived metrics, all highly intercorrelated and all measuring social and affective behaviors: the total raw score, calculated by adding the Communication and Social Interaction raw scores; the total old-algorithm score, calculated by adding the Communication and Social Interaction algorithm scores; the new-algorithm SA score; and the new-algorithm SA calibrated severity score (SA-CSS). We took this approach both to provide completeness and to facilitate comparisons with previous and future work. We focused our analysis a priori on the newer metrics (i.e., SA and SA-CSS), as these were established to exhibit less covariation with factors unrelated to autism severity (i.e., age and IQ). To maximize our sample size, we again included data from our pilot study for the three IATs that were included in both studies (gender stereotype, race evaluative, and nature evaluative), for a total n of 35 in those cells.
The results of this correlational analysis are presented in Figure 2. For the two new scoring methods, we found weak to nonexistent correlations between ADOS score and IAT D score (correlations were also weak to nonexistent when we substituted raw RT differences between congruent and incongruent blocks for D scores; see Table S7 in the Supplemental Material). 4 Intriguingly, the largest negative correlation was between SA-CSS and the race evaluative D score, r(29) = −.39, 95% CI = [−.64, −.07], which suggests that those ASD participants who had the most severe autistic symptoms (in terms of social and affective behaviors) also had the lowest implicit evaluative race biases. However, we emphasize that the reliability of these correlations is limited by our sample size, and we note that we did not obtain the same pattern across the different methods for assessing autism symptomatology.

Results for the autism spectrum disorder group: scatterplots (with best-fitting regression lines) illustrating the correlations between D scores on the Implicit Association Tests (IATs) and scores on the Autism Diagnostic Observation Schedule (ADOS; Lord et al., 2000). Values in square brackets are bootstrapped 95% confidence intervals. Results are shown for four different ADOS metrics: the sum of the raw scores on the Communication and Social Interaction subscales, the sum of the Communication and Social Interaction scores using the old scoring algorithm, the Social Affect (SA) score according to the new algorithm on the revised ADOS, and the calibrated SA severity score (SA-CSS; standardized on a scale from 1 to 10). Note that the degrees of freedom for the correlations vary because the number of data points varied across the IATs (no participants in the pilot study took the shoe stereotype IAT, and only 2 of the participants in that study took the race stereotype IAT), and because raw ADOS scores (but not algorithm scores) were missing for 4 participants.
Correlations between IAT effects and AQ and BAPQ scores (control and MTurk groups)
To supplement the analysis just reported, we also looked at correlations between IAT effects and autistic traits in our groups without ASD, using the AQ and BAPQ scores. Figure 3 depicts scatterplots of these data and shows Pearson correlations calculated across all subjects to maximize statistical power. The correlations were small for all the IATs, and there were only two instances in which the 95% CIs excluded zero (the nature evaluative D score was negatively correlated with both AQ and BAPQ scores).

Results for the control and Mechanical Turk (MTurk) groups: scatterplots (with best-fitting regression lines) illustrating the correlations between D scores on the Implicit Association Tests (IATs) and scores on the Autism Spectrum Quotient (Baron-Cohen, Wheelwright, Skinner, Martin, & Clubley, 2001; top row) and the Broad Autism Phenotype Questionnaire (Hurley, Losh, Parlier, Reznick, & Piven, 2007; bottom row). The regression lines and correlations are for the two groups combined. Values in square brackets are bootstrapped 95% confidence intervals. Note that different online populations completed the evaluative IATs (n = 164) and the stereotype IATs (n = 178).
Possible sources of reduced IAT effects in ASD
In a final analysis, we considered possible sources of the global attenuation of IAT D scores that we observed in participants with ASD (Fig. 1). The IAT D score is calculated by taking the difference between RTs in the congruent and incongruent conditions and dividing it by the standard deviation of the combined RTs (Greenwald, Nosek, & Banaji, 2003; Lane et al., 2007). Given this, we considered the possibility that increased variability in RTs in individuals with ASD might account for some of the reduced IAT effects in our ASD sample. In two analyses, we (a) looked at raw RT differences to confirm the group-level effects and (b) examined residual IAT D scores after regressing out overall standard deviation in RTs. The first analysis revealed that the pattern of results remained the same when raw RT differences were used instead of D scores; ASD participants showed intact social and nonsocial implicit biases that were generally attenuated but not different from those of control participants (i.e., the 95% CIs overlapped; see Figs. S3 and S4 in the Supplemental Material). The second analysis revealed that the globally attenuated IAT effect in ASD persisted even when the standard deviation of RT was accounted for (see Supplemental Results in the Supplemental Material). Thus, we conclude that increased variability in RTs of ASD participants cannot account for the reduced IAT effects they exhibited relative to control participants.
Finally, to confirm that slowed responding by the ASD group could not account for their reduced IAT effects, we ran three separate regressions similar to those already described, but regressing out overall RT, RT in the congruent test blocks, and RT in the incongruent test blocks. Again, the overall pattern of results remained the same: Relative to the control group, the ASD group showed a slightly weaker overall IAT effect in each case (see Supplemental Results).
Discussion
We have presented the first systematic investigation of implicit biases in ASD, as measured by the IAT. We examined the extent to which implicit social biases are selectively attenuated in ASD, a disorder characterized by atypical social information processing. We found an overall reduction in the IAT effect in ASD, replicating Kirchner et al.’s (2012) finding for the race evaluative IAT. However, our study revealed that reductions in implicit bias in ASD are not specific to social categories, but appear to hold across all implicit biases, whether social or nonsocial. Furthermore, given that IAT effects were generally intact in this group (i.e., well above zero), we conclude that the basic mechanisms for forming implicit social associations remain intact in ASD.
In addition, on the basis of evidence for a dissociation between valence-based (i.e., evaluations) and semantic (i.e., stereotypes) associations (Amodio & Devine, 2006), we explored whether ASD-related abnormalities in these distinct types of bias could be identified. Indeed, there is evidence suggesting that children with Williams syndrome, a social disorder characterized by hypersociability and lack of social fear, show no evaluative race bias, despite having normal gender stereotypes (Santos, Meyer-Lindenberg, & Deruelle, 2010). However, our data suggest that both valence-based and semantic associations remain intact in ASD, as group differences did not vary between the evaluative (race, flower) and stereotype (gender, race, shoe) IATs.
We supplemented group-level comparisons with an examination of more continuous relationships between bias and individual differences in autism severity. Whereas correlations between IAT scores and autism severity were generally weak to nonexistent, we did find a moderate negative relationship between race evaluative IAT D score and ADOS severity score for social and affective functioning. Although this finding is potentially interesting, we hesitate to interpret it given the small sample and lack of consistency across different methods for assessing autism symptomatology (see Fig. 2). Instead, we suggest that future work should focus on replicating and further exploring this possible relationship. It may be that a disproportionate effect of autism symptomatology on implicit social evaluative biases is evident only in severe cases of autism (which our sample, by selection, did not include).
We also found no notable relationships between IAT effects and autistic traits in the general population (online participants and healthy control participants), for either the social or the nonsocial IATs (Fig. 3). Given the larger sample size in this case, we suggest that any associations between autistic traits in the general population (as indexed by the BAPQ and AQ) and implicit associations (as measured by the IAT) are weak at best.
Although we observed reduced (but intact) IAT effects in ASD, we found no evidence of reduced explicit ratings of bias in ASD. Indeed, if anything, participants with ASD reported more extreme biases than control participants on some measures of social biases (Fig. 1b). One explanation for this may be that individuals with ASD are less sensitive to social reputation concerns (Izuma et al., 2011) and are thus less inclined to engage in modulation of their responses on surveys assessing explicit bias. Our findings for explicit bias converge with those of previous studies (Da Fonseca et al., 2011; Hirschfeld et al., 2007) in indicating that individuals with ASD have intact knowledge of culturally transmitted stereotypes.
By including social and nonsocial IATs in our study, we demonstrated that the previously observed attenuation of the IAT effect in ASD (Kirchner et al., 2012) is not specific to social categories, which suggests that it does not result from social impairments present in ASD. Rather, it may result from non-socially specific cognitive processing differences between individuals with ASD and TD individuals. Regression analyses ruled out the “simple” explanations that the observed attenuation in IAT D scores was due to increased RT variability or slower responding in the ASD population. Future work should focus on elucidating whether this overall attenuation reflects a true, consequential attenuation of implicit biases (i.e., one that affects actual behavior toward individuals belonging to a social group) or is an artifact of task-specific processing demands.
One limitation of the current study is that we used a single measure of implicit bias, the IAT, which requires explicit activation of category-level semantic knowledge. Therefore, our data do not address possible differences in the spontaneous activation of implicit biases during the course of everyday social behavior (e.g., when categories are not explicit and salient). Other procedures (e.g., evaluative priming—Fazio, Jackson, Dunton, & Williams, 1995; the affect misattribution procedure—Payne, Cheng, Govorun, & Stewart, 2005) may provide a more direct assay of spontaneous activation of implicit attitudes. We chose to focus on the IAT because it affords ease of comparison with previous work (e.g., Kirchner et al., 2012) and because it has been well documented to predict social decision making (e.g., Kubota et al., 2013; Stanley et al., 2011). Further, using only one task allowed us to consider multiple theoretically relevant distinctions (e.g., social vs. nonsocial, stereotype vs. evaluation) to provide a more nuanced understanding of implicit associations in ASD. Although it was outside the scope of the current study to include additional tests of implicit bias, future work should validate our findings across a range of tasks.
Indeed, it may be that although implicit social biases (at least, as measured by the IAT) remain largely intact in ASD, their downstream integration with other processes leads to atypical social decision making in the real world. In addition to using other tasks, future research should investigate whether IAT scores predict deliberative behaviors in individuals with ASD, as they do in TD individuals (e.g., Kubota et al., 2013; Stanley et al., 2011). Combining behavioral studies such as ours with neuroimaging could help to determine whether implicit associations are supported by the same neural substrate in people with ASD as in TD individuals. A final important note is that because our sample included only high-functioning adults with ASD, future studies investigating implicit biases across a range of ages and IQs would help to broaden the conclusions that can be drawn and might well uncover differences more severe or more specific than those we have reported here.
Footnotes
Acknowledgements
We thank Catherine Armstrong, Tim Armstrong, and Brian Cheng for their help with recruiting participants and collecting data, and Daniel Kennedy, Lynn Paul, and Christina Corsello for their help in confirming diagnoses of autism. We also wish to thank the participants and their families for committing their time to participate in the research.
Declaration of Conflicting Interests
The authors declared that they had no conflicts of interest with respect to their authorship or the publication of this article.
Funding
This work was funded by grants from the Natural Sciences and Engineering Research Council of Canada (Grant 611630 to E. Birmingham) and from the U.S. National Institute of Mental Health (Grant R01MH080721 to R. Adolphs and Grant K01MH099343 to D. Stanley).
Open Practices
All data and materials have been made publicly available via Open Science Framework and can be accessed at https://osf.io/9tu5r/. The complete Open Practices Disclosure for this article can be found at http://pss.sagepub.com/content/by/supplemental-data. This article has received badges for Open Data and Open Materials. More information about the Open Practices badges can be found at https://osf.io/tvyxz/wiki/1.%20View%20the%20Badges/ and ![]() .
.
Notes
References
Supplementary Material
Please find the following supplemental material available below.
For Open Access articles published under a Creative Commons License, all supplemental material carries the same license as the article it is associated with.
For non-Open Access articles published, all supplemental material carries a non-exclusive license, and permission requests for re-use of supplemental material or any part of supplemental material shall be sent directly to the copyright owner as specified in the copyright notice associated with the article.