



Abstract
The two studies reported here tested whether a classroom-based psychological intervention that benefited a few African American 7th graders could trigger emergent ecological effects that benefited their entire classrooms. Multilevel analyses were conducted on data that previously documented the benefits of values affirmations on African American students’ grades. The density of African American students who received the intervention in each classroom (i.e., treatment density) was used as an independent predictor of grades. Within a classroom, the greater the density of African American students who participated in the intervention exercise, the higher the grades of all classmates on average, regardless of their race or whether they participated in the intervention exercise. Benefits of treatment density were most pronounced among students with a history of poor performance. Results suggest that the benefits of psychological intervention do not end with the individual. Changed individuals can improve their social environments, and such improvements can benefit others regardless of whether they participated in the intervention. These findings have implications for understanding the emergence of ecological consequences from psychological processes.
Psychological interventions, however brief, can change the way people perceive their environment and thus create profound and lasting changes in their attitudes and behaviors (for reviews, see Cohen & Sherman, 2014; Yeager & Walton, 2011). An important question follows from this fact: What effect are all of these changed individuals having on the people around them?
In classrooms, individual students who benefit from an intervention might also change their classroom dynamic in ways that benefit the entire class. Might these collective benefits be greater than the sum of the individual gains that sparked them? Following Bronfenbrenner’s (1977) ecological approach, we suggest that individual-level effects from a psychological intervention can sum to a changed social environment that has emergent effects unto itself (Cook, Purdie-Vaughns, Meyer, & Busch, 2014).
How do psychological processes within an individual yield collective consequences? In some cases, a benefit from a psychological intervention could spill over from influential peers in the intervention group. For instance, after popular children participated in an antibullying program, their friends and peers who did not participate tended to adopt the positive behaviors that the popular children had learned (Paluck, 2011; Paluck & Shepherd, 2012; see also Bond et al., 2012).
Alternatively, from an ecological perspective, individuals who participate in an intervention might alter the dynamics of their social environment in ways that return benefits for all, participants and nonparticipants alike. Benefits in a classroom might include improved norms, an orderly environment, and a more energized teacher (see Kounin, 1970). The benefits from the improved environment could derive from mechanisms different from those that produced the initial benefits for the individual students involved in the intervention. Such a dynamic ecological process can ripple through a system as a “collective potentiation” (Zajonc & Mullally, 1997, p. 685).
Theories such as collective potentiation and the broken-windows theory (Wilson & Kelling, 1982) have been based on observational studies suggesting that small, ground-level improvements can yield far-reaching ecological effects. To our knowledge, there is no experimental evidence that an individual-level psychological intervention can yield ecological consequences. We conducted the first such experimental test by analyzing data from two of our previous field experiments (Cohen, Garcia, Apfel, & Master, 2006; Cohen, Garcia, Purdie-Vaughns, Apfel, & Brzustoski, 2009). Both showed individual-level effects following a psychological intervention. These studies, which provided data for the present Study 1, had previously revealed that the grades of African American students in the intervention group improved in the targeted course. The intervention was a values affirmation administered as a structured writing exercise. It was expected to lessen stereotype threat, the fear of confirming a negative stereotype (Steele, 1988; Steele, Spencer, & Aronson, 2002; see also Cohen & Sherman, 2014). Individual students were randomly assigned to write about either a self-selected important value or a neutral topic. This intervention increased African Americans’ official fall grades in the targeted course.
Another study provided data for the present Study 2 (Cook, Purdie-Vaughns, Garcia, & Cohen, 2012). This study took place at the same school and tested the effectiveness of intervening earlier in the school year before cycles of poor performance and detachment became established. Students were randomly assigned to either an early- or a later-affirmation condition. Relative to African American students who completed the affirmation 1 month into the fall, African American students who completed it in the 1st week experienced significant gains in their official fall grade in the targeted course.
Both of the present studies were double-blind, controlled experiments in which each participating student in each classroom was randomly assigned to one of two conditions. Two aspects of these studies were critical to our research question. First, the key psychological intervention (or treatment) chiefly benefited African American students. Second, natural variation in the number of African American students who participated in the intervention within each classroom allowed us to calculate each classroom’s treatment density.
We tested whether students in classrooms with high treatment densities would experience individual-level gains that were distinct from the sum of individual-level gains experienced by African Americans who completed the intervention. If support for the treatment-density effect was found, three possible manifestations would be explored. First, we would investigate whether classrooms with greater treatment density have higher odds of spillover from students who completed the intervention to students who did not (the control group). If so, treatment-density effects should be limited to African Americans in the control group, as European Americans did not benefit from the original intervention and as African Americans who received the intervention did not appear to benefit more from receiving multiple sessions (Cohen et al., 2009; Cook et al., 2012). Second, we would explore whether African Americans in classrooms where treatment density was higher experienced less stereotype threat insofar as they observed fewer same-race peers performing poorly (Cohen & Garcia, 2005). If so, the benefit of treatment density should be isolated to African American students regardless of intervention condition.
A third possibility would be that treatment density might improve the classroom experience for students as a whole regardless of their race or intervention condition. In our 2006 study, we reported that the intervention halved the number of African American students who received a D or below. Classrooms with reduced numbers of struggling students are a different experience for everyone in them. Compared with classrooms in which fewer students received an intervention, such classrooms are likely to have stronger norms of achievement, possibly fewer behavioral disruptions, and more time for teachers to effectively teach a smaller and more manageable number of underperforming students. All these changes could improve the classroom dynamics—and, with them, the academic performance—for students as a whole in the classroom and perhaps particularly for students with poor performance who, without teacher intervention, might otherwise fall further behind.
The Present Studies
In two studies conducted with different cohorts of students at the same school, we tested whether greater treatment density led to distinct individual gains in academic performance over and above the intervention effects already found in our previous work (Cohen et al., 2006, 2009; Cook et al., 2012). In Study 1, treatment density was calculated from the difference between the number of African American students in the intervention condition and the number in the control group in a given classroom. A two-level model was used to measure the effects of classroom treatment density on academic performance at the individual level. In Study 2, treatment density was calculated from the difference between the number of African American students who received the more-effective early intervention and those who received the less-effective later intervention in a given classroom. Study 2 reproduced the effect of treatment density on academic performance that was found in Study 1.
Study 1
Our first study investigated the relationship between treatment density and official fall grades in the targeted class, either math or social studies, using a two-level model that included the same covariates included in Cohen et al. (2006) and Cohen et al. (2009). We predicted that greater treatment density would yield higher academic performance over and above the previously reported intervention effects.
Method
Participants
Participants were 7th graders from middle- to lower-middle-class families attending a suburban northeastern middle school. All students who returned parental consent forms were included. To test for classroom-wide effects, we included students of all ethnicities. Students were about evenly divided between African Americans (n = 173) and European Americans (n = 188), with a smaller number of students of other races (n = 53). Two additional students left the school before the end of the first term and thus provided no data. As reported in Cohen et al. (2009), all students who were in school on the days of the intervention were included in the analyses, with four exceptions: 1 student had missing baseline-grade data (retaining this student by imputing the missing baseline grade had no impact on the key results), 1 student did not understand the instructions, and data from 2 students were excluded because of experimenter error (they received both intervention and control exercises; see the supplemental material in Cohen et al., 2009).
Study 1 was conducted in 45 classrooms near the beginning of the school year, when psychological threat was assumed to be high and intervention might be especially beneficial (Cohen & Sherman, 2014). Each participating student was randomly assigned at the individual level either to the intervention condition or to the control condition. Because consent to take part in the study was voluntary, the percentage of classmates who participated in the study varied between classrooms. Because of absences and odd numbers of students, the number of participants who received the intervention versus the number who received the control exercise varied randomly within classrooms. On average, half of the students in each classroom participated in the study (M = 50%, SD = 17%). The average number of students per classroom was fairly constant (M = 18.62, SD = 3.05).
Procedure
The original studies found that only African Americans benefited from the intervention, which lowered their experience of stereotype threat and raised their academic performance (see Cohen et al., 2006, 2009). In the present study, we tested whether students in classrooms with greater densities of African Americans participating in the intervention would experience benefits that were statistically distinct from the previously reported effects. Treatment density was calculated for each classroom as the difference between the number of African Americans in the intervention and control conditions, multiplied by the study participation rate for that classroom (see Fig. 1). The difference score captures the degree to which there is a cluster of participants in a classroom that reinforces higher, versus lower, achievement. For instance, negative difference scores indicate that the majority of African American participants did not receive the intervention and are likely experiencing higher degrees of stereotype threat, while positive difference scores indicate that the majority received the intervention and are likely reinforcing a norm of higher achievement.

Treatment density in two example classrooms. White and Black circles represent White and Black students, respectively. For Black students, “C” and “I” indicate whether the student was in the control or intervention group. Gray circles represent nonparticipants, whose race was unknown. We calculated the treatment density for each classroom by subtracting the number of Black students in the control group from the number of Black students in the intervention group, and then multiplied the result by the percentage of students in the classroom who participated in the study.
We multiplied this difference score by the total fraction of a class that participated in the study in order to account for the degree to which this cluster would be influential in a classroom relative to its size. We expected that clusters making up a larger percentage of their classroom would have a greater influence on their classroom. Higher classroom participation in the study magnified the treatment-density score in a positive direction if the majority of African Americans students were in the intervention group and in a negative direction if the majority were in the control group. For example, in a classroom with 3 African Americans in the intervention group and 2 in the control group, and with 50% overall class participation, treatment density would be calculated as (3 – 2) × .50 = .50. The ethnicity of nonparticipants was not known, so it was not possible to count nonparticipating African Americans as controls. In all reported findings, the coefficient for treatment density represents the expected increase in a student’s letter grade associated with a 1-unit increase in their classroom’s treatment density (e.g., 1 more African American student completing the intervention in a classroom with 100% study participation or 2 more African American students completing the intervention in a classroom with 50% study participation).
Virtually all reported treatment-density effects remained statistically significant even when treatment density was not weighted by classroom participation (see Results). Weighting by classroom participation increases the precision of the density score without introducing systematic bias. It magnifies the influence of both positive and negative density scores. Also, higher participation-weighted treatment-density scores were not confounded with key third variables, such as higher baseline classroom performance, rs < |0.1|, ps > .250, and, as reported in the Results, controlling for average baseline classroom grades at Level 2 of analyses left all reported effects of density intact.
During the administration of the intervention, students received sealed envelopes with writing materials from their teachers, who were blind to intervention condition and the research hypotheses. In silence, students in the intervention condition wrote about their most important values, such as friendships or artistic ability, while students in the control condition wrote about their least important values (see the supplemental material in Cohen et al., 2006, for details). After approximately 15 min of writing, students placed the materials back in their envelopes, and the materials were returned to the researchers. Students believed they were participating in a regular classroom writing exercise and were unaware that the exercise was a psychological intervention or part of a research study.
Previous regression analyses revealed that for African Americans, grades were higher in the intervention than in the control condition, but there were no significant differences between the two conditions for European American students (Cohen et al., 2006). Our interest in detecting ecological effects necessitated a two-level model that accounted for the experimental condition of each student (i.e., intervention or control) at Level 1 and the treatment density of each student’s classroom at Level 2.
Results
Analytic strategy
Analyses were conducted in the R statistical program (Version 3.1.2; R Development Core Team, 2013) using the packages lme4 (Bates, Maechler, Bolker, & Walker, 2013) and nlme (Pinheiro, Bates, DebRoy, Sarkar, & R Development Core Team, 2013) and included student-level variables nested within classrooms. In the results that follow, unstandardized effect sizes are reported as gammas (γs).
At Level 1, the primary variables of interest were student race, intervention condition, and their interaction. Race was entered as two orthogonal contrasts. The focal contrast compared White students (−1) with Black students (+1), with the small number of students from other ethnic and racial groups coded as 0. The second contrast compared White and Black students (both coded as +1) with students of all other ethnicities (−2). Intervention condition was contrast-coded (−1 = control, +1 = intervention).
As in previous research, theoretically specified covariates were also included at Level 1 (see Cohen et al., 2009). These included students’ 6th-grade grade point average (GPA; i.e., from the academic year prior to intervention), which was grand-mean centered on 0, and their grades on assignments (standardized) in the targeted class before the intervention was implemented. The models also included gender (contrast-coded; −1 = male, +1 = female) and all two-way interactions involving gender, race, and condition.
Students’ particular combination of teacher, classroom, and cohort (there were three separate cohorts of students, one each year) formed the 45 units of the Level 2 nesting structure. Treatment density was the only Level 2 predictor. In all models, treatment density was included as a predictor of the intercept, which was allowed to randomly vary. All other student-level predictors were fixed. The dependent variable was the official fall grade for each student, which ranged from 0.0 (F) to 4.33 (A+) in the intervention-targeted class.
Test of treatment density
The individual-level effects within our multilevel model (see Table 1) reproduced those reported in our previous work (Cohen et al., 2006, 2009): Only African American students saw benefits from the intervention. Above and beyond these individual-level effects of intervention condition, greater treatment density of African Americans in a classroom predicted higher fall grades for all study participants in that classroom, γ = 0.21, 95% confidence interval (CI) = [0.04, 0.38], t(43) = 2.53. In a classroom with 50% study participation, treating 2 additional African Americans would increase treatment density by 1 unit and increase the expected grade for a typical student in that classroom by one-fifth of a letter grade. These gains from treatment density are in addition to, and statistically distinct from, the individual-level effects of the intervention we previously reported in Cohen et al. (2006, 2009).
Results From the Multilevel Model Predicting Students’ Fall Grades in Study 1 (N = 414)

Note: Gender, intervention condition, and White-Black contrast were contrast-coded such that a score of −1 represented a White male in the control condition. For the other-race contrast, White and Black participants were coded as +1, and participants of other races were coded as −2. Preintervention in-class grades were standardized. Grade 6 grade point average (GPA) was grand-mean centered. Treatment density is the number of Black students who completed the intervention exercise minus the number of Black students who completed the control exercise, multiplied by the class participation rate. Treatment density was included as a predictor of the intercept, which was allowed to vary randomly.
Treatment density benefited students as a whole rather than only African American students. Follow-up analyses revealed that African American treatment-density effects did not depend on student race, intervention condition, or their interaction. Inclusion of these interactions did not improve model fit, χ2(5) = 1.37, p > .250, and none of the two- or three-way interactions with treatment density approached significance (ps > .250). If the benefits of treatment density were due to spillover of the intervention’s effects to students in the control condition, then African Americans in the control condition should benefit the most from treatment density. But the finding that treatment density was not moderated by race, intervention condition, or their interaction suggests that simple spillover did not account for the effects of treatment density. Simple-effects tests confirmed the consistency of density effects across subgroups. For instance, the simple effect of treatment density for participants in the control group, γ = 0.23, 95% CI = [0.04, 0.42], was virtually identical to the main effect of treatment density for all study participants, γ = 0.21, 95% CI = [0.04, 0.38]. Even European Americans, who were unaffected by the initial intervention, γ = −0.01, 95% CI = [−0.08, 0.07], t(356) = −0.21, were nonetheless earning higher grades in classrooms with greater densities of African Americans who benefited from the intervention, γ = 0.20, 95% CI = [0.01, 0.40], t(43) = 2.08. Thus, treatment density appears to have benefited students as a whole.
As noted previously, treatment density was calculated using the number of African American students in each condition. This was because African American students were the direct beneficiaries of the intervention. Because simple effects indicated that European American students’ grades did not increase from the intervention, γ = −0.01, 95% CI = [−0.08, 0.07], t(356) = −0.21, it was unlikely that treatment density based on the number of European American students would benefit students. Indeed, reanalyzing the data with treatment density based on the number of European American students who participated in the intervention (instead of the number of African American students who participated in the intervention) yielded a nonsignificant density effect on grades, γ = 0.10, 95% CI = [−0.08, 0.28], t(43) = 1.09.
Further testing confirmed that the effect of African American treatment density was robust to the additional individual-level and classroom-level covariates included in our previous studies (Cohen et al., 2006, 2009). The effect of treatment density on grades was significant after controlling at the student level for teacher team, cohort, and the interaction of preintervention in-class performance with teacher team, γ = 0.20, 95% CI = [0.05, 0.34], t(39) = 2.65. These analyses suggest that the density of intervention-treated African Americans in a classroom mattered even when controlling at the individual level for students’ specific teacher and cohort. The effect from treatment density was also robust to adding a classroom-level covariate for baseline performance, which did not predict fall grades, 95% CI = [−0.21, 0.26], nor did its inclusion in the model alter the size or confidence interval of the treatment-density effect in any meaningful amount.
To further understand the nature of the treatment-density effect, we probed whether density effects might vary as a function of student performance. We speculated that if students who participated in the intervention were more engaged in class, teachers might be freed to manage their classrooms more effectively and that the beneficiaries might be students with a history of poor performance in particular—those students who might otherwise “get lost in the cracks.” Having a classroom with fewer failing students might enable the teacher to reach more children that he or she might otherwise lack the time or resources to help.
To test whether the effect of treatment density varied as a function of students’ baseline performance, we returned to our original model. We combined the standardized versions of the two baseline-performance variables from the original model to create a new average baseline-performance variable (with its mean centered on 0) for each student. 1 Updating our original model to include this average baseline-performance variable and its interaction with treatment density revealed that average baseline performance moderated the effect of treatment density on fall grades in the targeted class, γ = −0.16, 95% CI = [−0.25, −0.06], t(358) = −3.22. Simple-effects tests revealed that students with low baseline performance (i.e., 1 SD below the sample mean) gained over a third of a letter grade for each additional unit of treatment density in their classrooms, γ = 0.36, 95% CI = [0.16, 0.56], t(43) = 3.69 (see Fig. 2). There were no significant benefits of treatment density for students 1 standard deviation above the mean in baseline performance, γ = 0.08, 95% CI = [−0.11, 0.27], t(43) = 0.81. In classrooms with 50% study participation, grades of students with low performance increased from a C to a C+ as a result of being in a classroom with 2 additional African Americans receiving the intervention.
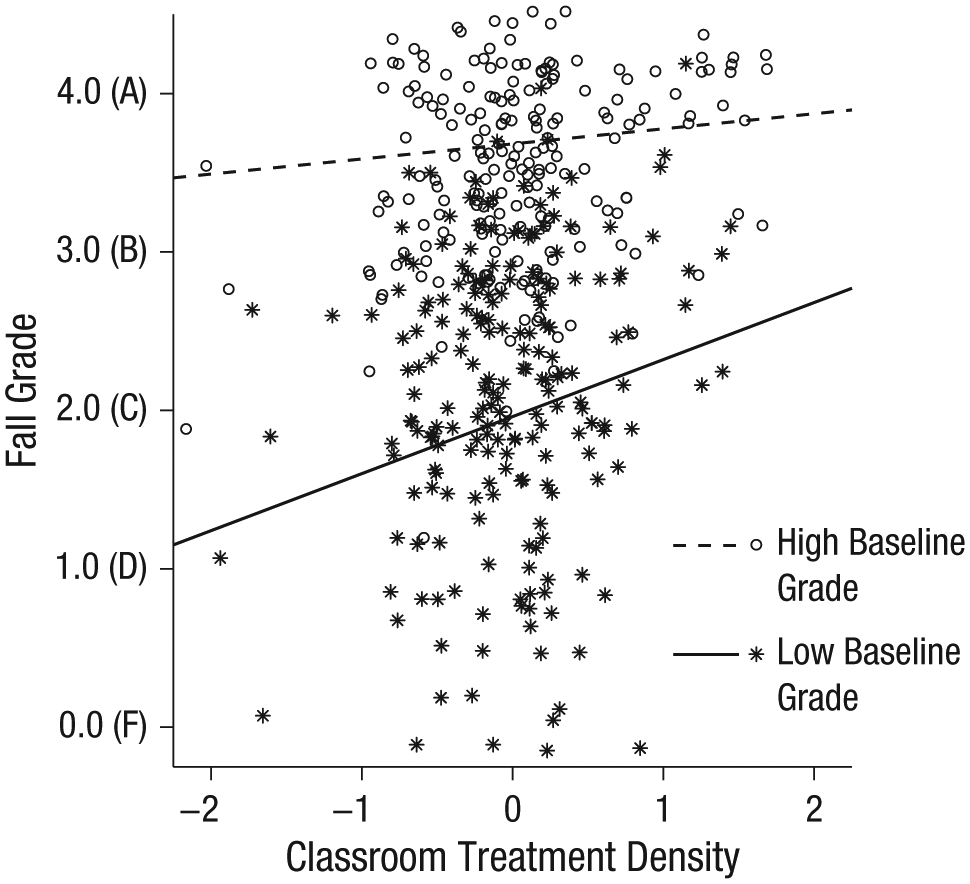
Results from Study 1: scatterplot showing the association between classroom treatment density and unadjusted final fall grade in the course targeted by the intervention. The best-fitting regression lines represent the simple slopes for students with high (1 SD above the mean) and low (1 SD below the mean) baseline grades and were adjusted for additional covariates used in the full model (i.e., contrasts for race, intervention condition, gender, and their two-way interactions; raw slopes are presented in Fig. S1 in the Supplemental Material available online). Baseline grades were calculated as the unweighted averages of grade point averages from the previous year and grades in the targeted class prior to the intervention (both standardized). For purposes of visual clarity, data points are slightly jittered to avoid overlap. All statistical tests were conducted using the continuous baseline-grades variable rather than the median split.
Expanding our model to include all two-, three-, and four-way interactions among treatment density, baseline performance, race contrasts, and intervention condition revealed that the interaction of treatment density and baseline performance was not moderated by race, intervention condition, or the interaction of race and intervention condition, ps > .250. Thus, treatment density primarily benefited students with low baseline performance regardless of their race and intervention condition. 2
Discussion
Study 1 suggests that while the individual-level intervention yielded benefits for African American students, aggregate-level treatment-density benefits went above and beyond these to aid classmates regardless of their race or intervention condition. Furthermore, treatment density chiefly benefited students with a history of poor performance. With evidence of emergent and collective consequences from an individual-based intervention, we sought to replicate our findings using data from another intervention study that was administered in a group setting but which we previously analyzed only for individual-level intervention effects.
Study 2
In Study 2 of our previous research (Cook et al., 2012), we demonstrated that timing the affirmation intervention early in the school year (i.e., the 3rd day of school) boosted grades of African American students relative to the standard, later timing of the same intervention (i.e., 4 weeks into the school year). To an extent not possible later, early intervention seemed to deflect the downward spiral of poor academic performance and weakened sense of belonging in school typically seen in middle school students. Because there again was natural variation in the number of participating students within classrooms who received the early (i.e., more effective) intervention, the same logic we used in Study 1 applied in Study 2: The greater the density of African American classmates receiving the intervention (the early intervention in this case), the greater the benefits for all students in that classroom.
Method
Participants
The students in Study 2 were a new cohort of 7th graders at the same suburban northeastern middle school as in Study 1. All students who returned parental consent forms were included in the study. Students were African American (n = 62), European American (n = 59), and from other ethnicities (n = 23) and came from middle- to lower-middle-class families. All students who were present in school on the days of the intervention were included in the analyses, with the exception of 1 student missing baseline grade data (retaining the observation by imputing the missing value had no impact on the key results). Fifteen classrooms were included in the study. On average, half of the students in each classroom participated in the study (M = 51%, SD = 11%). The average number of students in a given classroom was fairly constant (M = 18.93, SD = 2.92).
Procedure
In late August, students in the early-affirmation condition wrote about their most important values, while students in the later-affirmation condition wrote about their least important values. Approximately 4 weeks later, students in the later-affirmation condition wrote about their most important values, while students in the early-affirmation condition wrote about their least important values.
Our previous analyses of these data revealed that African American students in the early-affirmation condition had better fall-term grades in the targeted course than those in the later-affirmation condition (Cook et al., 2012). We sought to test whether the individual effects of the more-effective early intervention would accumulate to produce emergent aggregate effects, and thus we looked at early-treatment density in the present study. As reported in Cook et al. (2012), there was no significant interaction of race and timing of intervention: European Americans experienced a positive but nonsignificant effect of early intervention, while African Americans experienced a significant one. Because African Americans were the primary beneficiaries of early intervention, we calculated early-treatment density using African American students. Using the same logic as in Study 1, we calculated early-treatment density as the number of African American students who completed the intervention earlier minus the number of African American students who completed the same intervention later, multiplied by the classroom’s rate of participation in the study.
Results
Analytic strategy
While we used regression models in the previous publication to detect individual differences by gender, race, baseline performance, and experimental condition, our interest in detecting ecological effects again necessitated a two-level model. As in Study 1, our two-level model accounted for race, experimental condition, their interaction, and all the covariates at Level 1. Race and condition were contrast-coded using the same strategy as in Study 1, as was gender, which was included as a covariate. We also controlled for baseline grades (i.e., GPA from 6th grade, the year before the intervention), which was grand-mean centered on 0. Unlike in Study 1, the intervention was administered in the 1st week of 7th grade, so it was not possible to control for preintervention performance in the targeted course in 7th grade. As in Cook et al. (2012), our model excluded the interactions of gender with race and timing condition, because the addition of these interactions did not improve model fit, χ2(3) = 6.09, p = .107. The treatment density of each student’s classroom was the only Level 2 variable. In all models, treatment density was included as a predictor of the intercept, which was allowed to randomly vary. The dependent variable was students’ official fall grade in the social studies class in which the intervention was administered.
Test of early-treatment density
Our multilevel analysis revealed a main effect of early intervention that reproduced the effect reported in Cook et al. (2012). Additionally, the density of African American students receiving these early interventions within a classroom predicted additional, statistically distinct gains in fall grades (see Table 2), γ = 0.33, 95% CI = [0.04, 0.61], t(13) = 2.50.
Results From the Multilevel Model Predicting Students’ Fall Grades in Study 2 (N = 144)
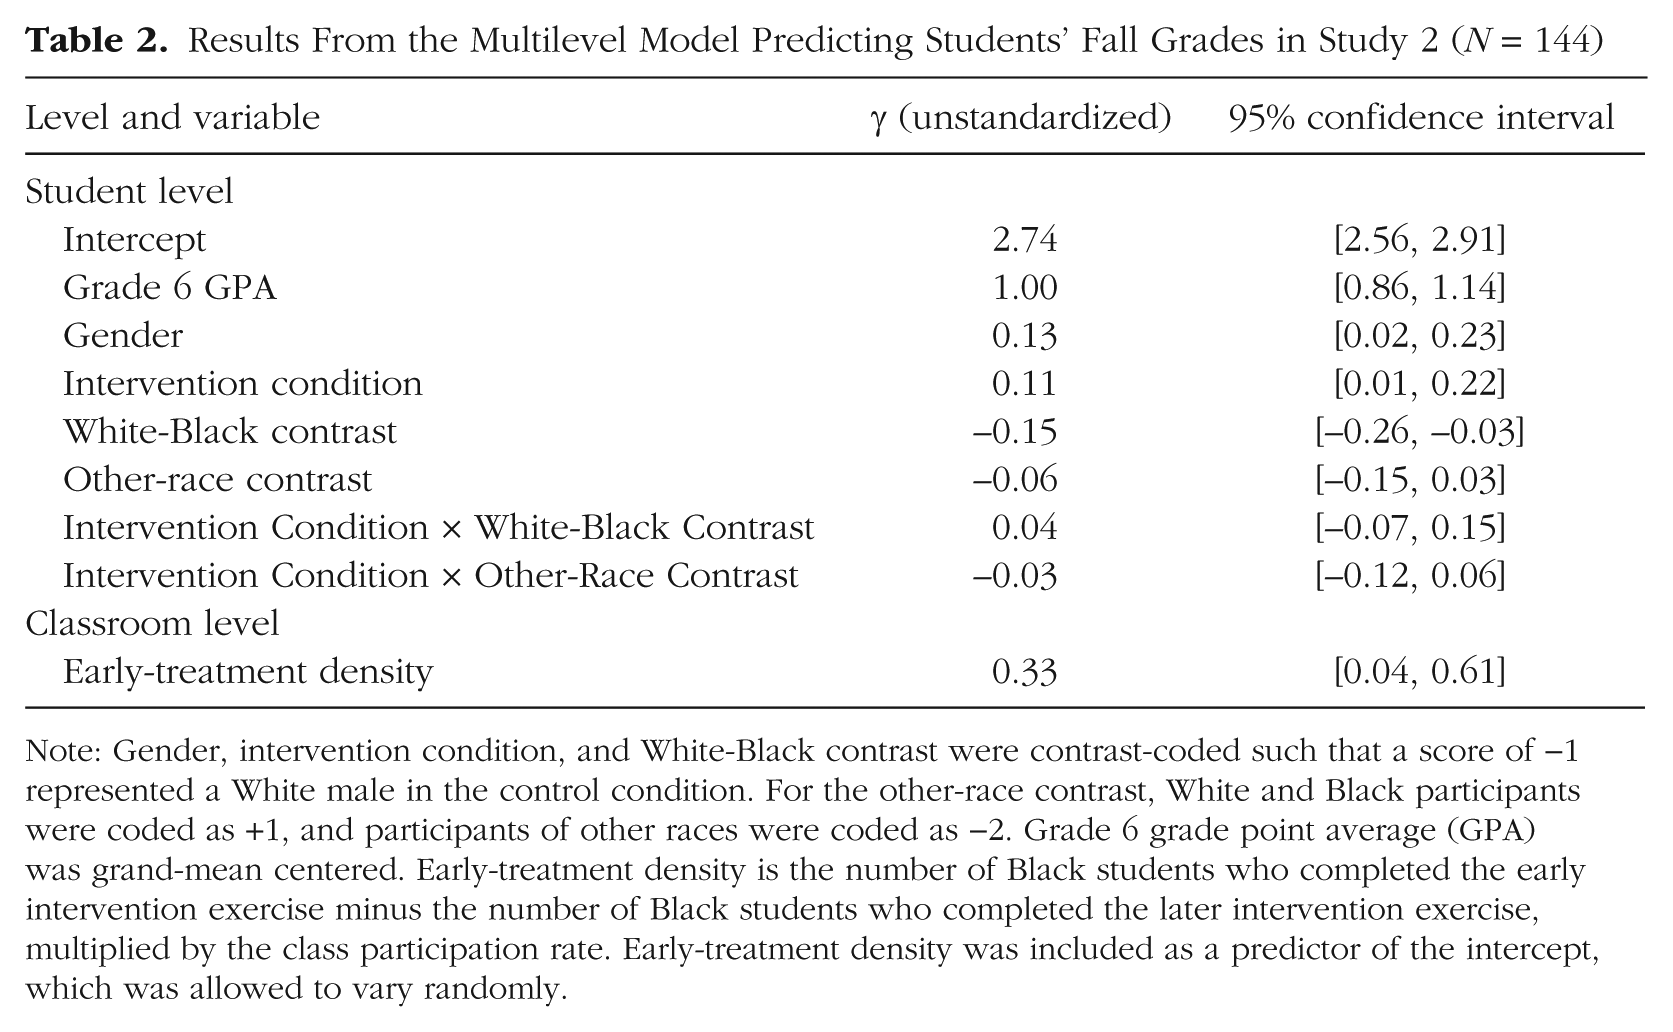
Note: Gender, intervention condition, and White-Black contrast were contrast-coded such that a score of −1 represented a White male in the control condition. For the other-race contrast, White and Black participants were coded as +1, and participants of other races were coded as −2. Grade 6 grade point average (GPA) was grand-mean centered. Early-treatment density is the number of Black students who completed the early intervention exercise minus the number of Black students who completed the later intervention exercise, multiplied by the class participation rate. Early-treatment density was included as a predictor of the intercept, which was allowed to vary randomly.
In a classroom with 50% study participation, the effect of early-treatment density suggests that a typical student would achieve about a third of a letter-grade gain for every 2 additional African American classmates who received early intervention. As in Study 1, the effect of African American early-treatment density did not vary by race, condition, or their interaction. The inclusion of these additional interactions did not improve model fit, χ2(5) = 7.46, p = .189. 3 This indicates that the effect of early-treatment density was consistent across race and condition, just as treatment density was in Study 1.
Early-treatment density was based on the number of African American students in each condition, because African American students were the chief beneficiaries of the intervention, as reported previously (Cook et al., 2012). Because European American students did not benefit as much individually from early intervention, we thought it unlikely that early-treatment density calculated from the number of European American students would affect classroom GPA. Consistent with this view, a separate model in which early-treatment density was calculated from European American students (i.e., the difference between European American students who received early and later interventions) did not significantly predict changes in grades, γ = 0.20, 95% CI = [−0.17, 0.56], t(13) = 1.17.
Again, as in our Study 1, the basic effect of African American treatment density was robust to the addition of teacher as a covariate, γ = 0.24, 95% CI = [0.03, 0.45], t(11) = 2.50. Controls for cohort and interactions with baseline in-class performance were not included in Study 2 because there was only one cohort and because the interventions occurred before student performance was assessed. As in Study 1, a classroom-level covariate for baseline performance did not predict fall grades, 95% CI = [−0.40, 0.73], nor did its inclusion in the model alter the size or confidence interval of the treatment-density effect in any meaningful amount.
As in Study 1, we speculated that early-treatment density might benefit students with a history of poor performance in particular. To our original mixed model, we added the interaction between early-treatment density and baseline academic performance (i.e., 6th-grade GPA grand-mean centered on 0). This model revealed a significant interaction between early-treatment density and baseline performance, γ = −0.22, 95% CI = [−0.39, −0.04], t(121) = −2.47. Simple-effects tests revealed that early-treatment density improved grades for students with low baseline performance (i.e., 1 SD below the sample mean), just as in Study 1, γ = 0.51, 95% CI = [0.20, 0.82], t(13) = 3.60. In a typical classroom from our study with 51% participation, grades of these “C students” increased by half a letter grade from being in classrooms with 2 additional African Americans who had received the early intervention (see Fig. 3). Among students with high baseline performance, there were no significant changes in grades due to being in classrooms with additional African Americans who received the early intervention, γ = 0.16, 95% CI = [−0.14, 0.45], t(13) = 1.13. As in Study 1, expanding our model to include all two-, three-, and four-way interactions among early-treatment density, baseline performance, race, and condition revealed that the interaction of early-treatment density and baseline performance was not moderated by race, intervention condition, or their interaction, ps ≥ .138. Early-treatment density appears to have primarily benefited students with low baseline performance regardless of their race and intervention condition. 4

Results from Study 2: scatterplot showing the association between classroom early-treatment density and unadjusted final fall grade in the course targeted by the intervention. The best-fitting regression lines represent the simple slopes for students with high (1 SD above the mean) and low (1 SD below the mean) baseline grades and were adjusted for additional covariates used in the full model (i.e., contrasts for gender, race, intervention condition, and the interactions of race contrasts with intervention condition; raw slopes are presented in Fig. S2 in the Supplemental Material available online). Baseline grades were calculated as students’ grade point averages for 6th grade. For purposes of visual clarity, data points are slightly jittered to avoid overlap. All statistical tests were conducted using the continuous baseline-grades variable rather than the median split.
Discussion
Like Study 1, Study 2 demonstrated that a psychological intervention could yield collective benefits statistically distinct from its individual-level benefits. The presence of more direct beneficiaries in a group yielded a collective benefit to the group as a whole. As in Study 1, these collective effects helped students regardless of race or intervention condition and again chiefly benefited students with a history of poor performance.
General Discussion
The key finding of the present research is that positive collective consequences can emerge from changing the psychological processes of the individual. The intervention triggered not only a change in individuals, but also through this, a change in group atmosphere, in which the interacting classroom forces found a new “quasi-stationary equilibrium” (Lewin, 1948, p. 46), one with benefits for all students regardless of whether they received the intervention.
How did treatment density confer these benefits? Further research is needed to understand precise mechanisms, but several possible accounts exist. For African American students, affirmations can improve academic performance at the individual level by reducing stress over being labeled with a negative stereotype (Cohen et al., 2006, 2009). Greater numbers of higher-performing African American students in a classroom may lower the stereotype threat experienced by other African American students in that environment (Cohen & Garcia, 2005). However, this explanation is unlikely because treatment density did not affect study participants differently by race. We found further evidence that treatment density did not lower stereotype threat. Data from two of the three cohorts in Study 1 (n = 258) indexed the accessibility of stereotype-relevant words among participants (see Cohen et al., 2006). Participants were asked to complete word fragments, such as “_ACE,” that could be completed with either a stereotype-relevant word, such as “RACE,” or a neutral word, such as “FACE.” While the intervention lowered the accessibility of stereotype-relevant words among African American participants (Cohen et al., 2006), treatment density did not predict an additional change in the accessibility of stereotype-relevant words, γ = 0.15, 95% CI = [−0.25, 0.55], t(28) = 0.78.
A simple mechanism of treatment-density effects is that classrooms with greater treatment density may have stronger norms of cooperation, order, and growth that benefit all students. In combination with these norms, the reduction in the number of African American students who received a D or below (see Cohen et al., 2006) may have enabled teachers to invest more time and energy into a more manageable number of struggling students (see Kounin, 1970). Consistent with this possibility, treatment-density benefits occurred most strongly among students who were previously low achievers. However, our study design did not assess any change in teacher or classroom dynamics. Thus, additional research is needed to confirm or rule out this and other potential mechanisms that explain how treatment-density effects emerge.
Social psychology has long acknowledged the importance of the situation to psychological functioning. But when considering the effects of psychological interventions, it has focused on their direct and immediate impact on the individual. This focus has become more expansive in recent years. Research on social networks has shown how the direct effects of an intervention can spread to nonparticipants in the same environment through peer contagion (Paluck & Shepherd, 2012). The focus can be expanded further to consider how psychological processes, triggered by an intervention, can change the environment itself, benefiting intervention participants and nonparticipants alike. The whole effect of an intervention can be greater than the sum of its direct effects on its recipients. The effect of a tossed stone does not cease upon its impact with a pond. The ripples it generates can create changes of their own, and in some cases, the series of events that follow could be of even more interest than the initial event that triggered them.
Footnotes
Acknowledgements
We thank the teachers and students for their participation, Stephanie Reeves for coding, and Melissa Giebler for editing.
Declaration of Conflicting Interests
The authors declared that they had no conflicts of interest with respect to their authorship or the publication of this article.
Funding
This research was primarily funded by grants from the National Science Foundation (Research and Evaluation on Education in Science and Engineering Division Award ID 0723909), the Spencer Foundation (Award 200800068), the William T. Grant Foundation, and the Russell Sage Foundation (Award 87-08-02). Additional support was provided by the Nellie Mae Education Foundation and the Institute for Social and Policy Studies of Yale University.

Open Practices
The data are available on request from J. T. Powers (
Notes
References
Supplementary Material
Please find the following supplemental material available below.
For Open Access articles published under a Creative Commons License, all supplemental material carries the same license as the article it is associated with.
For non-Open Access articles published, all supplemental material carries a non-exclusive license, and permission requests for re-use of supplemental material or any part of supplemental material shall be sent directly to the copyright owner as specified in the copyright notice associated with the article.
