
Abstract
The past decade has seen a rise in both economic insecurity and frequency of physical pain. The current research reveals a causal connection between these two growing and consequential social trends. In five studies, we found that economic insecurity produced physical pain and reduced pain tolerance. In a sixth study, with data from 33,720 geographically diverse households across the United States, economic insecurity predicted consumption of over-the-counter painkillers. The link between economic insecurity and physical pain emerged when people experienced the insecurity personally (unemployment), when they were in an insecure context (they were informed that their state had a relatively high level of unemployment), and when they contemplated past and future economic insecurity. Using both experimental-causal-chain and measurement-of-mediation approaches, we also established that the psychological experience of lacking control helped generate the causal link from economic insecurity to physical pain. Meta-analyses including all of our studies testing the link from economic insecurity to physical pain revealed that this link is reliable. Overall, the findings show that it physically hurts to be economically insecure.
The widening income gap, growing sense of financial desperation, and erosion of the middle class have elevated economic insecurity to the top of the political agenda for many countries (International Monetary Fund, 2015). According to the recent Survey of Economic Risk Perception and Insecurity, 93% of U.S. households experienced substantial decline in their wealth or earnings between 2008 and 2009, and for nearly 70% of households, earnings fell or expenses rose during that time (Hacker, Rehm, & Schlesinger, 2010).
The experience of physical pain has also increased dramatically in recent years. According to the Medical Expenditure Panel Survey, the economic cost of pain in the United States in 2008 was $635 billion, exceeding the combined costs of cancer, heart disease, and diabetes. This amount represents an increase of more than 1,000% from 20 years prior (Gaskin & Richard, 2012). State governments have enacted various measures to monitor and curb the growing dependence on painkillers, which increased by 50% from 2006 to 2012 (National Survey on Drug Use and Health, 2013).
In the current research, we tested the idea that these two trends may be causally connected. We hypothesized that objective and subjective economic insecurity directly increase the experience of physical pain. We also hypothesized that the psychological experience of lack of control is one generative process that links these two social trends.
Our findings shed light on the physiological consequences (pain) of an unmet psychological need (need for control), triggered by an increasingly prevalent social phenomenon (economic insecurity), and offer profound practical implications. By integrating the social psychology literature with health psychology, economics, and public policy, this research can contribute to a comprehensive understanding of the multifaceted impacts of psychological factors on human behavior.
Consequences of Economic Insecurity: Lack of Control and Physical Pain
We define economic insecurity as a state of uncertainty and unpredictability regarding one’s financial well-being; economic insecurity can manifest itself both concretely (e.g., as unemployment) and abstractly (e.g., as the possibility of future layoffs). That is, people derive their sense of economic insecurity from both their current economic situation and their perception of their future economic well-being. As a result, economic insecurity can occur across income spectrums.
Research has found that economic insecurity can cause distress outside of its direct financial effects. For instance, it can impair cognitive functioning (Mani, Mullainathan, Shafir, & Zhao, 2013), damage self-esteem (Heine, Proulx, & Vohs, 2006), and trigger counterproductive financial planning (Shah, Mullainathan, & Shafir, 2012). Economic insecurity is also associated with increased risk of various illnesses, such as psychiatric disorders and heart diseases (Catalano, 1991). In contrast, economic security is a crucial component of psychological well-being (Maslow, 1943). In short, economic insecurity takes a toll on people’s behavioral and psychological well-being.
We propose that these cognitive and psychological consequences of economic insecurity extend to physical pain. Several studies have shown that psychological distress and physical pain share similar neural processes (Eisenberger & Lieberman, 2004; Price, 2000; Randles, Heine, & Santos, 2013). Similarly, acetaminophen has been shown to effectively reduce both physical and psychological distress (DeWall et al., 2010). This research is consistent with our hypothesis that people experience physical pain amidst economic insecurity.
Other findings also circumstantially support a causal relationship between economic insecurity and pain. For instance, a study conducted at a Toronto pain clinic found that more than 80% of its patients were unemployed (Mailis-Gagnon et al., 2007). Similarly, during the Russian pension crisis, retirees experiencing pension arrears were more likely than others to report chest pain (Jensen & Richter, 2004). These correlational observations provide suggestive but nonconclusive evidence that economic insecurity induces pain.
We propose that economic insecurity produces physical pain because it produces feelings of lack of control. Having a sense of control is a foundational human motivation (Kelley, 1971; Landau, Kay, & Whitson, 2015) and a key contributor to physical and mental well-being (Langer & Rodin, 1976). In contrast, lack of control activates the brain region (amygdala) underlying anxiety, fear, and stress (Whalen et al., 1998). Economic insecurity directly threatens people’s belief that they have the necessary resources to regain personal control (Landau et al., 2015). This reduced sense of personal control could, in turn, lead to physical and psychological pain (Wallerstein, 1992). In fact, physical pain has been associated with activation of dorsal anterior cingulate cortex, the brain region sensitive to uncertainty and expectation violation (Randles et al., 2013). These findings suggest that economic uncertainty may be linked to physical pain via feelings of a lack of control.
In this article, we report six studies that employed a multimethod approach to test the link between economic insecurity and pain. To test external validity with real-world consequences, we analyzed The Nielsen Company’s consumer-panel data on household purchases. To test internal validity and establish a causal link, we conducted experimental studies. For measuring pain, we utilized multiple well-validated medical pain inventories, as well as two different behavioral measures: individuals’ pain tolerance and households’ consumption of painkillers. Using both experimental-causal-chain and measurement-of-mediation approaches, we tested whether perceived lack of control mediates the causal link from economic insecurity to physical pain. Finally, we conducted meta-analyses on all of our studies of the effect of economic insecurity on pain to evaluate the magnitude of this impact.
Study 1: Household Unemployment and Consumption of Over-the-Counter Painkillers
Study 1 explored the link between economic insecurity and pain by examining whether households’ consumption of over-the-counter (OTC) painkillers is related to household residents’ employment status.
Method
Through a subscription service, we accessed Nielsen’s consumer-panel data set, which tracks household purchases. Our sample consisted of 33,720 geographically diverse and demographically balanced households distributed across the United States in 2008 (see Table S1 in the Supplemental Material available online for a list of the research variables, along with their means, standard deviations, and intercorrelations). Nielsen’s data have been shown to reliably measure consumers’ purchasing behavior (e.g., Einav, Leibtag, & Nevo, 2008).
Economic-insecurity measure
We operationalized economic insecurity as household residents’ employment status. Specifically, we created a measure of unemployment at the head-of-household level. The unemployment score ranged from 0 (both heads of the household were employed) to 2 (both were unemployed). Both heads were unemployed in 14% of the households in the sample, 34% of the households had one head employed, and 51% had both heads employed.
Consumption of OTC painkillers
We used the product category codes provided by Nielson to identify OTC painkillers (e.g., Tylenol, Ibuprofen, and Midol) and calculated the cumulative dollar amount that each household spent on these products. The average household in the sample spent $32.25 on OTC pain medicines in 2008. By comparison, the average household spent $45.97 on cold medicines.
Control variables
We included in our analyses 11 external factors that might have affected households’ consumption of OTC painkillers (e.g., consumption of cold and flu medicines in the same year, household size, and household income).
Results
Table 1 displays the results of four multiple-regression models. When we did not control for purchases of cold and flu medicines, we found a significant and positive relationship between unemployment level and painkiller consumption, b = 4.60, SE = 1.20, p < .001 (Model 2). This effect held after we controlled for purchases of cold and flu medicines, b = 7.80, SE = 3.78, p < .01 (Model 4). This latter result means, for example, that compared with households with at least one head employed, households with both heads unemployed spent 20% more on painkillers in 2008, t = 9.42, p < .001. In summary, Study 1 found that household unemployment level predicted consumption of OTC painkillers in a real-world context.
Results for the Multiple Regression Models Predicting Consumption of Over-the-Counter Painkillers in Study 1
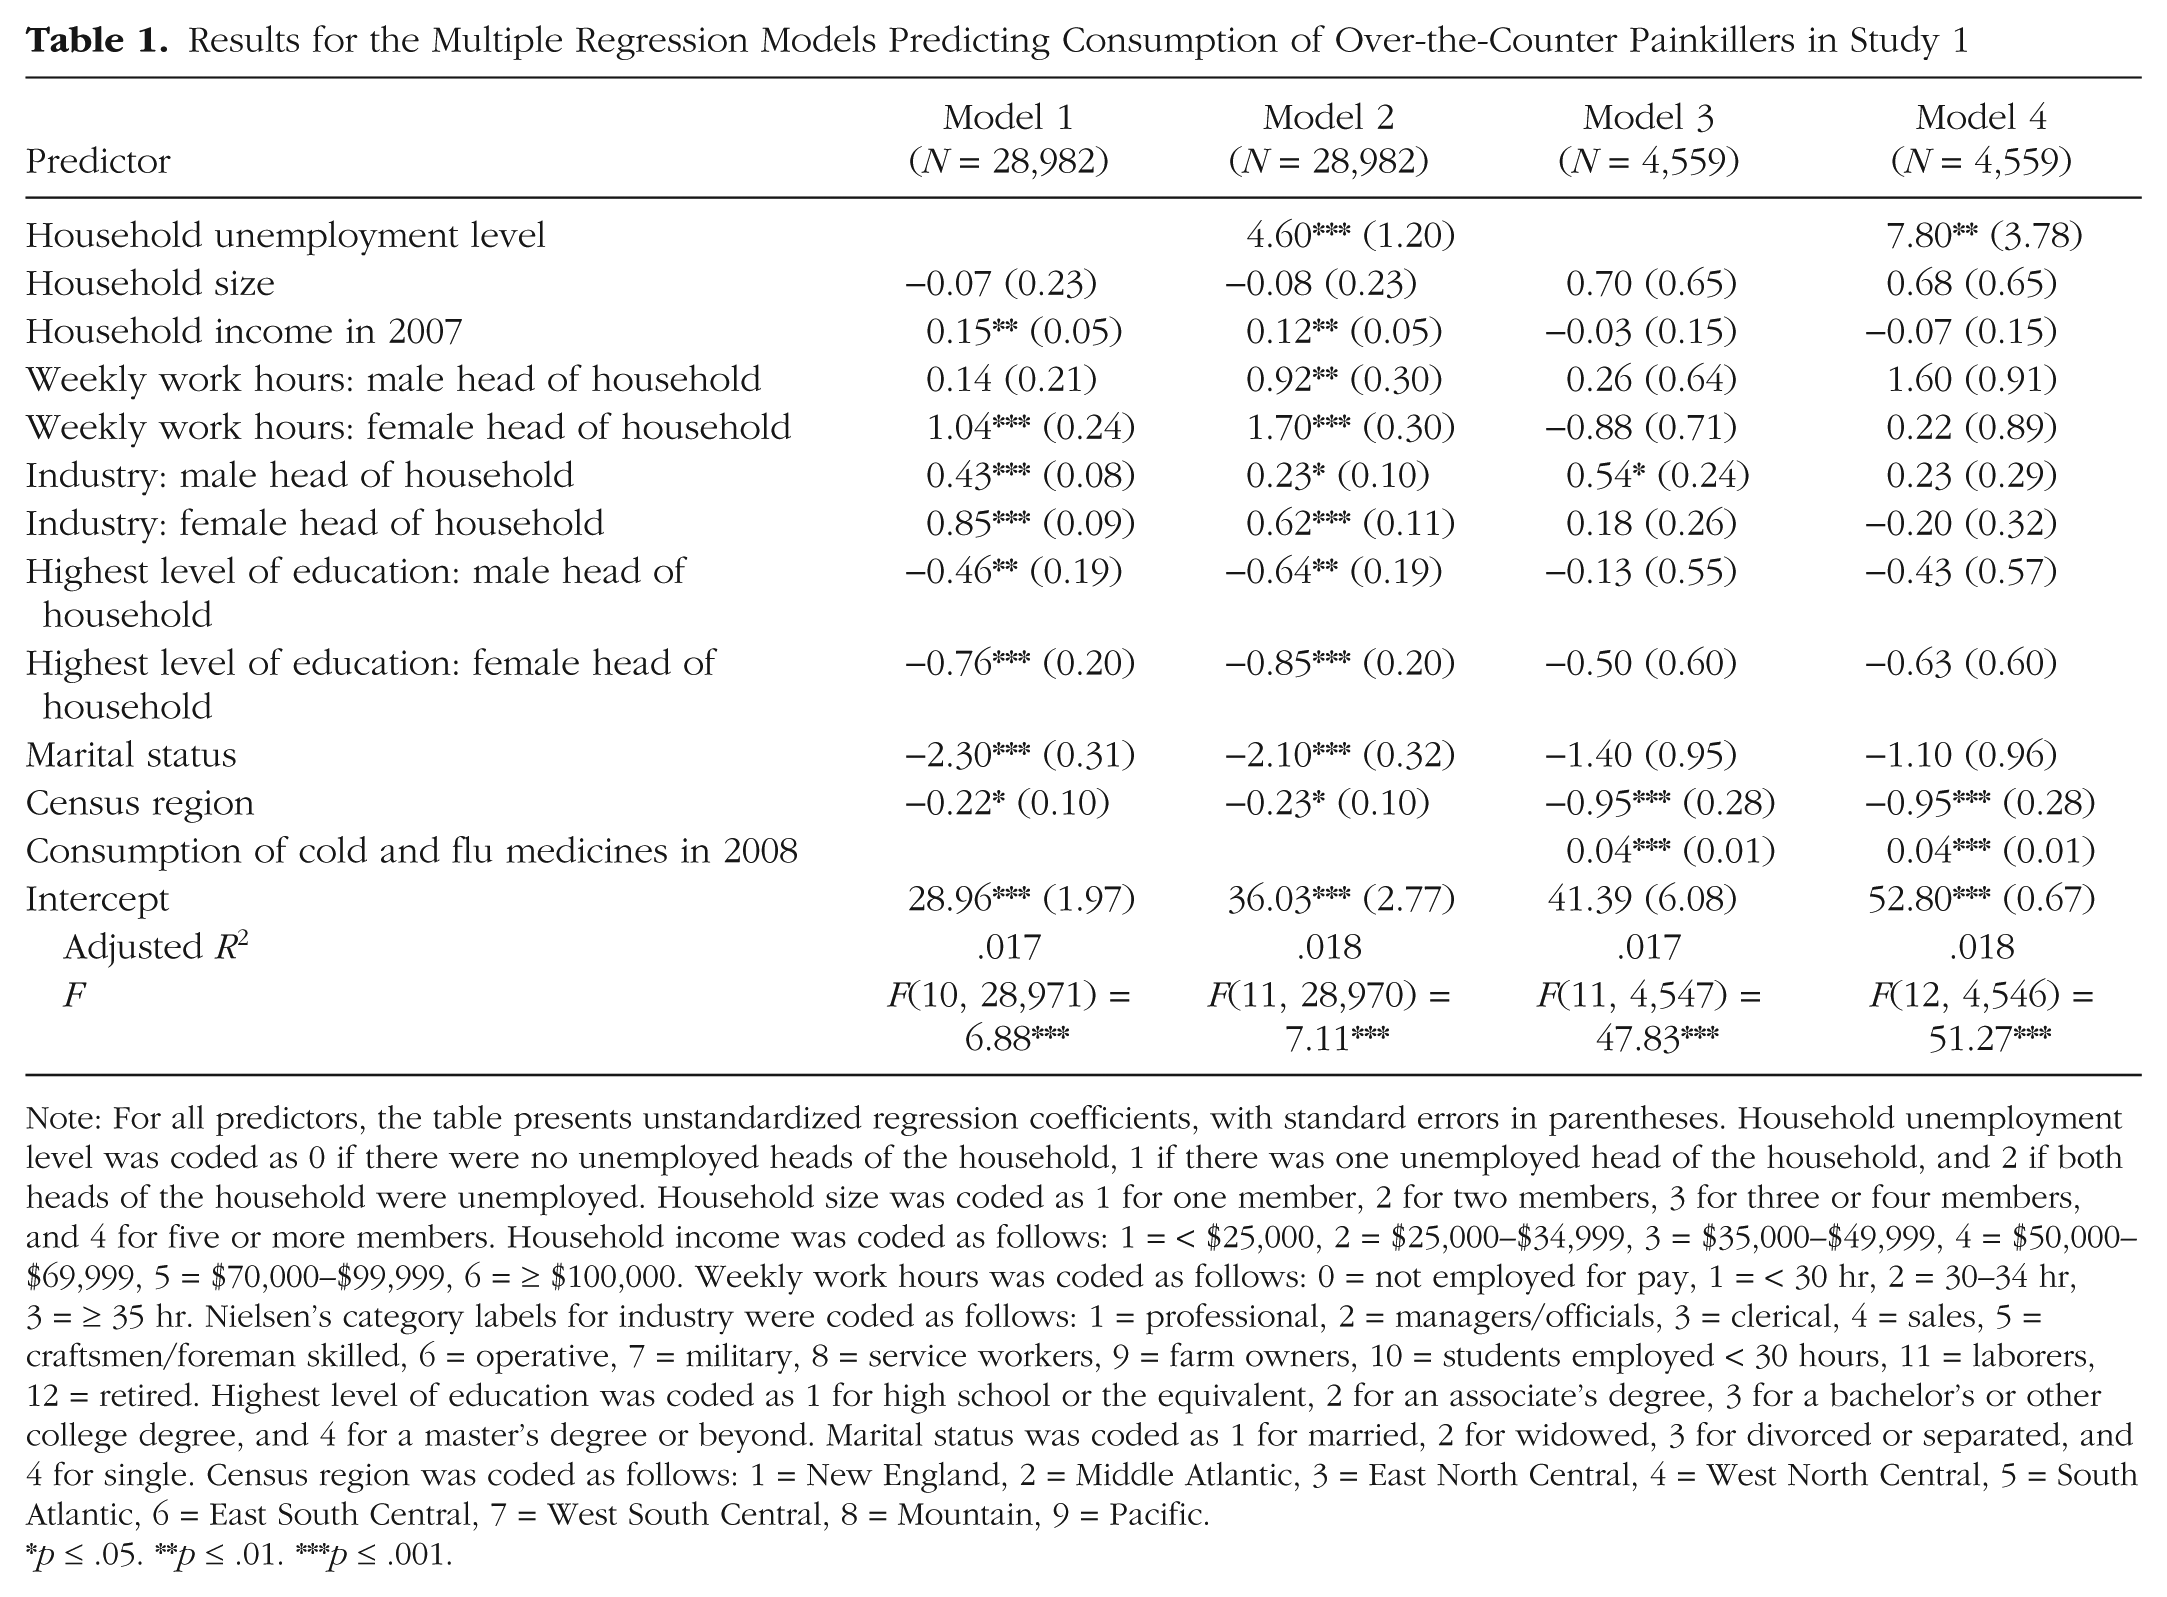
Note: For all predictors, the table presents unstandardized regression coefficients, with standard errors in parentheses. Household unemployment level was coded as 0 if there were no unemployed heads of the household, 1 if there was one unemployed head of the household, and 2 if both heads of the household were unemployed. Household size was coded as 1 for one member, 2 for two members, 3 for three or four members, and 4 for five or more members. Household income was coded as follows: 1 = < $25,000, 2 = $25,000–$34,999, 3 = $35,000–$49,999, 4 = $50,000–$69,999, 5 = $70,000–$99,999, 6 = ≥ $100,000. Weekly work hours was coded as follows: 0 = not employed for pay, 1 = < 30 hr, 2 = 30–34 hr, 3 = ≥ 35 hr. Nielsen’s category labels for industry were coded as follows: 1 = professional, 2 = managers/officials, 3 = clerical, 4 = sales, 5 = craftsmen/foreman skilled, 6 = operative, 7 = military, 8 = service workers, 9 = farm owners, 10 = students employed < 30 hours, 11 = laborers, 12 = retired. Highest level of education was coded as 1 for high school or the equivalent, 2 for an associate’s degree, 3 for a bachelor’s or other college degree, and 4 for a master’s degree or beyond. Marital status was coded as 1 for married, 2 for widowed, 3 for divorced or separated, and 4 for single. Census region was coded as follows: 1 = New England, 2 = Middle Atlantic, 3 = East North Central, 4 = West North Central, 5 = South Atlantic, 6 = East South Central, 7 = West South Central, 8 = Mountain, 9 = Pacific.
p ≤ .05. **p ≤ .01. ***p ≤ .001.
Study 2: State-Based Economics and Reports of Physical Pain
In Study 2, we investigated whether two different measures of economic insecurity—individuals’ employment status and the economic prospects of their state of residence—predicted their physical pain.
Method
Because one of our two main independent variables was the economic outlook for participants’ state of residence, we set out to recruit a representative sample of 300 participants via Amazon Mechanical Turk. We received valid survey responses from 293 participants (mean age = 34.42 years, SD = 11.46; 43.69% female). The day after they completed the survey, they received $1.00 for their time.
We obtained seasonally adjusted unemployment statistics at the state level from the Bureau of Labor Statistics in November 2014 (U.S. Department of Labor, Bureau of Labor Statistics, 2014). All data analyses were conducted after data collection had concluded.
Economic-insecurity conditions
Participants were first asked to indicate their current state of residence. Those who were living in 1 of the 19 states with the highest unemployment rates were redirected to the high-insecurity condition. Those who were living in 1 of the 19 states with the lowest unemployment rates were redirected to the low-insecurity condition. 1 We excluded states with moderate unemployment rates because (a) the state-by-state unemployment rankings within this group vary from month to month, whereas rankings at the two extremes are more stable across time, and (b) we wanted to focus on the two extremes to create cleaner predictors. Responders who were full-time students or retired, or who lived in states with moderate levels of unemployment, were excluded from further analysis. The final sample consisted of 187 participants (mean age = 34.12 years, SD = 10.44; 44.39% female; average years in the workforce = 13.50; see Table S2 in the Supplemental Material for means, standard deviations, and intercorrelations of the variables in this study).
In the high-insecurity condition, participants were presented with an alphabetized list of the states with the highest unemployment levels and were asked to indicate whether their current state of residence was one of those states. Because participants were directed to the list on the basis of their previous response, everyone indicated that their state was on the list. Participants were then asked to write a few sentences on how they felt about the economic prospects that residents in their state faced.
In the low-insecurity condition, participants were presented with an alphabetized list of the states with the lowest unemployment levels and were asked to indicate whether their current state of residence was one of those states. Because participants were directed to the list on the basis of their previous response, everyone indicated that their state was on the list. Participants were then asked to write a few sentences on how they felt about the economic prospects that residents in their state faced.
Individual-level economic insecurity
At the end of the study, participants indicated their employment status. Their response provided the measure of individual-level economic insecurity.
Measure of physical pain
We measured participants’ pain using four items, adapted from the first portion of the West Haven-Yale Multidimensional Pain Inventory (Kerns, Turk, & Rudy, 1985), that captured how much pain they were experiencing at that moment. First, they rated the current level of their physical pain (1 = no pain, 5 = very intense pain). Next, they responded to three questions: “How much, do you think, can the pain you feel RIGHT NOW change the amount of satisfaction you get from family-related activities?” (1 = not at all, 5 = extreme change), “How worried would your significant other be if s/he knows about the physical pain you are experiencing RIGHT NOW?” (1 = not at all, 5 = extremely worried), and “How much suffering do you experience because of your pain?” (1 = not at all, 5 = extreme suffering). We averaged their responses to form our pain index (α = .89).
Control variables
Participants responded to items assessing eight factors that might have affected their physical pain (e.g., age, whether they were currently on painkillers, and negative affect; affect was measured using the Positive and Negative Affect Schedule, or PANAS—Watson, Clark, & Tellegen, 1988).
Results
Table 2 presents the results of two multiple regression models. The results of Model 1 were consistent with our findings in Study 1: Participants’ own employment status had a significant effect on their physical pain, b = 0.06, SE = 0.02, p = .019. Model 2 included state-level economic-insecurity condition as a predictor, and, as expected, we found that state-level economic insecurity significantly predicted physical pain, b = 0.25, SE = 0.11, p = .026. Including this predictor also increased the overall proportion of variation explained and the goodness of fit, ΔF(1, 176) = 5.01, p = .026.
Results for the Multiple Regression Models Predicting Physical Pain in Study 2

Note: For all predictors, the table presents unstandardized regression coefficients, with standard errors in parentheses. Economic insecurity was coded as 0 for low and 1 for high. Employment status was coded as follows: 1 = employed full time, 2 = employed part time, 3 = self-employed, 4 = unemployed student, 5 = employed student, 6 = retired, 7 = unemployed, 8 = other. Participants who indicated that they were an unemployed student or retired were not included in subsequent analyses. Gender was coded as 0 for male and 1 for female. Economic and social political orientation were both self-reported using a 7-point scale, from 1, very conservative, to 7, very liberal. Highest level of education was coded as 1 for high school or the equivalent, 2 for an associate’s degree, 3 for a bachelor’s or other college degree, and 4 for a master’s degree or beyond. Use of painkillers was coded as 0 for “yes” and as 1 for “no.”
p ≤ .05. ***p ≤ .001.
In summary, Study 2 found that two different measures of economic insecurity were positively associated with increased reports of physical pain. First, replicating Study 1, Study 2 showed that participants’ employment status predicted the level of physical pain they experienced. Second, living in a state with high levels of unemployment also was associated with increased levels of physical pain.
Study 3: Causal Evidence
The first two studies found a positive relationship between economic insecurity and physical pain. In the next two studies, we tested for a causal connection between these two variables by manipulating economic insecurity and then measuring physical pain.
Method
We set out to recruit 250 Mechanical Turk participants and received responses from 231 (mean age = 33.60 years, SD = 11.32; 42.86% female). The day after completing the study, participants received $1.00 for their time. All data analyses were conducted after data collection had concluded.
Economic-insecurity manipulation
Participants were told that they would be engaging in several different surveys that were independent from one another. They first were asked to write about an autobiographical experience. Those who were randomly assigned to the high-insecurity condition were asked to recall a time (which could be the present) when they felt uncertain about their economic prospects, such as a time when they felt financially insecure, held an insecure and unstable job, or constantly had to worry about paying their bills. Participants in the low-insecurity condition wrote about a time when they felt certain about their economic prospects, such as a time when they felt financially secure, had a secure and stable job, or did not have to worry about their bills. Participants in both conditions were asked to describe how that time period made them feel.
Pain measure
Participants responded to an adapted version of the short-form McGill Pain Questionnaire (Melzack, 1987), indicating how much pain they were experiencing in their head, chest, and stomach (0 = no pain, 10 = worst pain ever experienced). Chronic illnesses affecting these three areas are prevalent in the unemployed population (Catalano, 1991). We aggregated participants’ responses to form our index of physical pain (α = .84).
Control variables
Participants responded to the PANAS. We focused on negative affect because of its potential link to physical pain (α = .94). Participants also provided their age, gender, and current employment status.
Results
Participants who recalled an economically insecure period of their life reported almost double the amount of physical pain (M = 0.86, SD = 1.54) compared with those who recalled an economically secure period (M = 0.44, SD = 1.08), t(229) = 2.38, p = .01, d = 0.31. This effect remained significant after we controlled for participants’ age, gender, current employment status, and negative affect, p = .03). 2 Thus, Study 3 established a direct causal relationship between economic insecurity and physical pain.
Study 4: Lack of Control as the Mediating Mechanism
Study 4 tested whether lack of control serves as a psychological mechanism that connects economic insecurity and physical pain. We reasoned that economic insecurity causes physical pain because it threatens people’s need for psychological control, which is a fundamental human need (White, 1959) and has been linked to factors that increase risk to physical health (Wallerstein, 1992).
Method
We used the response rate in Study 3 as a benchmark and aimed to recruit 200 Mechanical Turk participants (100 participants per condition). We received valid responses from 195 people (mean age = 33.33 years, SD = 9.43; 45.13% female; average years in the workforce = 12.69). Participants in this online study received $1.00 for their time, the day after they completed the study. All data analyses were conducted after data collection had concluded.
Economic-insecurity manipulation
Participants were first asked to indicate their current state of residence. Half of the participants were randomly assigned to learn that they resided in a state with one of the highest unemployment rates (high-insecurity condition). The other half did not receive any information about their state’s unemployment rate (baseline condition). Participants were then asked to write a few sentences reflecting how they felt about the economic outlook for residents in their state.
Pain measure
Participants indicated their current level of physical pain using the well-validated Wong-Baker Faces scale (1 = no hurt, 5 = hurt worst; Wong & Baker, 1988).
Lack-of-control measure
Participants responded to a five-item scale that captures respondents’ psychological sense of lacking control (Lachman & Weaver, 1998; α = .91). Table 3 presents the means, standard deviations, and intercorrelations of these items.
Descriptive Statistics and Correlations for the Lack-of-Control Scale in Study 4
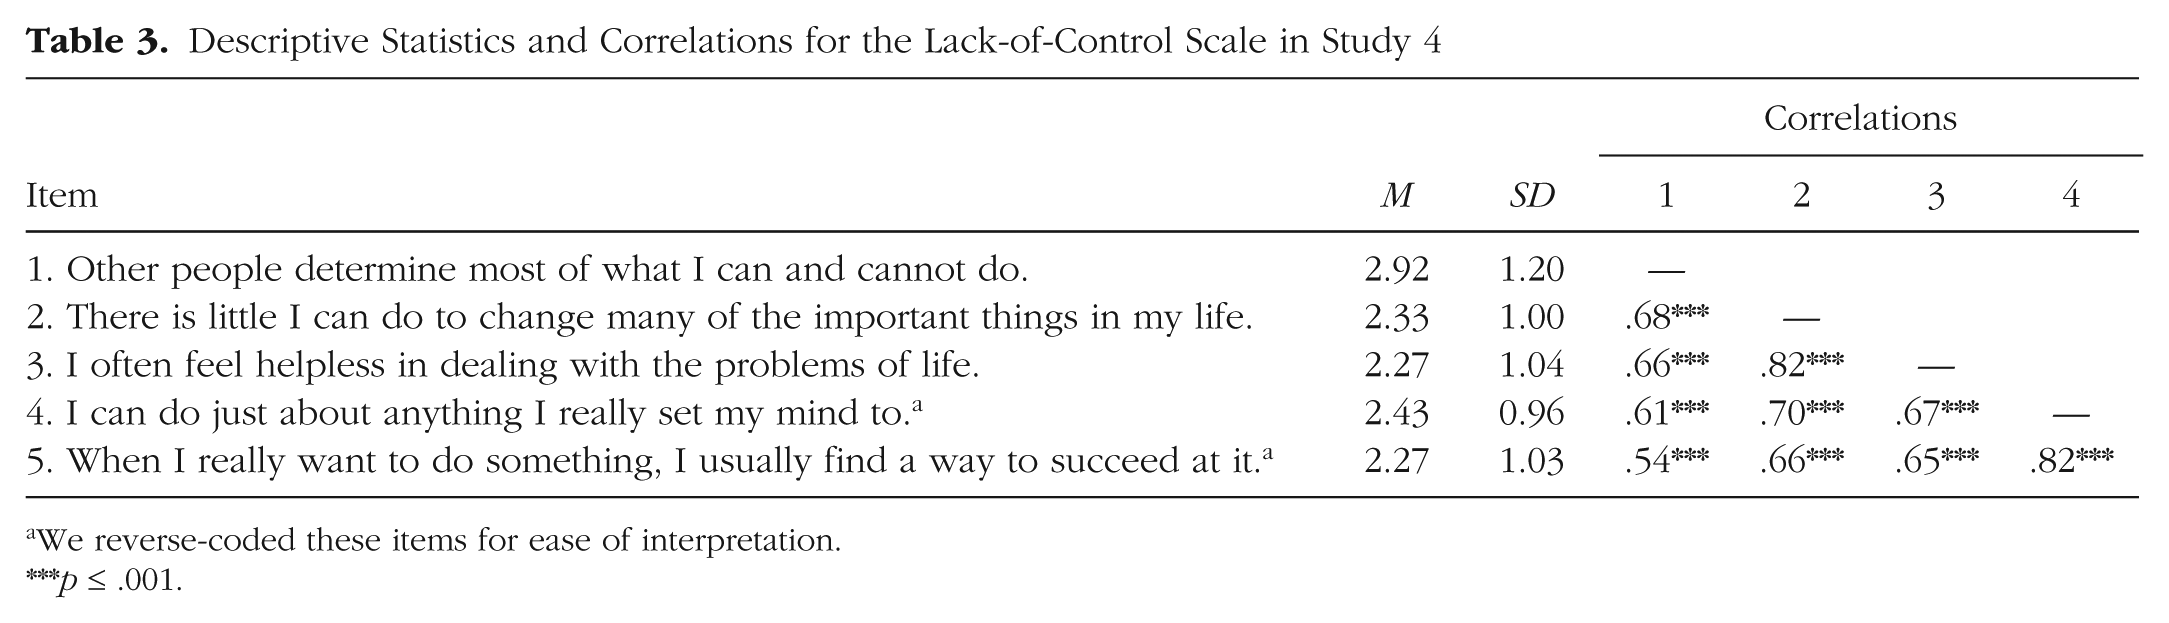
We reverse-coded these items for ease of interpretation.
p ≤ .001.
Control variables
Participants also reported their age and gender.
Results
As in the prior studies, economic insecurity was positively associated with physical pain: Participants in the high-insecurity condition reported more physical pain (M = 1.81, SD = 1.07) than those in the baseline condition (M = 1.45, SD = 0.75), t(193) = 2.64, p = .009, d = 0.43. They also reported experiencing greater lack of control (M = 2.57, SD = 0.97) than participants in the baseline condition (M = 2.31, SD = 0.81), t(193) = 1.99, p = .04, Cohen’s d = 0.29. Supporting our prediction, bootstrap analyses revealed that lack of control mediated the causal effect of economic insecurity on physical pain, bootstrapped 95% confidence interval (CI) = [0.01, 0.17] (Fig. 1).

Results of the mediation analysis in Study 4. The high-insecurity condition was coded as 1, and the baseline condition was coded as 0. The statistics below the dashed arrow indicate the direct effect of insecurity on physical pain, not accounting for lack of control as the mediator. The statistics above the dashed arrow indicate the indirect effect of insecurity on physical pain, with lack of control included as the mediator. Asterisks indicate significant coefficients (*p ≤ .05, **p ≤ .01, ***p ≤ .001).
Study 5: Lack of Control Produces Physical Pain
In Study 4, we used the measurement-of-mediation approach to identify lack of control as a mechanism linking economic insecurity to physical pain. In Study 5, we employed the experimental-causal-chain approach, testing for a causal link from lack of control to physical pain.
Method
Participants (N = 100; mean age = 31.05 years, SD = 9.80; 48.52% female) participated in this Mechanical Turk study in exchange for $0.41, which they received the day after they completed the study. All data analyses were conducted after data collection had concluded.
Manipulation of lack of control
Participants were asked to write about an autobiographical experience (Whitson & Galinsky, 2008). Half recalled a time when they lacked control: Please recall a particular incident in which something happened and you did not have any control over the situation. Please describe the situation in which you felt a complete lack of control—what happened, how you felt, etc. You must spend 1.5 minutes on this recall task. The page will auto-advance once the time is up.
The other half recalled a time when they had complete control: Please recall a particular incident in which something happened and you were in complete control of the situation. Please describe the situation in which you felt in complete control—what happened, how you felt, etc. You can control how long you want to spend on this recall task.
Pain measure
After the recall task, participants were asked to “choose the overall pain level that best describes how much physical pain you are experiencing RIGHT NOW.” They responded using a visual slider scale (Portenoy & Kanner, 1996), on which 0 indicated no pain and 100 indicated the worst pain ever experienced.
Control variables
Participants also reported their age, gender, and current employment status, and whether they were using painkillers.
Results
Participants in the lack-of-control condition reported more than double the physical pain (M = 13.75, SD = 21.49) reported by participants in the complete-control condition (M = 6.57, SD = 11.62), t(98) = 2.04, p = .04, d = 0.41. This effect remained significant after we controlled for participants’ age, gender, and current employment status, and whether they were taking painkillers, p = .05. In summary, Studies 4 and 5 both demonstrate that lack of control is a proximal mechanism that produces physical pain.
Study 6: Behavioral Measure of Pain Tolerance
Study 6 used a behavioral measure as the dependent variable: pain tolerance, which we measured with the cold pressor test (Wolf & Hardy, 1941). We predicted that economic insecurity would decrease pain tolerance.
Method
Undergraduate students (N = 114; mean age = 20.18 years, SD = 1.62; 66.67% female) from the University of Virginia (UVA) participated in this study in exchange for $5. Six participants (3 in each condition—see the Economic-Insecurity Manipulation section) had a change in pain tolerance exceeding 3 standard deviations of the mean change (i.e., values below −350.84 s or above 605.03 s); we excluded them from analyses. In addition, 13 participants did not complete the task manipulating economic insecurity. We excluded those participants to preserve the consistency of our manipulation. All data analyses were conducted after data collection had concluded.
Baseline pain tolerance
Participants were told that they would be participating in multiple studies during the session. First, they were asked to go to a separate area and put their nondominant hand in a bucket of ice water for as long as it felt comfortable. Following past studies, we kept the water temperature at approximately 34 °F (Wolf & Hardy, 1941). To control for potential experimenter effects, we instructed all experimenters to stand behind the participants while keeping time. The time that participants kept their hand in the ice water served as our baseline measure of their pain tolerance.
Economic-insecurity manipulation
Participants then were asked to sit at an isolated computer terminal to complete a second study. In reality, this “study” contained our economic-insecurity manipulation.
Participants in the high-insecurity condition read: Today’s economy landscape greatly diverges from a decade ago, for the worse. According to a recent poll, more than 3.5 million Americans work at or below the minimum wage. Moreover, latest research conducted by Bureau of Labor Statistics reveals that more than 300,000 recent college grads are working minimum wage jobs, a figure that is twice as high as it was merely 10 years ago. Certain college grads bear more of the burden than others. In particular, students who do not graduate from top 10 national universities (e.g., Princeton and Harvard) fare significantly worse than those who do. Those college grads have a much more difficult time finding jobs. Some statistics suggest that it could be almost twice as difficult. And when they do find jobs, they are underemployed.
Participants in the low-insecurity condition read: Today’s economy landscape greatly diverges from a decade ago. According to a recent poll, more than 3.5 million Americans work at or below the minimum wage. Moreover, latest research conducted by Bureau of Labor Statistics reveals that more than 300,000 recent college grads are working minimum wage jobs, a figure that is twice as high as it was merely 10 years ago. Certain college grads are shield [sic] from the economic turmoil more than others. In particular, students who graduate from top 10 public universities (e.g., UC Berkeley and UVA) fare significantly better on the job market than those who do not. These college grads have a much easier time finding jobs. Some statistics suggest that it could be almost twice as easy. And when they do find jobs, they are well-compensated.
Participants were then directed to the U.S. News & World Report college-ranking Web site to look up UVA’s rank. Those in the high-insecurity condition were redirected to the page for national rankings, which places UVA at number 23. Those in the low-insecurity condition were redirected to the page for public universities’ rankings, which places UVA at number 2. Participants then wrote about how an average UVA student would feel as he or she prepares to enter the job market. We requested a third-person narrative to control for hubris effects.
To further accentuate the manipulation, we asked participants to write UVA’s ranking on a name badge and put it on.
Postmanipulation pain tolerance
While wearing the name badge, participants were escorted one by one back to the ice-bucket station. They were asked to put their nondominant hand in the ice water again for as long as it felt comfortable. The time that they kept their hand in the water was our behavioral measure of postmanipulation pain tolerance.
Demographic variables
Participants then returned to the computer terminal to provide demographic information, before being debriefed and excused.
Results
We conducted a regression analysis that predicted postmanipulation pain tolerance from experimental condition (high vs. low economic insecurity), controlling for baseline pain tolerance (Table 4). Consistent with our previous results, this analysis revealed a negative association between economic insecurity and postmanipulation pain tolerance, b = −16.06, SE = 6.97, t = −2.30, p = .02; not surprisingly, baseline pain tolerance also significantly predicted postmanipulation pain tolerance, b = 0.55, SE = 0.05, t = 10.18, p < .001. In addition, when participants contemplated the prospect of economic insecurity, their pain tolerance decreased, but pain tolerance did not change when participants contemplated the prospect of economic security (Fig. 2).
Results for the Regression Model Predicting Pain Tolerance in Study 6

Note: For all predictors, the table presents unstandardized regression coefficients, with standard errors in parentheses. Economic insecurity was coded as 0 for low and as 1 for high.
p ≤ .05. ***p ≤ .001.

Results from Study 6: change in pain tolerance (postmanipulation – threshold) in the low- and high-insecurity conditions. Error bars represent ±1 SE.
Meta-analyses
We performed meta-analyses on Studies 1, 2, 3, 4, and 6, as well as three additional studies not reported here (for details, see the Supplemental Material), to estimate the overall size of the effect of economic insecurity on physical pain. Because the study designs and participant populations varied, we performed random-effects meta-analyses to account for the study-level variance. For these analyses, we entered the unstandardized regression coefficients and corresponding standard errors from the regression analyses for these studies into the Comprehensive Meta-Analysis software (Borenstein, Hedges, Higgins, & Rothstein, 2009; Rosenthal, 1991). We performed two separate analyses to account for the difference in observations when we included purchases of cold medicines as a control in Study 1.
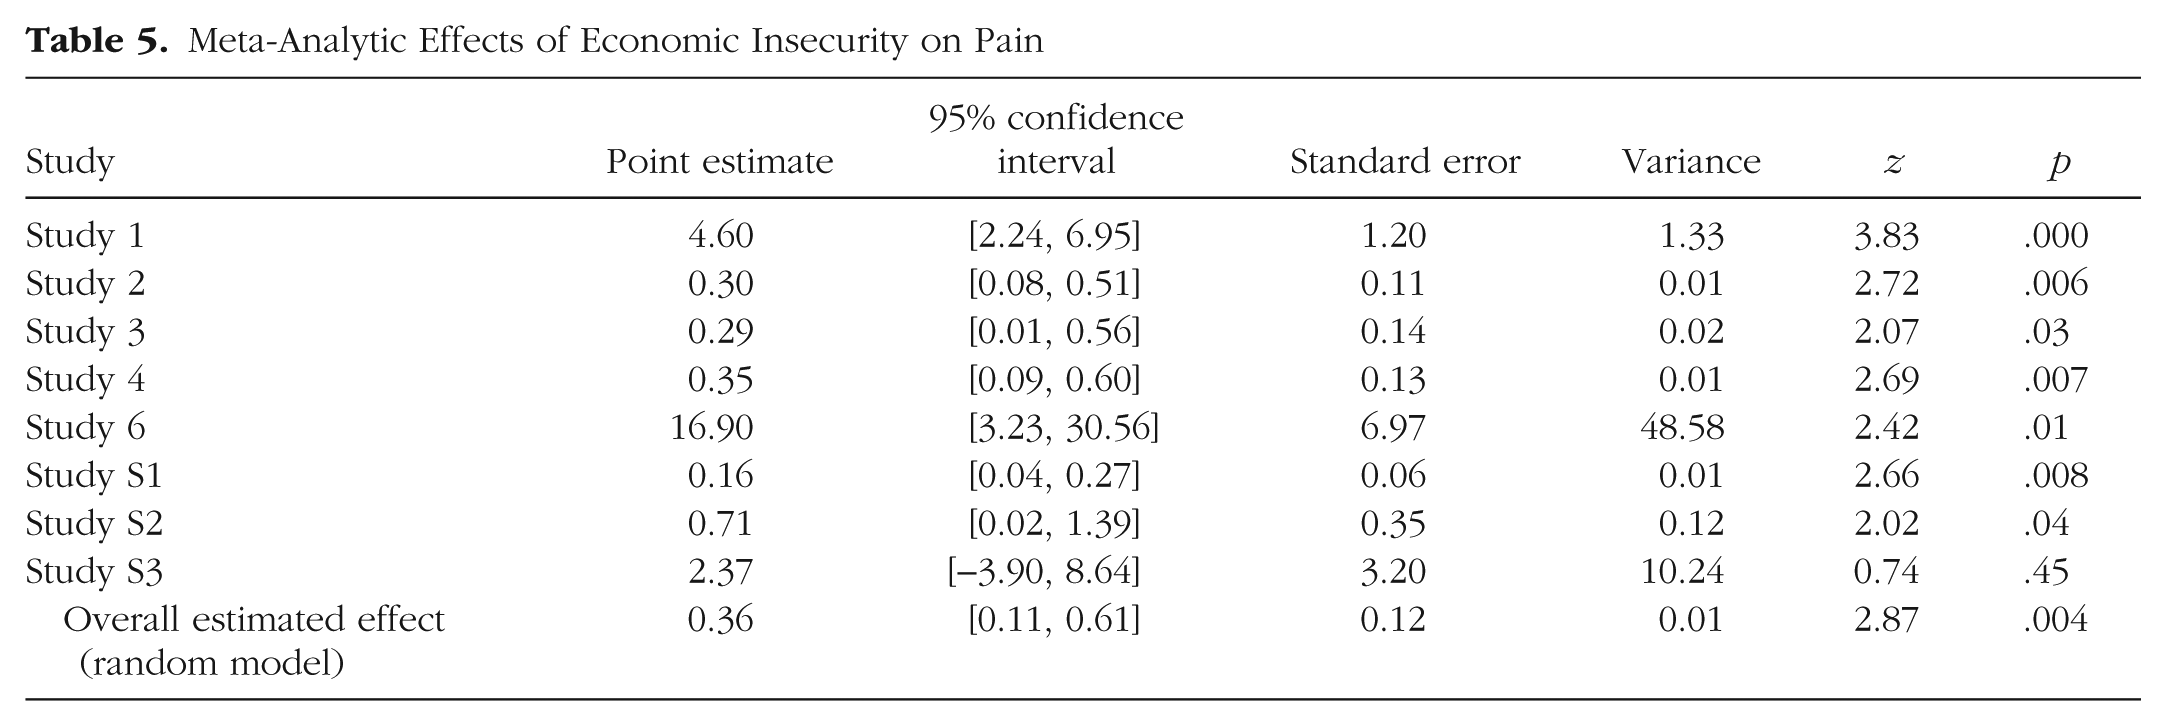
Results of the first analysis revealed a highly reliable effect, supporting our hypothesis that economic insecurity induces physical pain, b = 0.36, SE = 0.12, 95% CI = [0.11, 0.61], Z(8) = 2.87, p = .004 (Table 5, Fig. 3). The effect remained significant even after we controlled for purchases of cold medicines in Study 1, b = 0.30, SE = 0.09, 95% CI = [0.11, 0.48], Z(8) = 3.15, p = .002. The Supplemental Material presents the results of additional meta-analytical models conducted separately for different operationalizations of pain.
Meta-Analytic Effects of Economic Insecurity on Pain
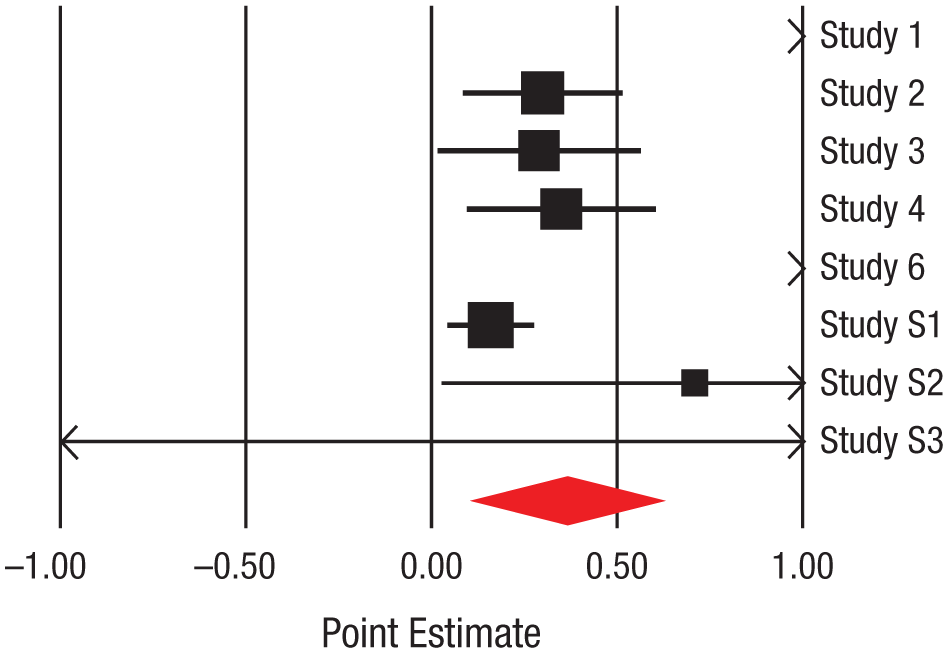
Forest plot for the main meta-analysis (i.e., not including purchases of cold medicines as a control in Study 1). The horizontal black lines and boxes indicate effect sizes and 95% confidence intervals (CIs), respectively, for the individual studies; the red diamond represents the overall estimate of the effect size. The mass of the effect-size boxes reflects the relative weights of the studies in the meta-analysis (study weight was determined by the standard error of the observed mean difference). Positive effect sizes reflect an increase in pain as a consequence of economic insecurity; negative effect sizes reflect a decrease in pain. Effect sizes for Study 1 and Study 6 (represented by arrowheads) are off the scale (both were positive). The double-headed arrow for Study S3 represents the non-statistically significant result we found in that study. (See the Supplemental Material for analyses that controlled for purchases of cold medicines.)
General Discussion
The current research found that experiencing economic insecurity directly increased physical pain. The influence of economic insecurity on pain emerged regardless of how insecurity was operationalized (employment status, economic prospects at the individual or state level, recalling or anticipating insecurity), and when pain was assessed using four different medical pain inventories and two behavioral measures (pain tolerance and consumption of painkillers). 3 We established that the psychological experience of lacking control mediated the causal link from economic insecurity to physical pain using both measurement-of-mediation and experimental-causal-chain approaches. These findings illuminate an unanticipated, yet critical, consequence (pain) of a phenomenon that is prevalent worldwide (economic insecurity).
Implications and future directions
Our findings highlight the importance of the distinction between subjective and objective economic insecurity. Much research attention has been directed to comparing the haves and have-nots (Shah et al., 2012). Although objective measures of wealth are important, our study shows that individuals’ subjective interpretation of their own economic security has crucial consequences above and beyond those of objective economic status.
We recognize that the link from economic insecurity to pain is likely generated through multiple mediators. Indeed, studies have linked depression and anxiety (two variables that themselves are intercorrelated) with physical pain (e.g., MacDonald & Leary, 2005), and research shows that that the mediator we have examined here—feelings of lack of control—is an input into both anxiety and depression (Seligman, 1975). Reciprocally, feelings of anxiety and depression can create attributional logics and cognitive orientations that lead people to feel more uncertain and have lower self-esteem (Taylor & Brown, 1988).
Certain psychological and physiological characteristics may also magnify the effects of economic insecurity. For instance, individuals who are relatively deprived may psychologically appraise economic insecurity as a threat rather than a challenge (Tomaka, Blascovich, Kelsey, & Leitten, 1993), which in turn could exacerbate the pain they experience. Likewise, trait anxiety and existing health conditions may also exacerbate the effect of economic insecurity.
Although the current research has established that economic insecurity is causally related to physical pain, it offers only a first step toward a comprehensive model that explains this relationship. For instance, we measured participants’ negative affect (Studies 2 and 3) to control for the impact of state and trait anxiety (Watson et al., 1988), their education level (Studies 1 and 2) to control for their approximate socioeconomic status (Winkleby, Jatulis, Frank, & Fortmann, 1992), and their painkiller usage (Studies 2 and 5) to control for preexisting health conditions. A more comprehensive examination of the interplay among these various forces would be a fruitful avenue for future research.
Our findings also point to broader consequences for social cognition and decision making. Past research has documented that repeated experience of lacking control over aversive events can eventually chip away people’s willingness to improve their status quo (Hiroto & Seligman, 1975). This learned helplessness may further accentuate the physical pain that they experience. In addition, people who experience pain have physical and psychological impairments in decision making (Apkarian et al., 2004), which can further perpetuate their economic problems. Exploring this potential malicious cycle should be a fruitful direction for future research.
Finally, our findings have profound practical implications. A better understanding of the relationship between economic insecurity and pain is important to researchers and policymakers alike. People in pain not only consume medical resources, but also have limited capacity for work. And limited working capacity exacerbates economic insecurity, entrapping individuals in a downward, self-reinforcing spiral. By demonstrating a causal relationship between economic insecurity and physical pain, this research may also address pressing financial and economic issues.
Conclusion
The present research bridges two major social problems that have increasingly consumed policymakers’ attention yet have mostly been addressed independently. Initiatives such as the Stimulus Act of 2009 and the Trouble Assist Relief Program were aimed at restoring economic security. Similar efforts have been aimed at understanding the rising pain epidemic and reducing painkiller abuse (Gaskin & Richard, 2012; National Survey on Drug Use and Health, 2013). Our results suggest that policymakers should recognize that there may be a link between these two issues: Economic insecurity can drive a downward spiral, both individually and collectively, in which physical pain both arises from and perpetuates weak economic circumstances. By showing that physical pain has roots in economic insecurity and feelings of lack of control, the current findings offer hope for short-circuiting the downward spiral initiated by economic insecurity and producing a new, positive cycle of well-being and pain-free experience.
Footnotes
Declaration of Conflicting Interests
The authors declared that they had no conflicts of interest with respect to their authorship or the publication of this article.
Open Practices
Study 1 used proprietary data, which could not be posted on a public, open-access repository. All other data and materials are available from the authors upon request.
Notes
References
Supplementary Material
Please find the following supplemental material available below.
For Open Access articles published under a Creative Commons License, all supplemental material carries the same license as the article it is associated with.
For non-Open Access articles published, all supplemental material carries a non-exclusive license, and permission requests for re-use of supplemental material or any part of supplemental material shall be sent directly to the copyright owner as specified in the copyright notice associated with the article.