
Abstract
How does one know where to look for objects in scenes? Objects are seen in context daily, but also used for specific purposes. Here, we examined whether an object’s function can guide attention during visual search in scenes. In Experiment 1, participants studied either the function (function group) or features (feature group) of a set of invented objects. In a subsequent search, the function group located studied objects faster than novel (unstudied) objects, whereas the feature group did not. In Experiment 2, invented objects were positioned in locations that were either congruent or incongruent with the objects’ functions. Search for studied objects was faster for function-congruent locations and hampered for function-incongruent locations, relative to search for novel objects. These findings demonstrate that knowledge of object function can guide attention in scenes, and they have important implications for theories of visual cognition, cognitive neuroscience, and developmental and ecological psychology.
“A place for everything, and everything in its place.” This old adage not only provides a prescription for keeping everything tidy, but also summarizes a basic fact about real-world scenes. Objects tend to appear in certain locations within scenes; this orderly structure of scenes is referred to as scene context. One can take advantage of these regularities when processing scenes. For instance, scene context aids visual search (e.g., Neider & Zelinsky, 2006) because of observers’ expectations about object placement. Disrupting these expectations impairs performance such that it takes longer to find and recognize a target (Castelhano & Heaven, 2011; Malcolm & Henderson, 2010; Neider & Zelinsky, 2006). What is not clear, however, is how objects are associated with particular locations in the scene.
Most researchers posit that knowledge of scene context arises from extensive experience with scenes and objects (see Henderson, 2003, for a review). In fact, many studies and computational models have shown that when a scene is viewed multiple times, one begins to learn object placement. For example, Brockmole and Henderson (2006a, 2006b) showed that arbitrary targets were associated with specific scene locations over multiple scene exposures. Additionally, Bayesian computational models (Eckstein, Drescher, & Shimozaki, 2006; Ehinger, Hidalgo-Sotelo, Torralba, & Oliva, 2009; Najemnik & Geisler, 2005; Torralba, Oliva, Castelhano, & Henderson, 2006) have demonstrated through machine learning that associations between scene context and target placement can accurately predict human eye movements. However, objects are acted on, not just viewed within contexts. In the present study, we investigated whether an object’s function is related to its placement in a scene and whether knowledge of the object’s function can guide search.
Gibson’s (1979) seminal work demonstrated that perception is not an end in itself, but rather occurs in the service of a larger task goal, usually in the performance of an action. Many studies have demonstrated an intimate link between actions and perception. Recent studies have shown that actions are directly tied to object representations, even when unrelated to the task at hand (Beilock & Holt, 2007; Grezes, Tucker, Armony, Ellis, & Passingham, 2003; Helbig, Steinwender, Graf, & Kiefer, 2010). Additionally, studies have shown that actions performed with objects have certain spatial associations (Downing-Doucet & Guérard, 2014; Tucker & Ellis, 2004). These results suggest that actions performed with objects not only may have an effect on object recognition and memory, but also may influence how they fit within a larger context. For instance, actions are associated with specific spatial constraints (e.g., reaching up, pressing a button), which could impose limitations on where objects are placed within a scene. Here, we investigated the connection between object function and scene context and its impact on subsequent behavior.
We investigated the connection between object function and scene context in multiple ways. First, we conducted a pilot study to directly test whether an object’s placement and its function were related. This was done for invented objects that were nonexistent but plausible. We found that knowledge of an object’s function did affect its placement in a scene. Second, we examined whether knowledge of object function and scene context can guide search in scenes.
Guidance in scenes has been shown to arise from a number of factors, including scene gist, spatial layout, and target features (Becker & Rasmussen, 2008; Castelhano & Heaven, 2010, 2011; Castelhano & Henderson, 2007; Eckstein et al., 2006; Ehinger et al., 2009; Hillstrom, Scholey, Liversedge, & Benson, 2012; Hollingworth, 2009; Hwang, Wang, & Pomplun, 2011; Neider & Zelinsky, 2006; Torralba et al., 2006; Zelinsky, 2008). To examine the effect of the combined knowledge of object function and scene context, we used the flash-preview moving-window paradigm. In this paradigm, participants are shown a brief preview of the entire search scene, after which they search through a gaze-contingent moving window that occludes visual information in all but the small area of the window itself. The paradigm forces participants to rely on the scene representation acquired during the initial preview, in addition to knowledge about the target and the visual features within the window. Within these limitations, this paradigm allowed us to examine whether an object’s function in combination with knowledge of scene context could benefit search above and beyond the benefits provided by peripheral visual features.
In each of two experiments, there were two phases: a study phase and a search phase. During the study phase, participants studied 18 of a larger set of invented objects for a memory test. Participants then searched for those objects and an additional 18 novel objects in a scene while their eye movements were tracked, according to the flash-preview moving-window paradigm. Without providing participants with firsthand experience viewing these invented objects within a scene context, we were able to test whether the knowledge of object function influenced attentional guidance.
Pilot Study
To establish whether there was a connection between an object’s function and its placement within a scene, we conducted a pilot study to measure the amount of agreement among participants who saw only the description of the invented object and those who saw only a picture of the invented object.
Method
Participants
Twenty Queen’s University undergraduate students received either $10 per hour or course credit for their participation.
Stimuli and apparatus
The stimuli were 36 invented objects created in HomeDesign 5.0 (DataBecker, Düsseldorf, Germany). Each object description included its intended function and the action required to use it, but excluded information about its placement in a scene. Objects were designed to minimize participants’ ability to guess their function from their appearance. We conducted two norming studies to measure participant’s ability to guess each object’s function.
In Norming Study 1, a separate group of participants (N = 12) matched each functional description to an object picture. Participants were presented with a matrix of all 36 object images, while a description of one of the objects’ functions appeared on the left side of the screen. For each description, participants indicated with a mouse click which object picture matched. The matrix was the same across the study for each participant but was randomly determined across participants. Participants chose one object image per description and were not prevented from choosing the same object twice across descriptions.
Average accuracy in Norming Study 1 was 21% (SD = 0.2%) and was significantly above chance (1/36 or .0278) in both a subject analysis, t(11) = 6.76, p < .001, d = 4.07, and an item analysis, t(35) = 5.41, p < .001, d = 1.83. This means that, on average, participants matched the function to the correct object image for approximately 8 of the 36 objects. This effect was largely driven by 4 objects that were correctly selected more than 50% of the time. 1 Although some objects were readily matched when both the description and the image were available, we ran a second test that more closely reflected the experience of the participants in each of the main experiments.
In Norming Study 2, participants (N = 10) were shown a picture of each object separately and were asked to type out a description in a text box beside it; this provided a stringent test of the ability to guess function on the basis of appearance. Two independent raters judged the response accuracy and were told to be as liberal in their scoring as possible. We found a high interrater reliability (98% agreement; Cohen’s κ = .73, p < .001). Average accuracy in Norming Study 2 was 0.0263% correct (SD = 0.022%). It is difficult to assess chance guessing with such a test, but if a similar chance level as for Norming Study 1 is considered as the best-case scenario, this performance can be directly compared with the matching task. Analyses showed that participants were not able to correctly guess the function above this chance level (.0278) in both a subject analysis, t(9) = −.193, p > .1, d = −0.13, and an item analysis, t(35) = 0.41, p > .1, d = 0.14. On the basis of these results, we do not believe that object functions were readily attainable from their appearance.
Procedure
For the pilot study itself, participants were split into two groups. One group was shown a picture of an object, and the other was shown a description of the object’s function (see Fig. 1). In both groups, this object information was presented on the left-hand side of the screen, and a corresponding scene image was presented on the right-hand side. Participants were asked to select the region or regions in the scene in which the object would most likely be found. They drew polygons with the mouse on the scene image and were not limited in the number, size, or shape of these polygons. When they were ready to move on to the next scene, they pressed a “Next” button on the lower left-hand side of the screen. The study took approximately 20 min to complete.
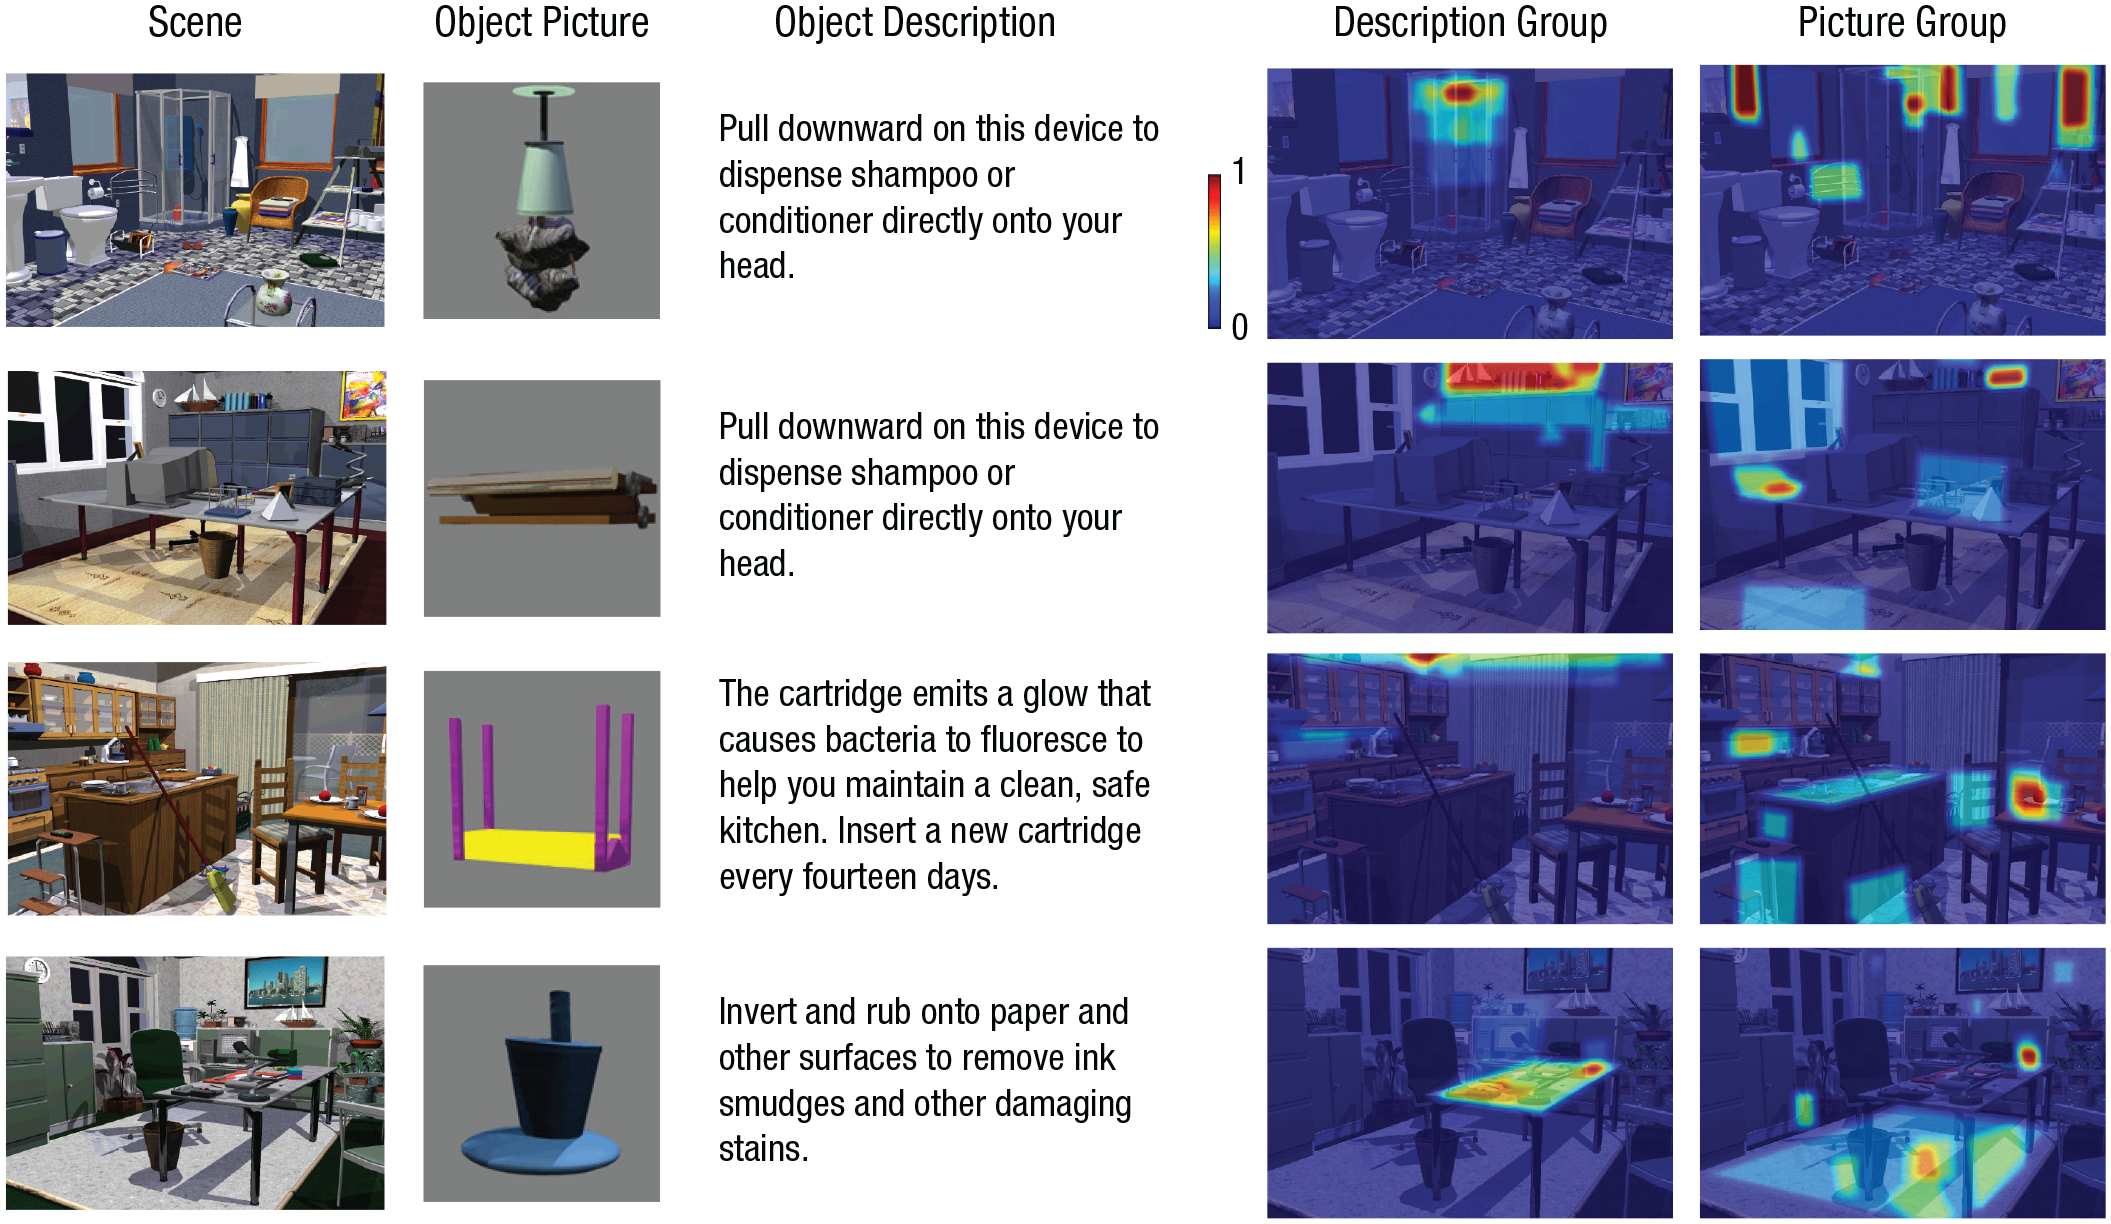
Stimuli and results for example scenes used in the pilot study. For each scene, participants were shown either a picture of an invented object or a description of that object. Participants’ task was to indicate the region or regions within the scene in which the object would most likely be found. The heat maps depict the frequency with which regions were selected for each scene, separately across all participants in the description group and all participants in the picture group; colors with values closer to 1 indicate regions that were selected more often.
Results and discussion
We calculated three measures to capture the spread and overlap of regions selected for each scene. Table 1 shows means for these three measures, and Figure 1 presents heat maps of the regions selected by each group for example objects. We determined the agreement among participants by calculating the percentage of participants who contributed to the highest peak (i.e., the most-selected region). We found that the percentage for the description group (collapsed across participants for each scene) was higher than for the picture group, t(70) = 4.12, p < .001, d = 0.98. The overall average area of the scene selected was also higher for the description group than for the picture group, t(70) = 2.51, p < .05, d = 0.60. However, the description group selected fewer unique regions than the picture group, t(70) = −2.691, p < .01, d = 0.64. Taken together, these results show that compared with the picture group, the description group selected bigger but fewer regions overall, and there was greater overlap between participants’ selections within the description group.
Means for the Three Measures Assessed in the Pilot Study
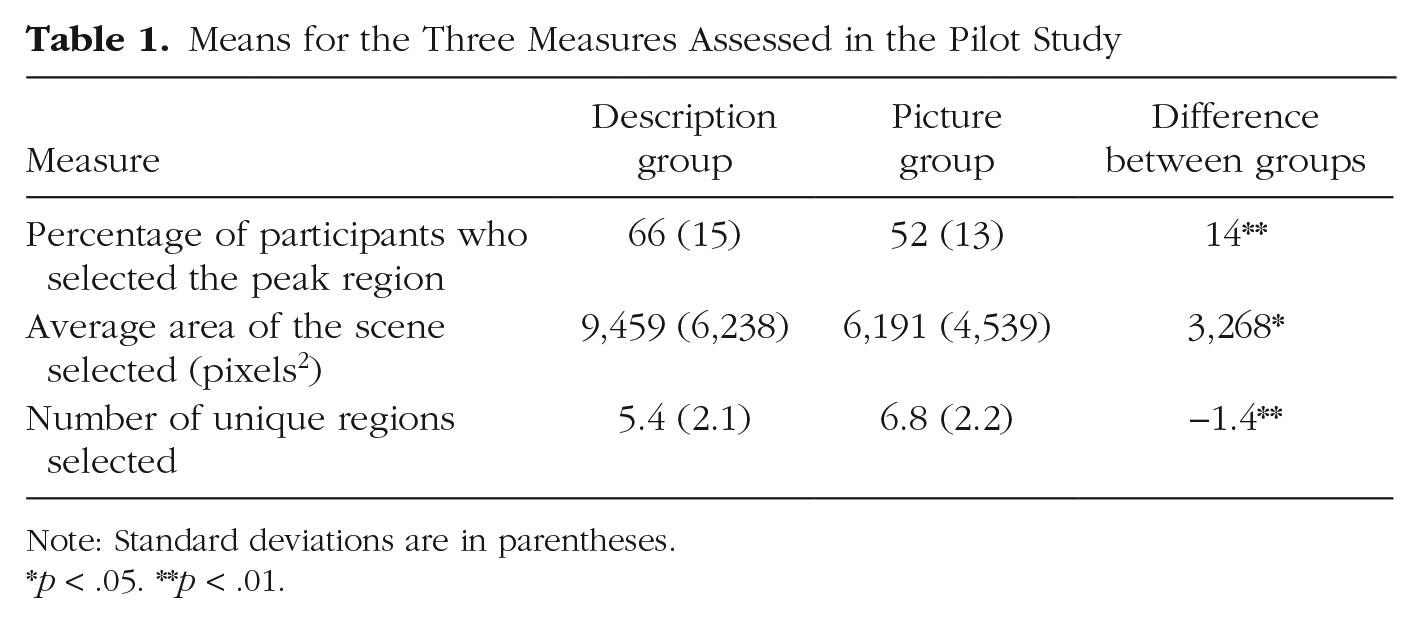
Note: Standard deviations are in parentheses.
p < .05. **p < .01.
Experiment 1
Method
Participants
Thirty-two Queen’s University undergraduate students received either $10 per hour or course credit for their participation. Sample size was determined on the basis of previous scene-search studies (e.g., Castelhano & Heaven, 2011).
Stimuli and apparatus
The stimuli were the same 36 invented objects used in the pilot study. For the study phase, each object picture was displayed on a gray background. For the search phase, each object was incorporated into 1 of 36 scenes (e.g., a kitchen, a living room; Fig. 2). Targets and scenes were counterbalanced across participants and across conditions. Targets were placed equally among the upper, middle, and lower regions of the scene.
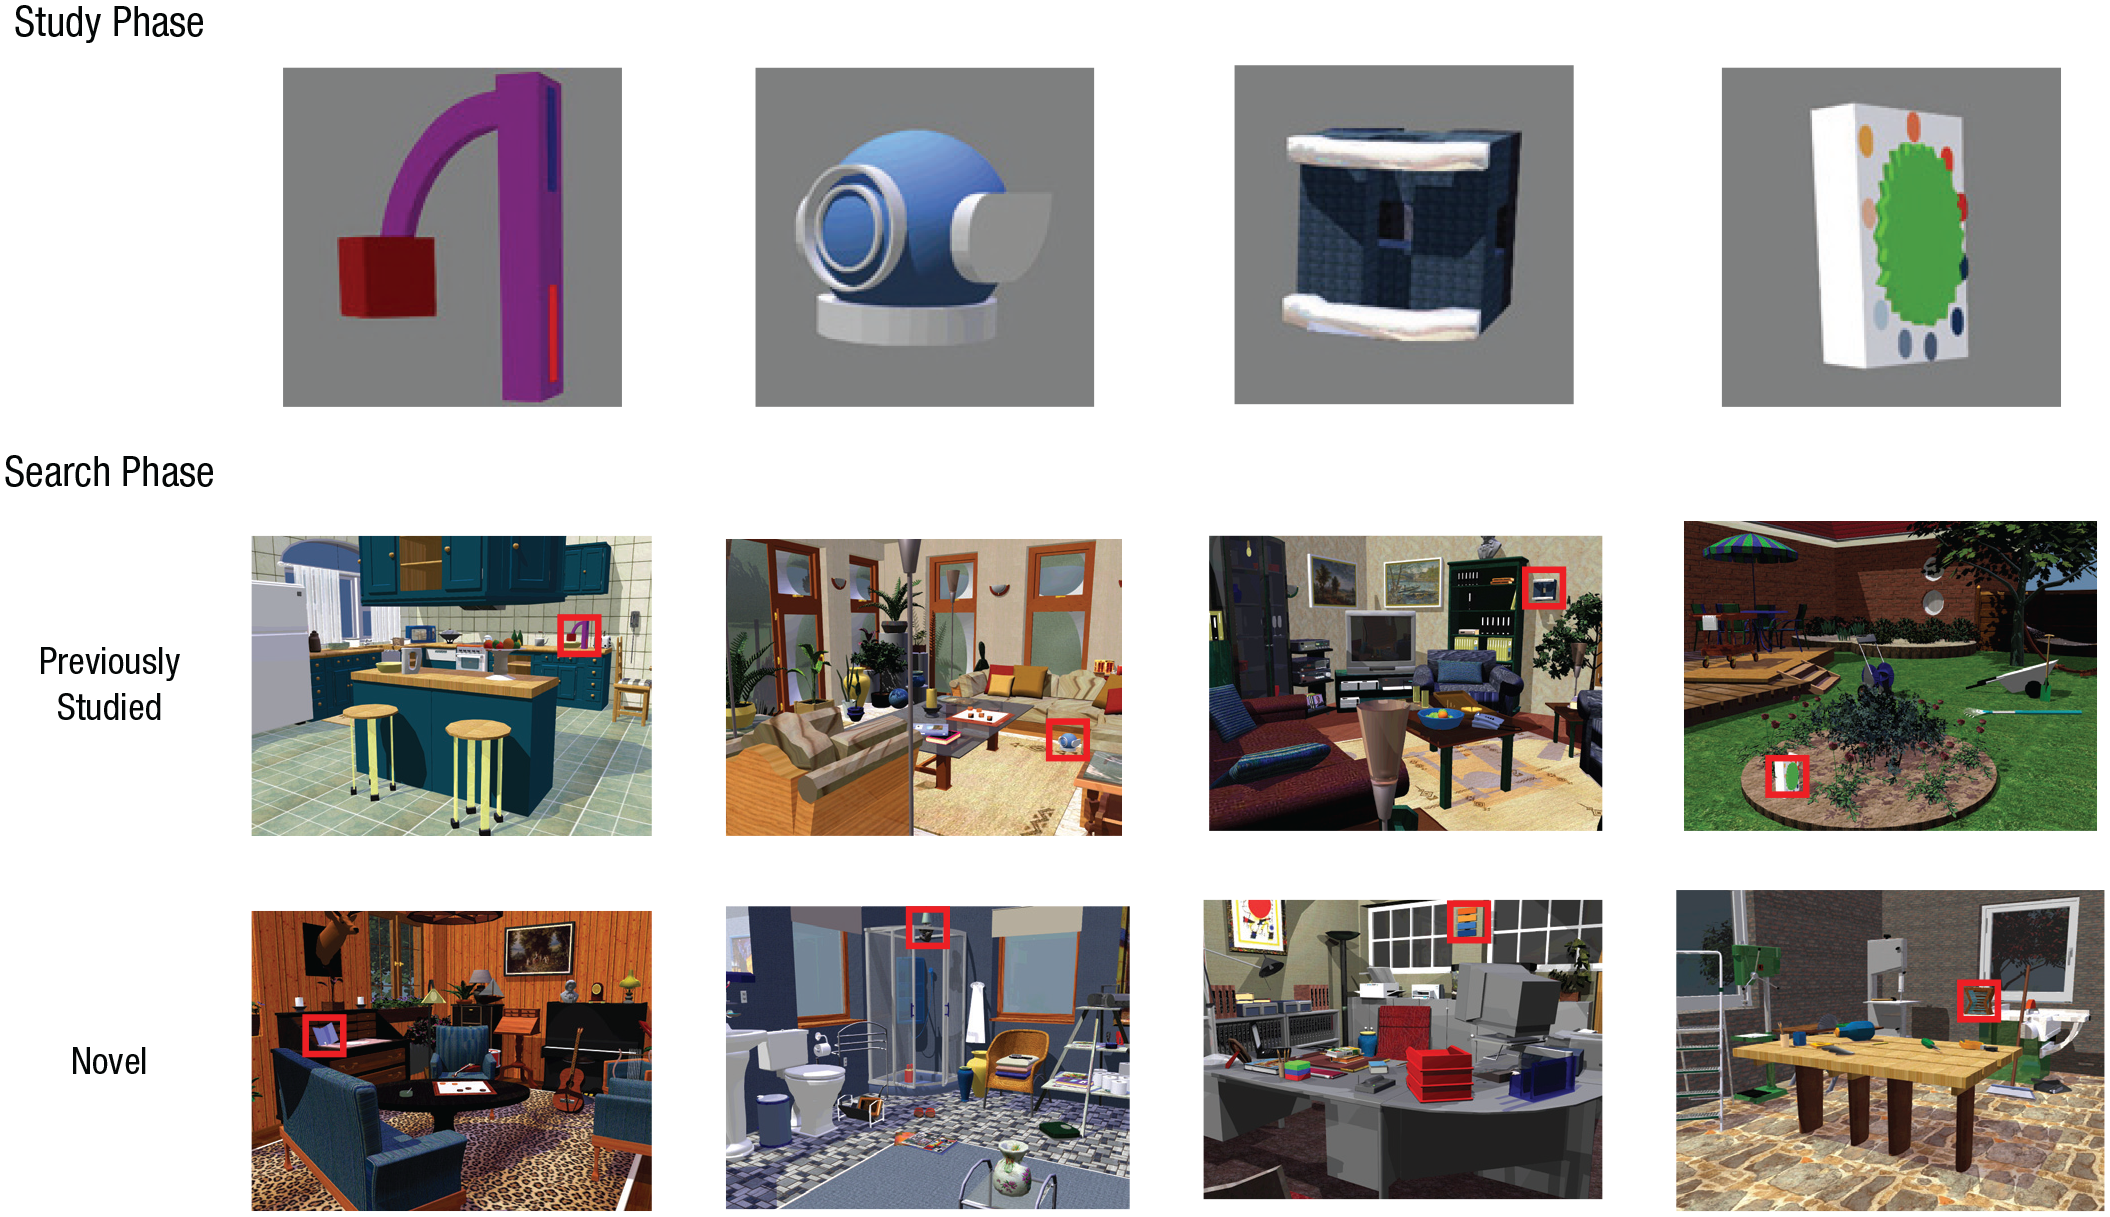
Objects and scenes from Experiment 1. The top row shows examples from the set of 36 invented objects presented in the study phase. The bottom rows show example scenes into which both studied and novel objects were placed during the search phase. Target objects in the scenes are highlighted in red.
Stimuli were presented on a 21-in. CRT monitor at a resolution of 800 × 600 pixels (38.1° × 28.6°); the monitor had a refresh rate of 100 Hz. Participants’ head movements were constrained by a chin rest, and their eye movements were tracked using an EyeLink 1000 eye tracker (SR Research, Kanata, Ontario, Canada) sampling at 1000 Hz.
Procedure
Participants were randomly assigned to either the function or feature group. During the study phase, all participants were shown 18 invented objects: The function group saw the object image and a description of its function, while the feature group saw only the image (Fig. 3, top row). Participants were instructed to study each object for a memory test, and each object remained on the screen until they pressed a button. After viewing all objects, each participant completed a four-alternative forced-choice memory test (Fig. 3, bottom rows). Participants were required to have a minimum 85% correct before beginning the search phase.
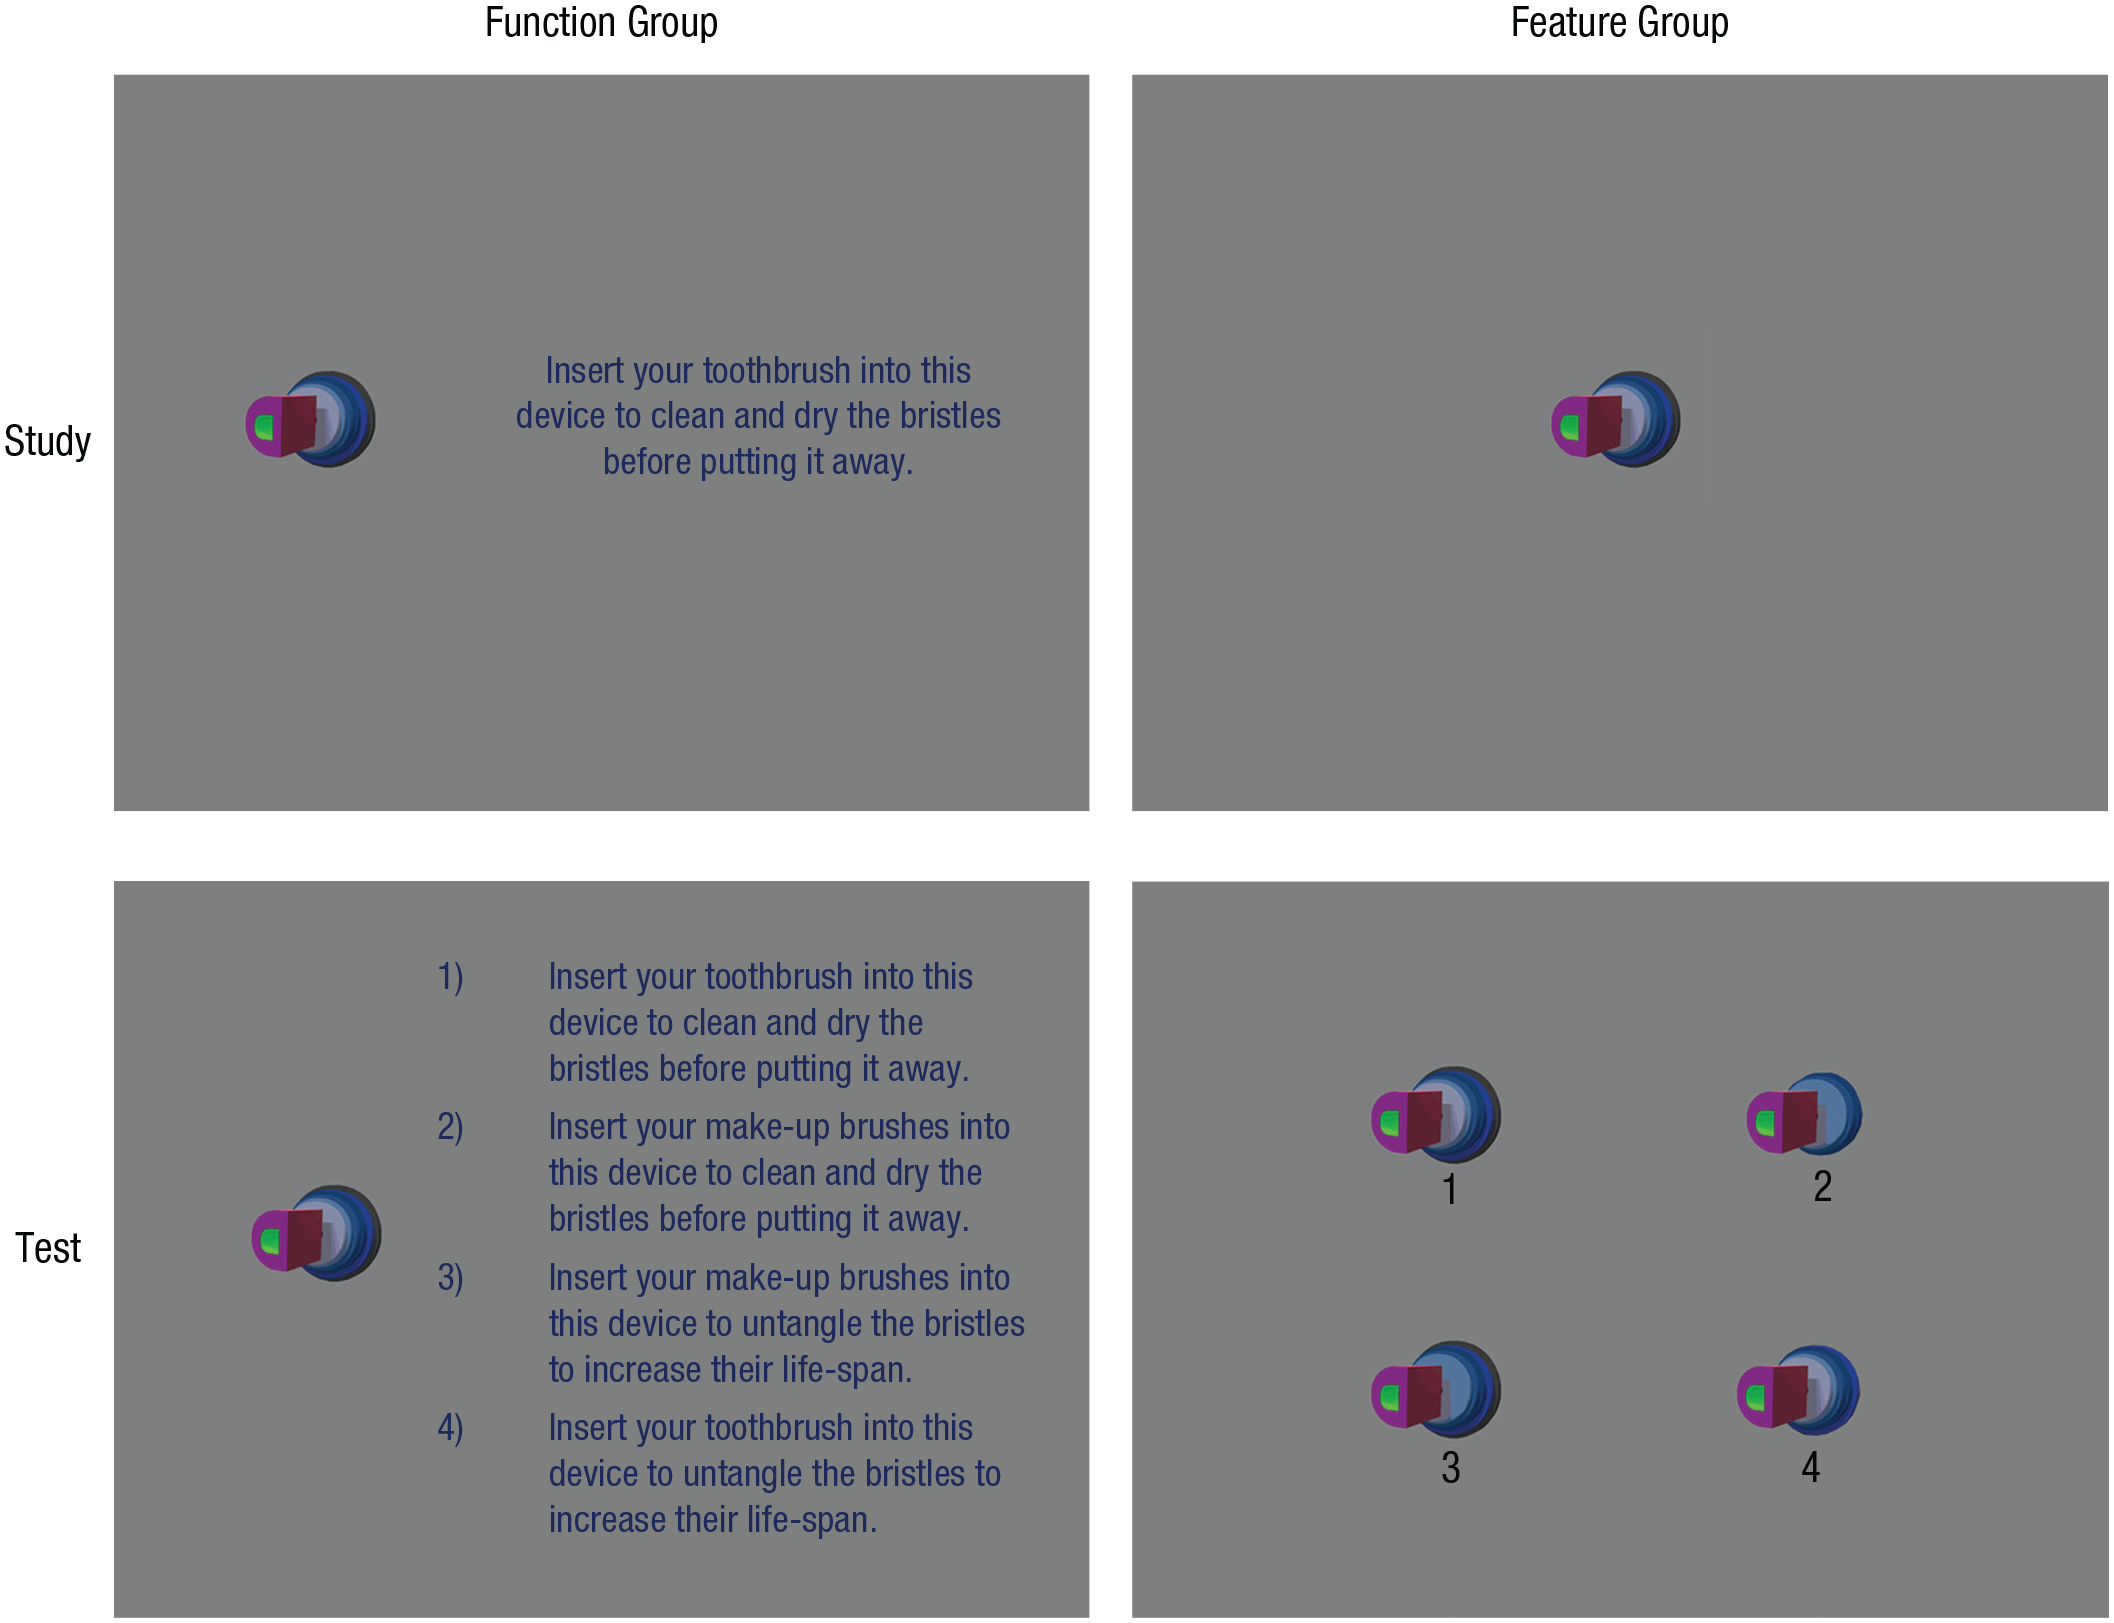
Sample trial and memory test from the study phase of Experiment 1. Participants first studied each object individually; the function group was also given an on-screen description of the object. After viewing all objects, participants completed a memory test. In these examples, the correct answer for both groups is 1. For the test for the feature group, modifications were made to the base of the object that would attach to the wall (in this example, Distractors 2 and 3 have a darker blue color compared with the target object, and Distractors 2 and 4 have fewer layers). The correct item placement was randomized during test.
For the search phase, the eye tracker was calibrated using a 9-point calibration procedure, which resulted in an average spatial error no greater than 0.4°. To maintain accurate tracking, we checked calibration before each trial and recalibrated the eye tracker when needed. We used the flash-preview moving-window paradigm to encourage participants to use knowledge of scene context and to limit their ability to use peripheral information during search (Castelhano & Henderson, 2007). For each trial, a preview of the search scene with the target absent was presented for 250 ms, followed by a visual mask for 50 ms (Fig. 4). The target object was then presented on a gray background for 2,000 ms, followed by the search scene with a gaze-contingent moving window of 2° radius. Once they located the target, participants pressed a button. The trial ended with the button press or after 20,000 ms had elapsed.
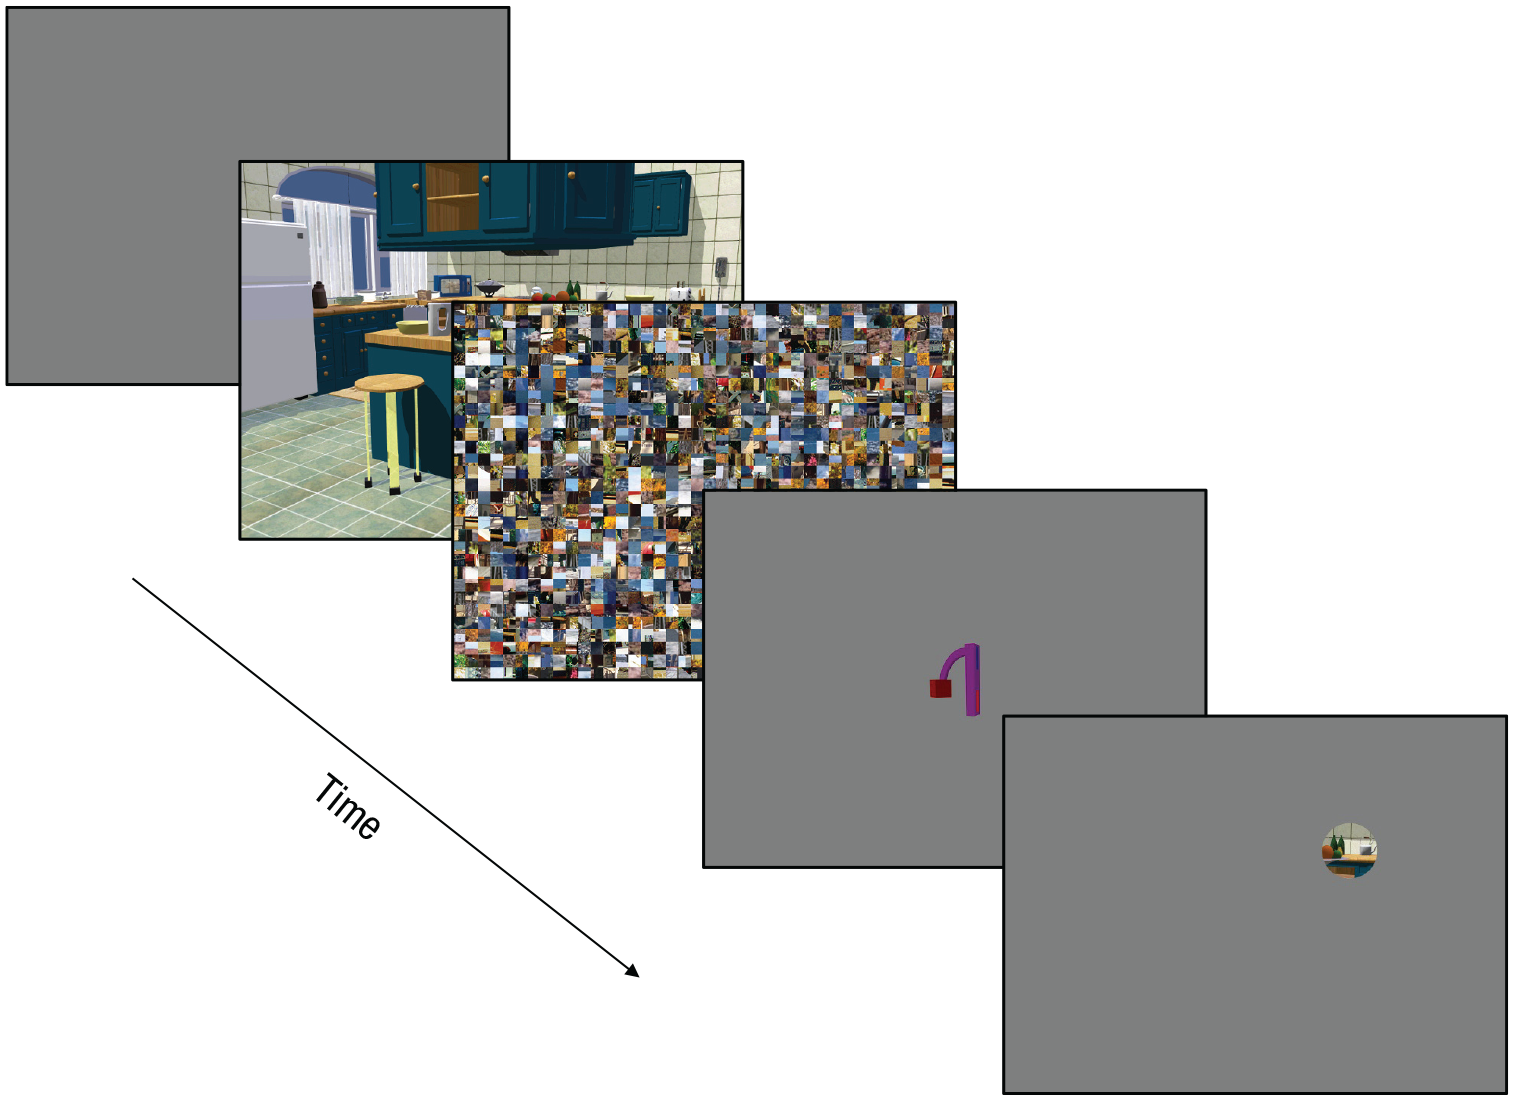
Example trial sequence from the search phase of Experiment 1. Trials began with a blank screen, after which a preview of the search screen appeared with the target absent. A mask followed, and then participants were shown only the target. Finally, the search display with the target appeared, but participants could view the image only through a gaze-contingent moving window of 2° radius. Their task was to locate the target visually and press a button.
Data analysis
To investigate the effect of object function and scene-context information on visual search, we examined both behavioral (accuracy and search time) and eye-movement measures. To more closely examine effects on gaze, we examined the eye-movement record using measures reflecting search (attentional guidance) and measures reflecting the processing and identification of the target (target processing). These measures are thought to reflect distinct processes (Castelhano & Heaven, 2010; Castelhano, Pollatsek, & Cave, 2008; Malcolm & Henderson, 2009; Nuthmann, 2014). We were most interested in the effects of object function on guidance during search, so we expected the experimental manipulations to have the greatest effects on the attentional-guidance measures. It was unclear whether learning different object properties would also have an effect on target processing.
For each measure, we conducted a mixed-design analysis of variance (ANOVA) with group (function vs. feature) and target type (studied vs. novel) as factors. Each ANOVA was followed-up with two planned comparisons that examined the difference between studied and novel objects for each group; to achieve a family-wise error of .05, we used an alpha level of .025 for individual tests.
Attentional guidance was indexed from the onset of the scene until the first fixation on the target object. Three eye-movement measures from this viewing period were calculated: latency to the target, number of fixations prior to locating the target, and scan-path ratio. Latency to the target was the total amount of time spent from the onset of the search scene up to (but not including) the first fixation on the target. Number of fixations prior to locating the target during this period was also calculated (i.e., excluding the first fixation on the target). Although related to latency to the target, this latter measure revealed whether participants were effectively selecting likely target candidates for fixation. Finally, the scan-path ratio was calculated as the total distance covered by all fixations prior to target fixation divided by the linear distance from the first fixation position to the center of the target. This measure reflected the efficiency of the search, with a higher value indicating a more indirect path to the target.
Target-processing measures indexed the decision processes assessing the object’s match to the target. For all eye-movement analyses, each target was defined by a rectangle surrounding it approximately 1° from each edge. Three measures reflecting early and later processing were calculated: first-fixation duration, first-gaze duration, and total time. First-fixation duration (the duration of the initial fixation on the target) is often seen as an indicator of the initial processing of the object (Henderson, 1992; Rayner & Pollatsek, 1992). First-gaze duration was defined as the sum of all fixations on the target from first entry to first exit in the target region and reflects the time spent first examining the object. Total time on the target was calculated by summing all fixation durations on the target before the response button was pressed.
Results
Behavioral measures
Average search accuracy was high (82%; see Fig. 5a). The ANOVA with group and target type revealed that the function group was significantly more accurate than the feature group (mean difference = 8%), F(1, 30) = 9.11, p = .005, η2 = .23, but no other effects were significant. For search time, there was a main effect of target type, F(1, 30) = 4.8, p = .036, η2 = .12, and a significant interaction between group and target type, F(1, 30) = 4.95, p = .034, η2 = .12 (see Fig. 5b). While a main effect of target type suggests that there was an effect of having studied an object (manipulation check), our theoretical interest was the interaction between group and target type. We expected the type of information viewed during the study phase to have differing effects on search performance; if knowledge of object function matters, then there should be greater performance differences between measures for the studied and novel objects in the function group than in the feature group. Further analyses revealed that the function group found studied targets significantly faster than novel targets, t(31) = 3.21, p = .009, d = −1.02, but there was no such difference for the feature group, t(31) = 0.43, n.s.
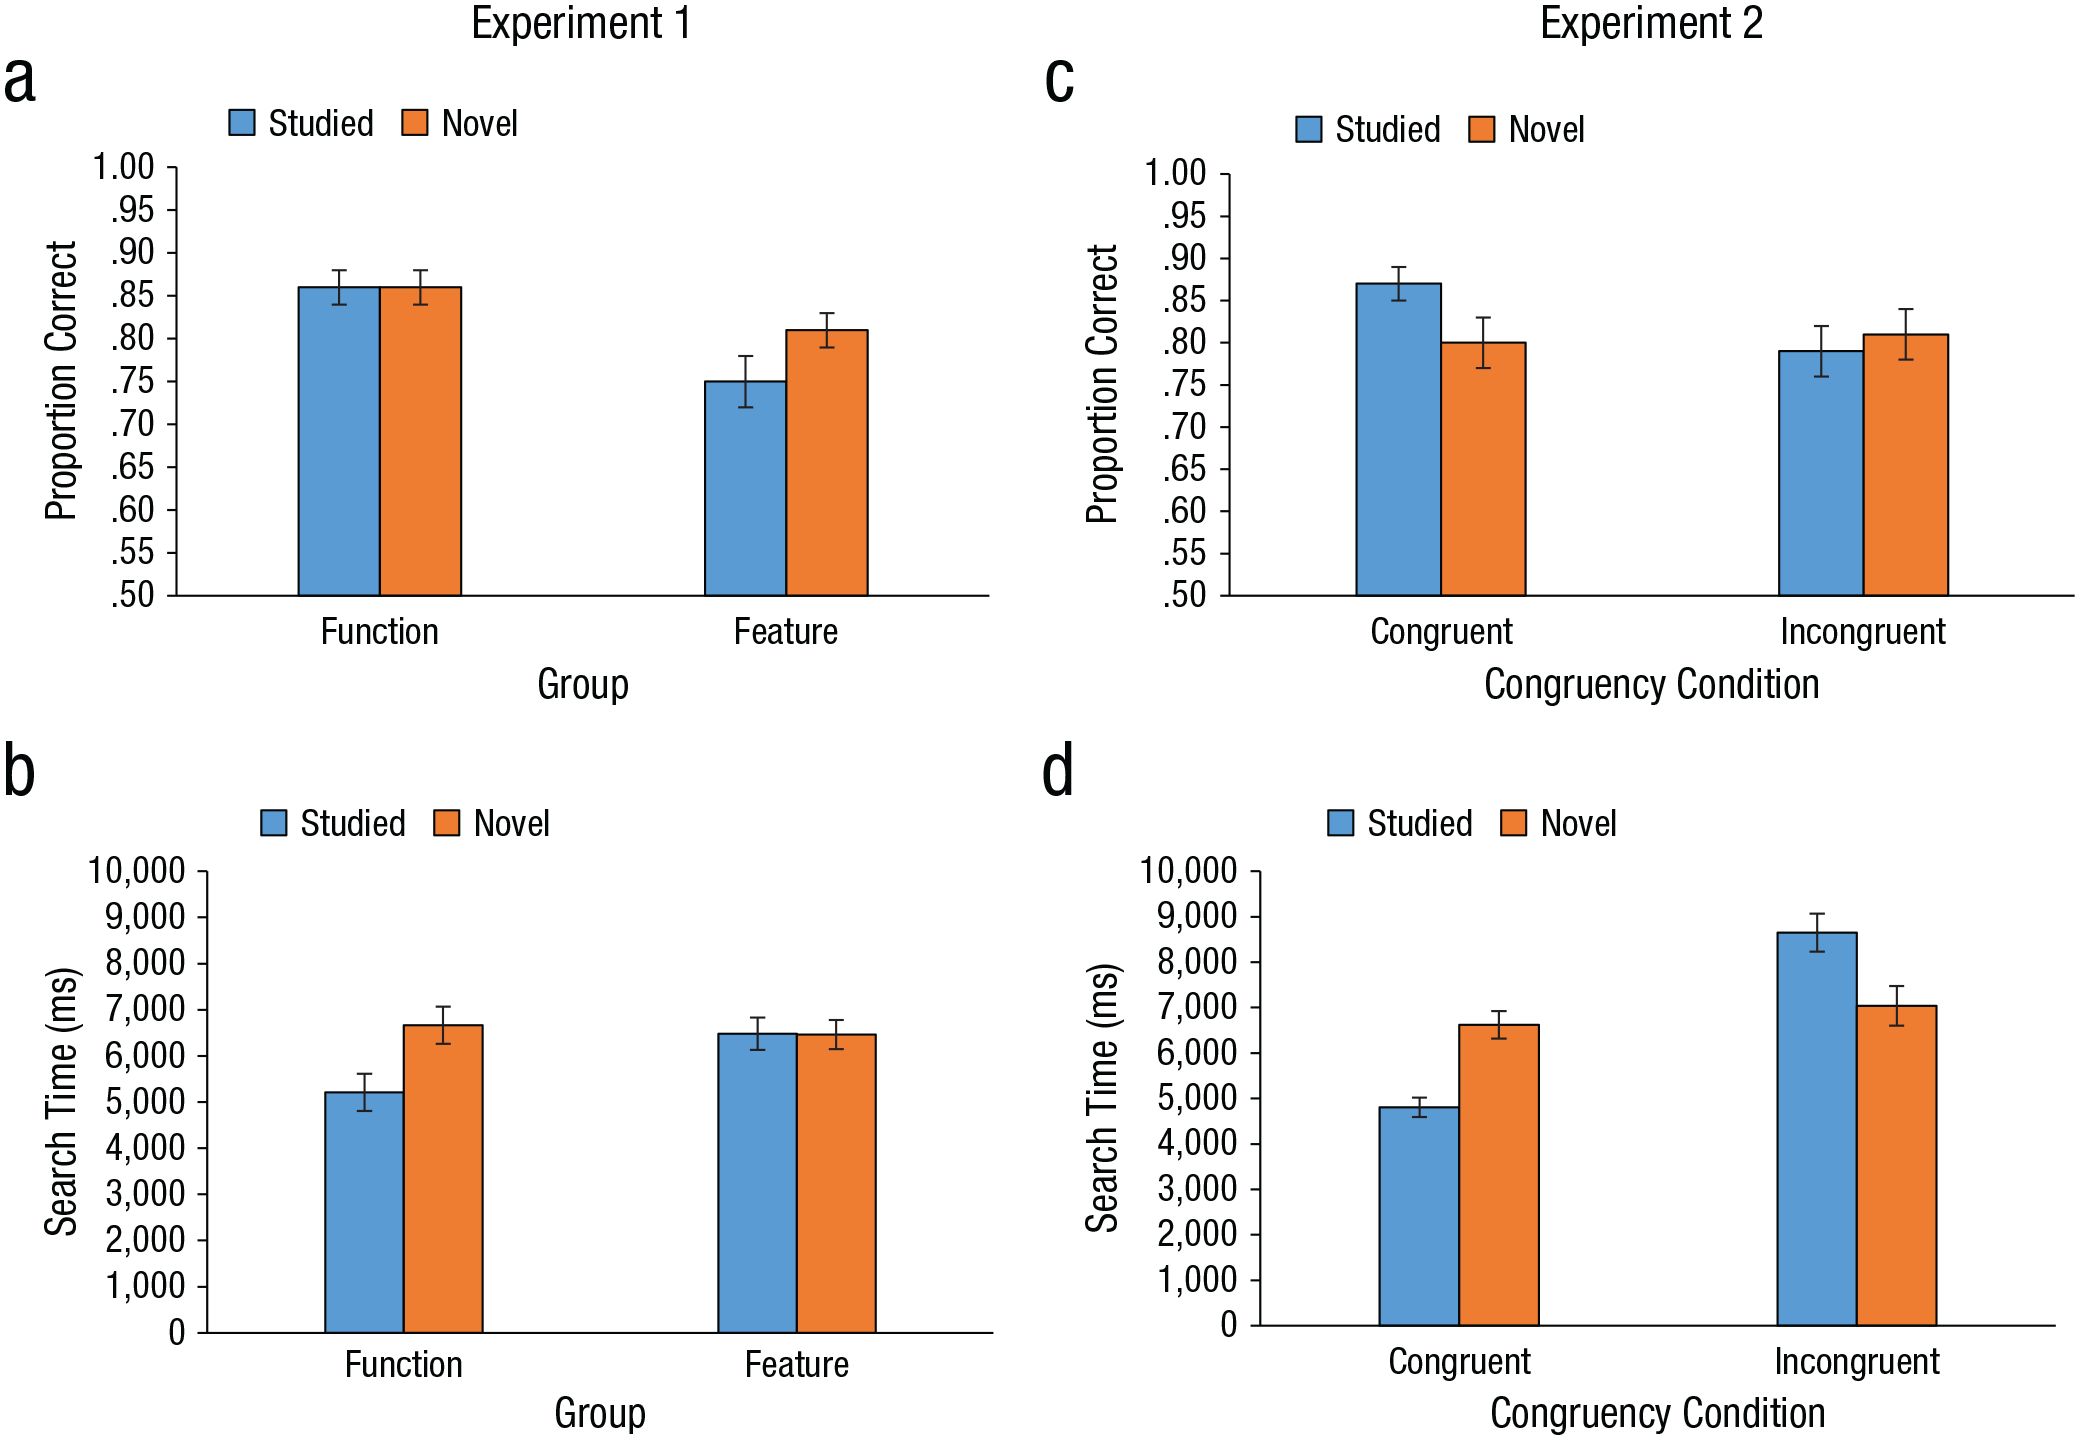
Behavioral results for Experiments 1 (left column) and 2 (right column). For Experiment 1, the graphs show (a) mean accuracy and (b) mean search time as a function of group and target type. For Experiment 2, the graphs show (c) mean accuracy and (d) mean search time as a function of the congruency between the target’s function and its location in the scene, separately for each target type. Error bars show ±1 SEM.
Eye-movement measures
Attentional-guidance measures showed considerable effects of function knowledge (Figs. 6 and 7). Analyses yielded a main effect of target type for all measures of attentional guidance—latency to the target: F(1, 30) = 4.85, p = .035, η2 = .12; number of fixations prior to locating the target: F(1, 30) = 6.17, p = .019, η2 = .14; and scan-path ratio: F(1, 30) = 6.03, p = .02, η2 = .15. Analyses also revealed significant interactions between group and target type on each measure of attentional guidance—latency to the target: F(1, 30) = 5.26, p = .029, η2 = .13; number of fixations prior to locating the target: F(1, 30) = 6.59, p = .015, η2 = .15; and scan-path ratio: F(1, 30) = 6.03, p = .02, η2 = .15. Additionally, latency to the target showed a main effect of group, F(1, 30) = 6.23, p = .018, η2 = .17. No other main effects of group were significant.
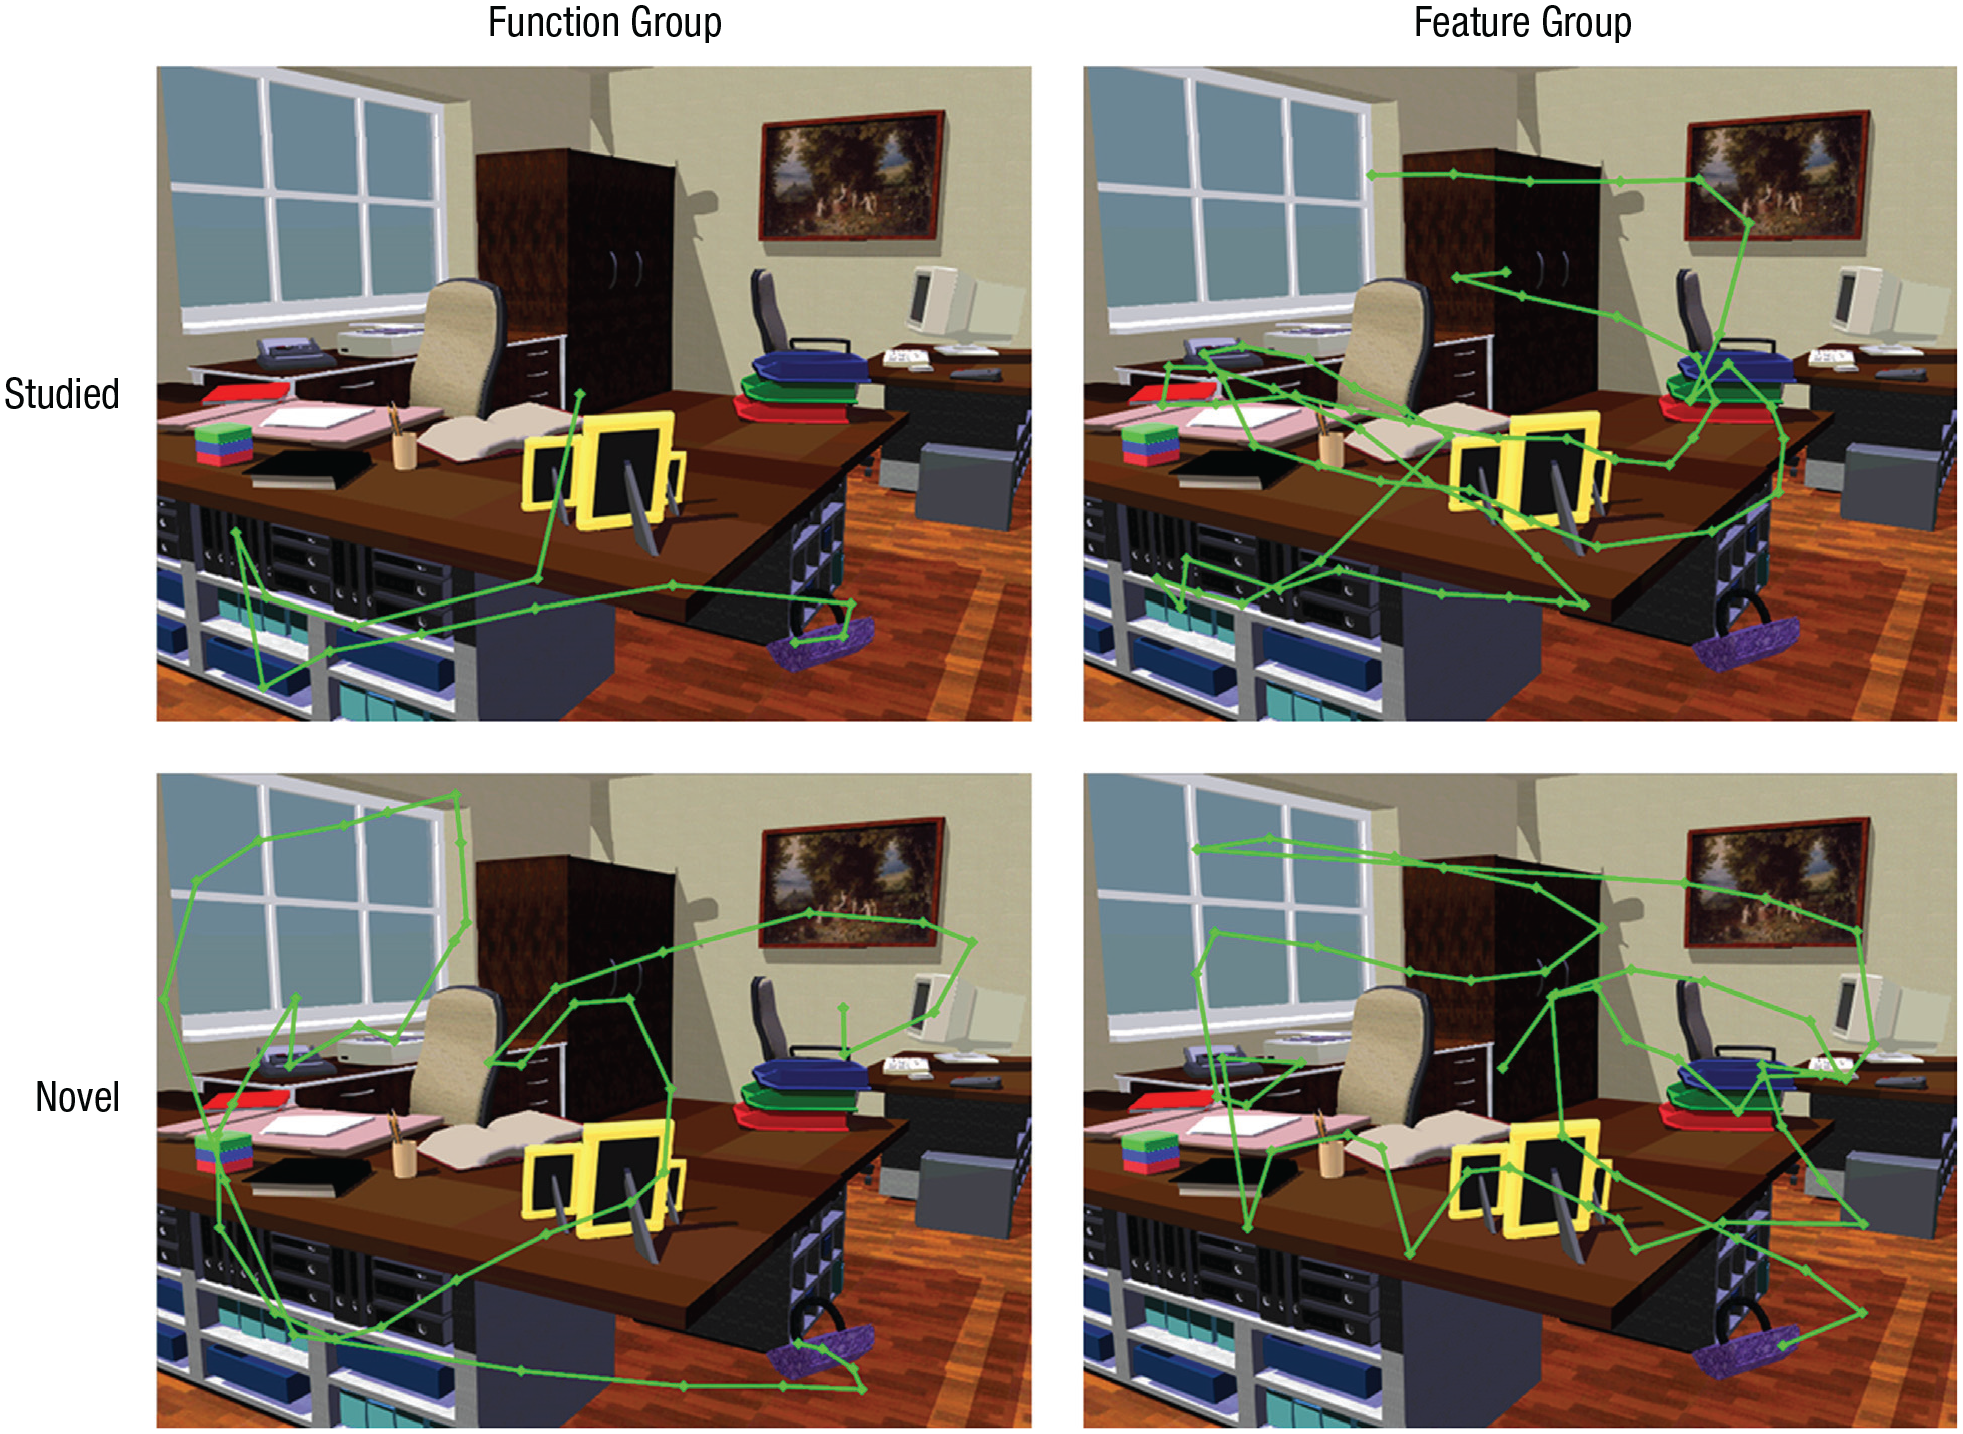
Example eye-movement patterns (green lines) in Experiment 1. For each target type (studied and novel), eye movements of a single participant in the function group and the feature group are shown across a full trial.
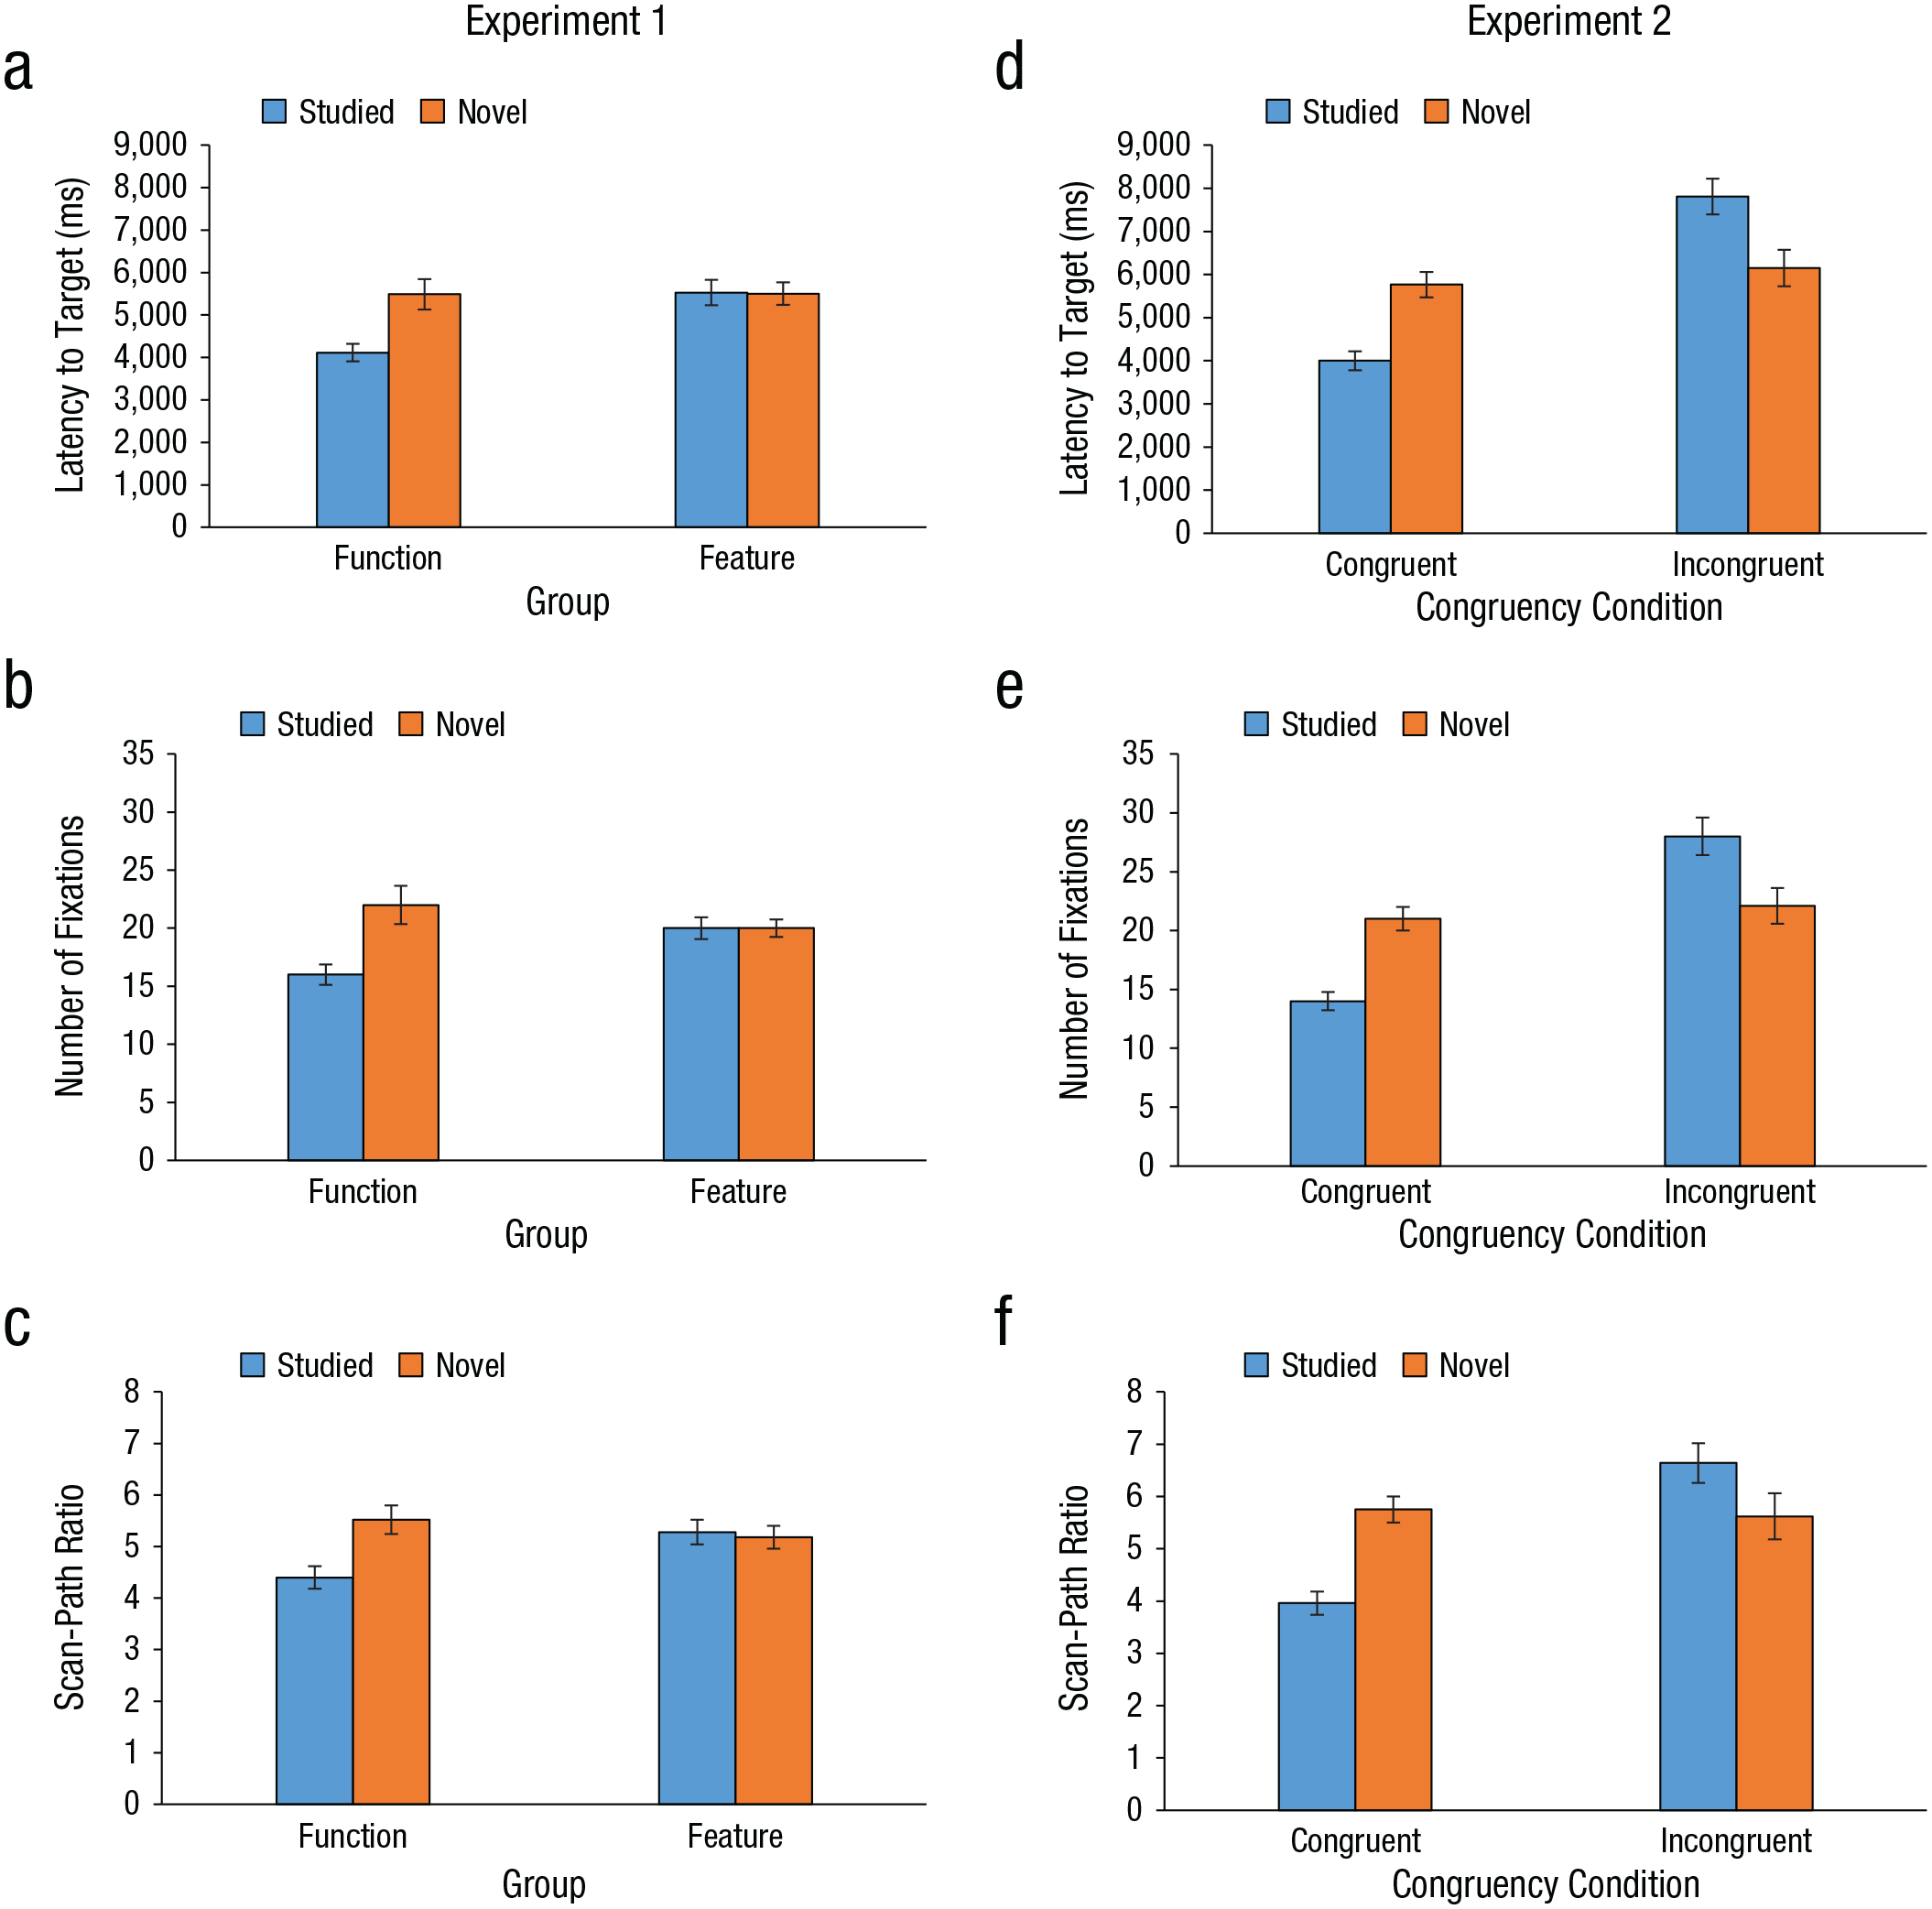
Eye-movement measures from Experiments 1 (left column) and 2 (right column). For Experiment 1, the graphs show (a) mean latency to the target, (b) mean number of fixations prior to locating the target, and (c) mean scan-path ratio as a function of group and target type. For Experiment 2, the graphs show (d) mean latency to the target, (e) mean number of fixations prior to locating the target, and (f) mean scan-path ratio as a function of the congruency between the target’s function and its location in the scene, separately for each target type. Error bars show ±1 SEM.
Further analyses investigating the interaction between group and target type revealed that there were no significant differences across measures between studied and novel objects for the feature group (ps > .8). However, for studied objects in the function group, there were shorter latencies to the target, t(15) = −2.99, p < .01, d = −1.14, fewer number of fixations prior to locating the target, t(15) = −3.28, p < .01, d = −1.07, and shorter scan paths, t(15) = −2.95, p < .01, d = −1.14, than for novel objects. Taken together, these measures indicate that the function group demonstrated better search performance than the feature group, but only for studied objects.
Target-processing measures are shown in Figure 8a through 8c. Although one might expect differences in how quickly studied and novel targets were recognized, or differences between the two groups who studied the objects differently, we found no significant effects (Fs < 1, ps > .4).
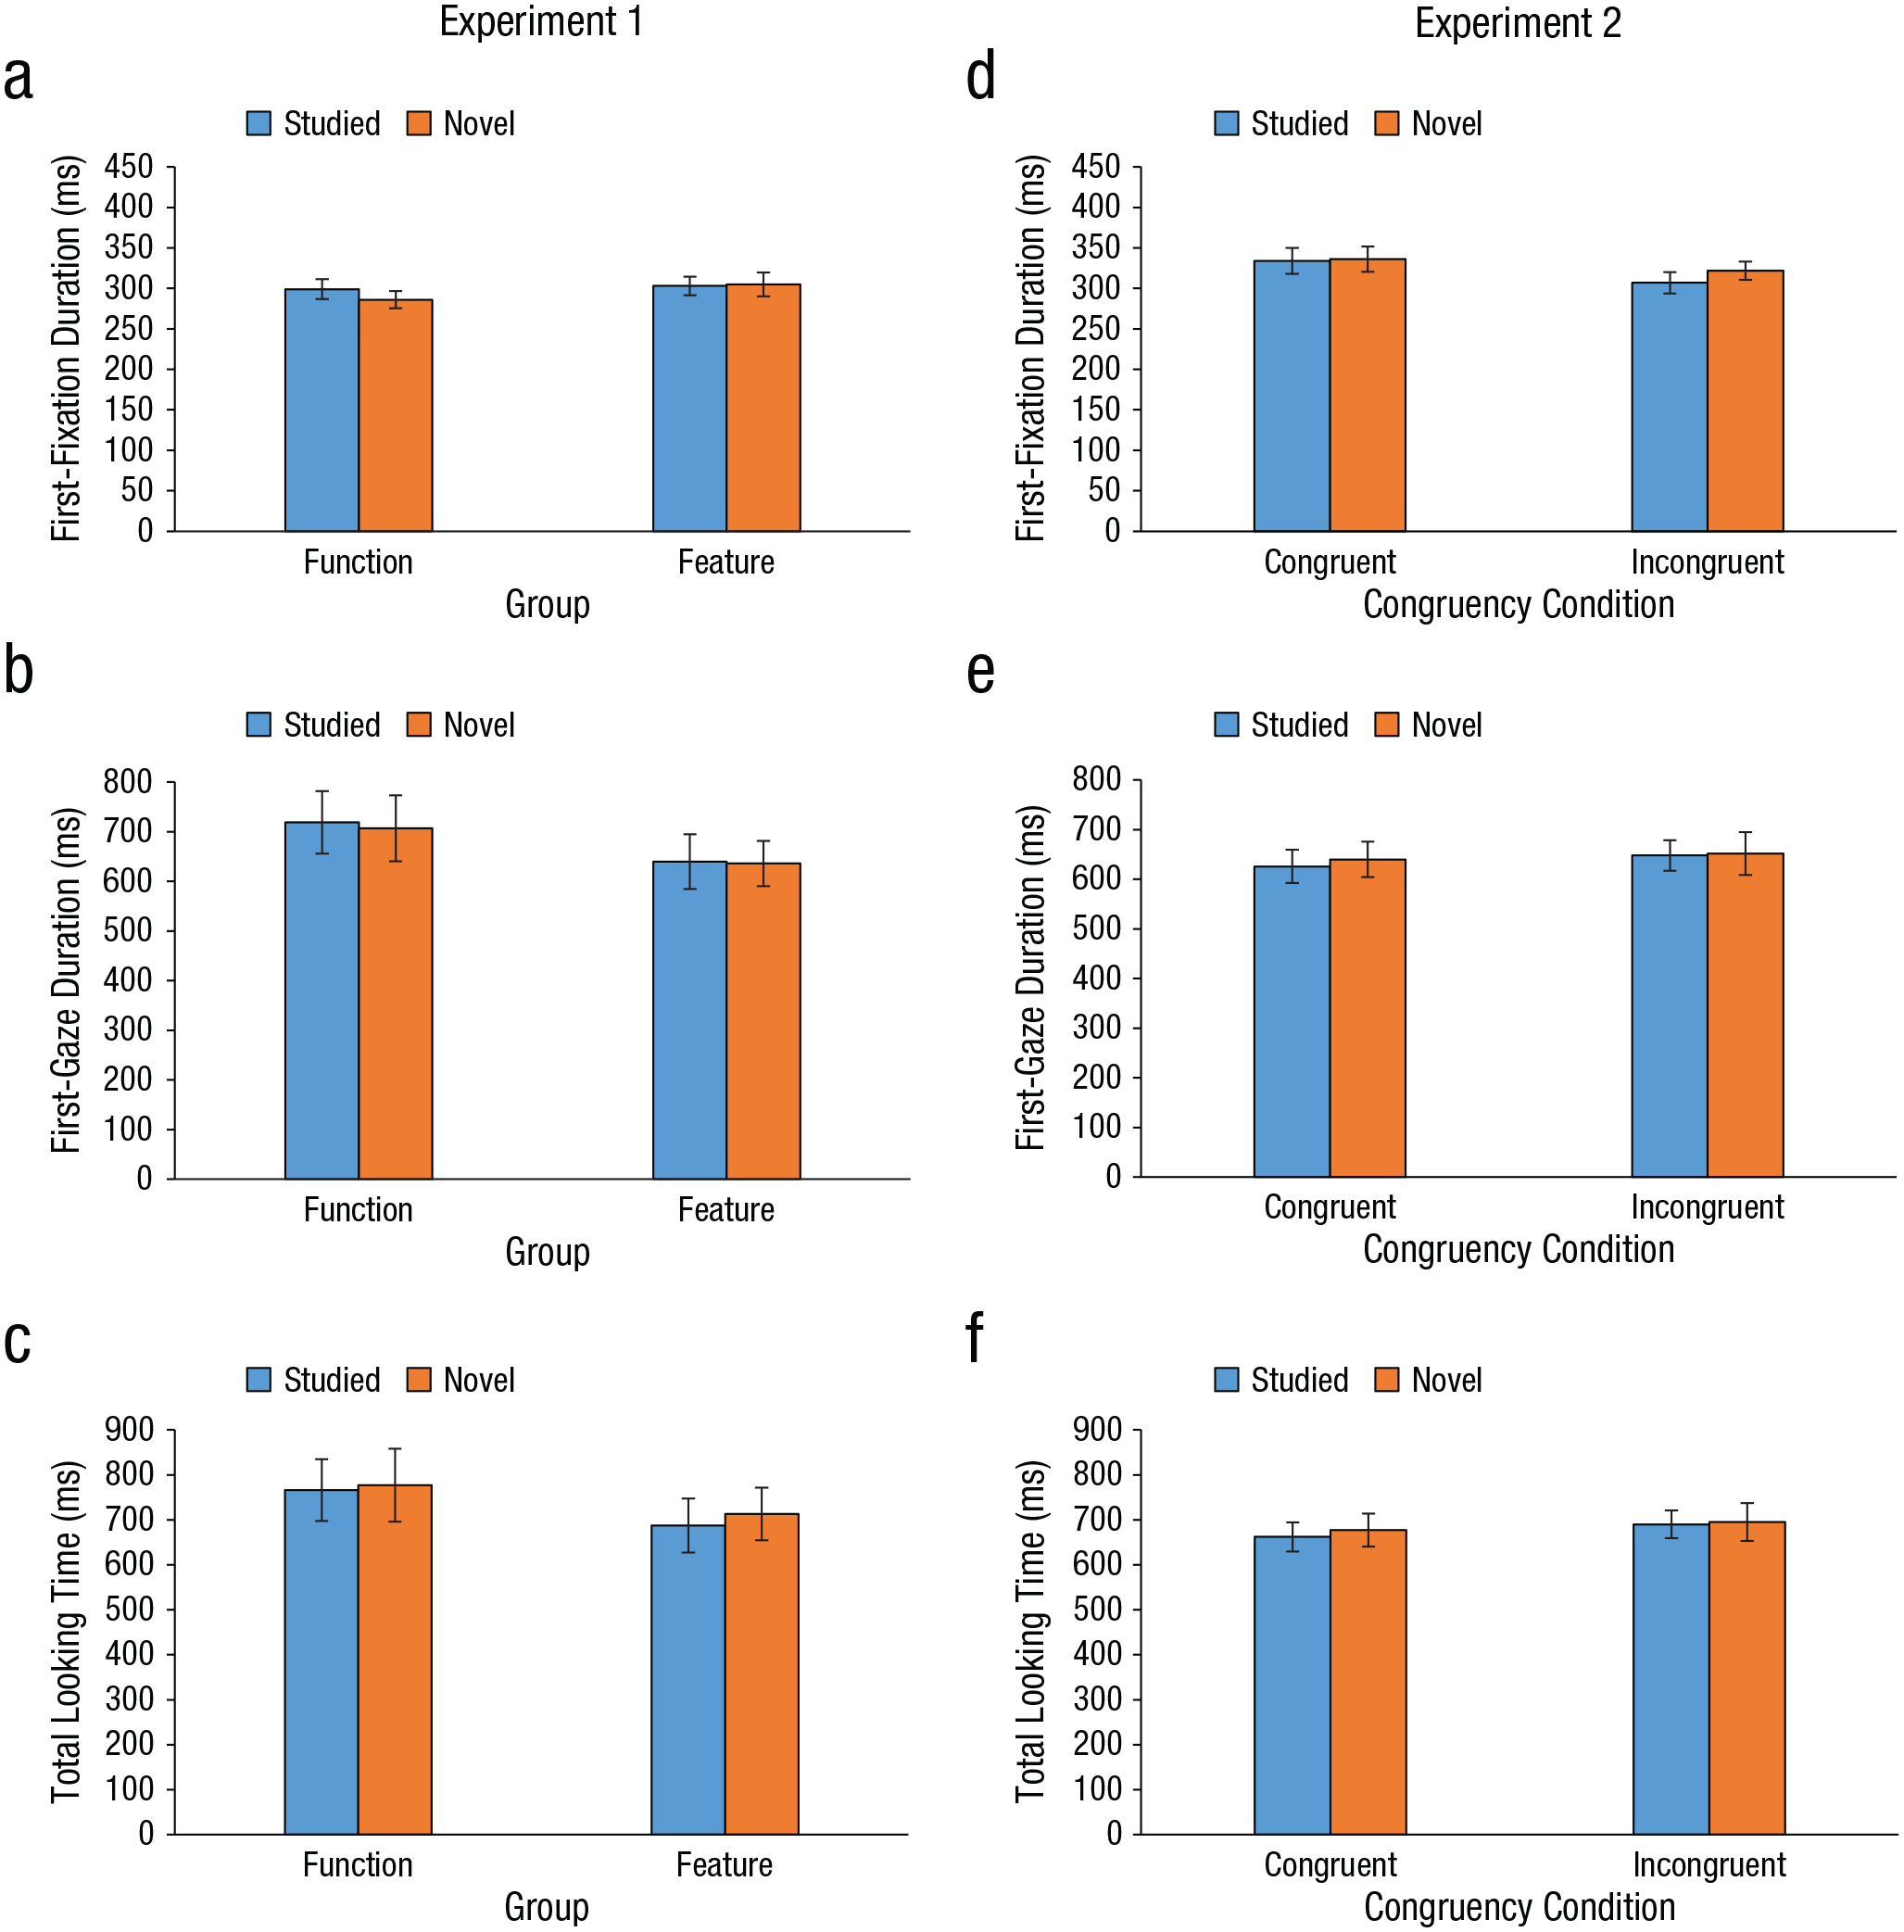
Target-processing results for Experiments 1 (left column) and 2 (right column). For Experiment 1, the graphs show (a) first-fixation duration, (b) first-gaze duration, and (c) total time spent looking at the target as a function of group and target type. For Experiment 2, the graphs show (d) first-fixation duration, (e) first-gaze duration, and (f) total time spent looking at the target as a function of the congruency between the target’s function and its location in the scene, separately for each target type. Error bars show ±1 SEM.
Discussion
Knowing an object’s function affected search above and beyond what could be inferred about object placement on the basis of its physical form. We found that targets were located sooner and with fewer fixations, and that participants’ scan paths led more directly to targets, when the targets’ function was provided than when it was not provided. This was shown by performance differences both between studied and novel objects and between groups.
We hypothesize that the benefit arose because knowledge about function constrained likely object placement within the scene. To examine whether object function led participants to search in particular scene locations, we conducted a second experiment in which target objects were placed in locations either congruent or incongruent with the objects’ functions.
Experiment 2
Method
Participants
Twenty-four Queen’s University undergraduate students (none of whom took part in Experiment 1) received either $10 per hour or course credit for their participation. Sample size was determined on the basis of previous scene-search studies (e.g., Castelhano & Heaven, 2011).
Stimuli, apparatus, and procedure
The stimuli, apparatus, and procedure were identical to those in Experiment 1, with the exception that all participants studied 18 invented objects’ function prior to the search phase. In addition, studied and novel target objects were placed in locations that were either congruent or incongruent with their function (Fig. 9).
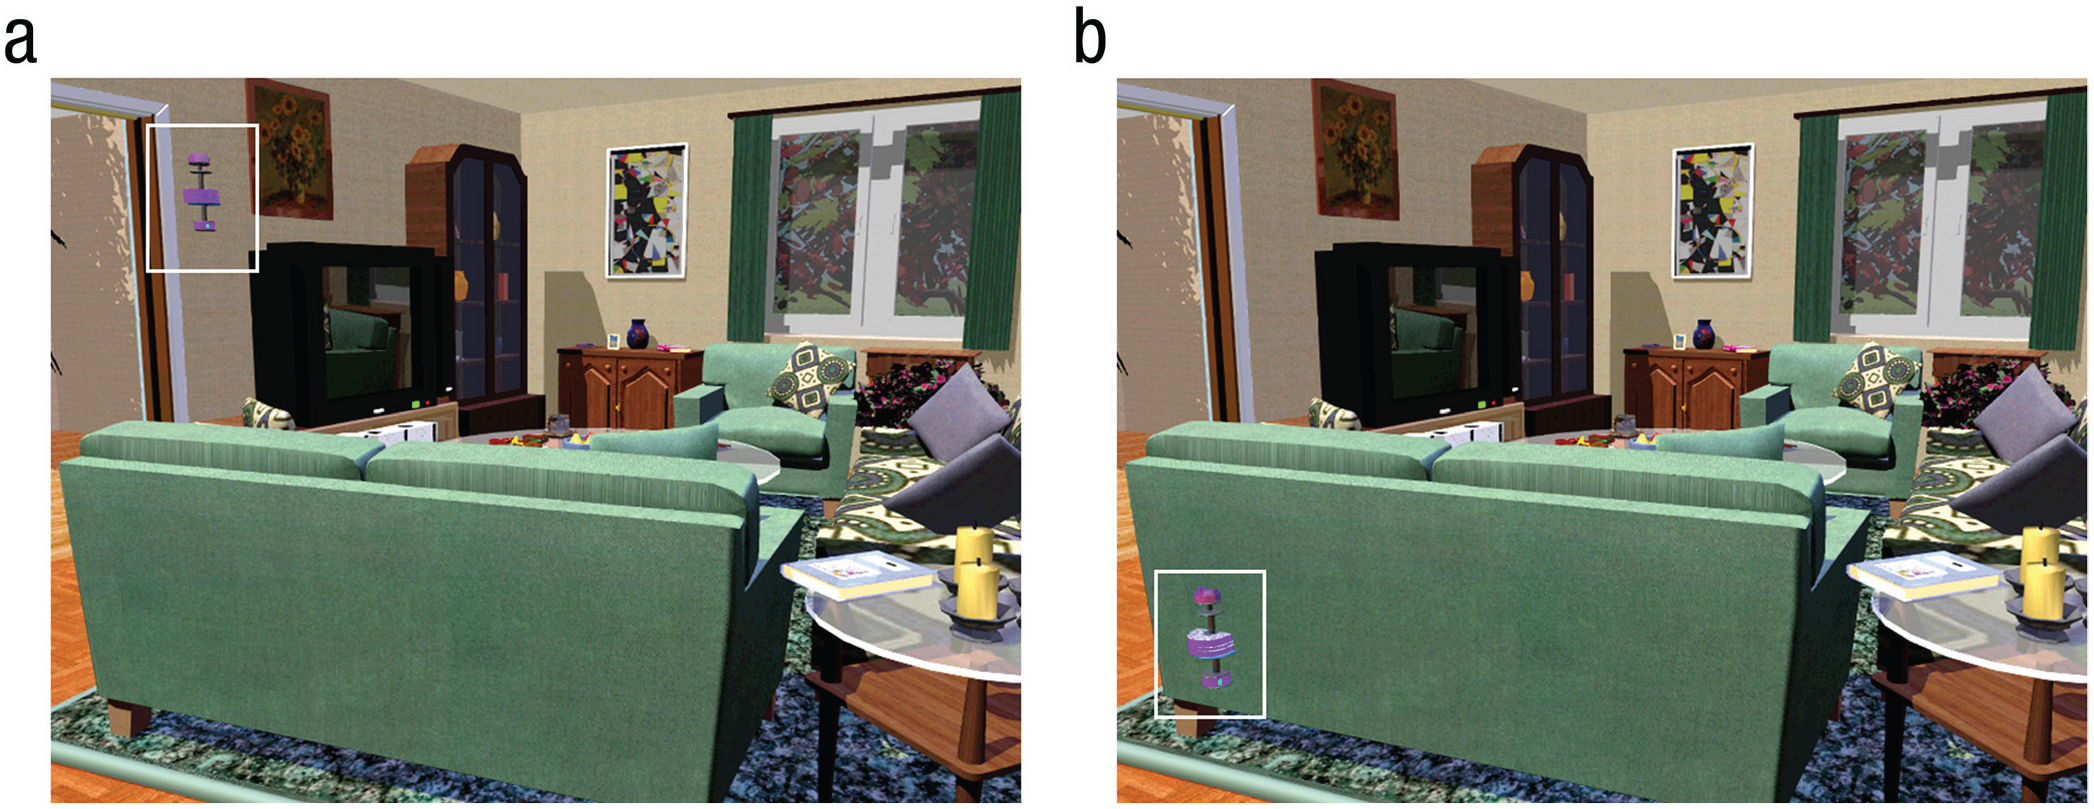
Example scenes from Experiment 2. In each scene, the location of a target object (highlighted for purposes of illustration by a white box) was either (a) congruent or (b) incongruent with the target’s function. In these examples, the target was a device that had to be flicked to scan the room and turn off all the electronic devices.
The validity of object placements in the function-congruent and function-incongruent conditions was evaluated in two norming studies. In the first, Norming Study 3, a separate group of participants (N = 20) were shown a series of scenes, and they gave a “yes” or “no” response to rate whether a specific area in the scene (indicated by a dot) was an appropriate place for a particular object, given a description of its function. The dots appeared in locations that were either congruent or incongruent with the functions of the target object. We found that the percentage of “yes” responses was significantly higher for the congruent placements (78.5%) than for the incongruent placements (19.5%), t(17) = 14.46, p < .001, d = 3.8. These results indicate that on the basis of the functional description, there were clear expectations about the appropriate placement of invented objects.
In Norming Study 4, we evaluated the congruent and incongruent placement of invented objects using data from the pilot study. We examined the correspondence between participants’ preferred location (using the highest peak from the pilot data) and the functionally congruent and functionally incongruent target locations. For each group (description vs. picture), three measures were calculated: (a) the proportion of times the preferred location overlapped with the target location, (b) the average distance from the preferred location to the target location, and (c) the proportion of times the preferred location overlapped with the target scene region. Results are presented in Figure 10.
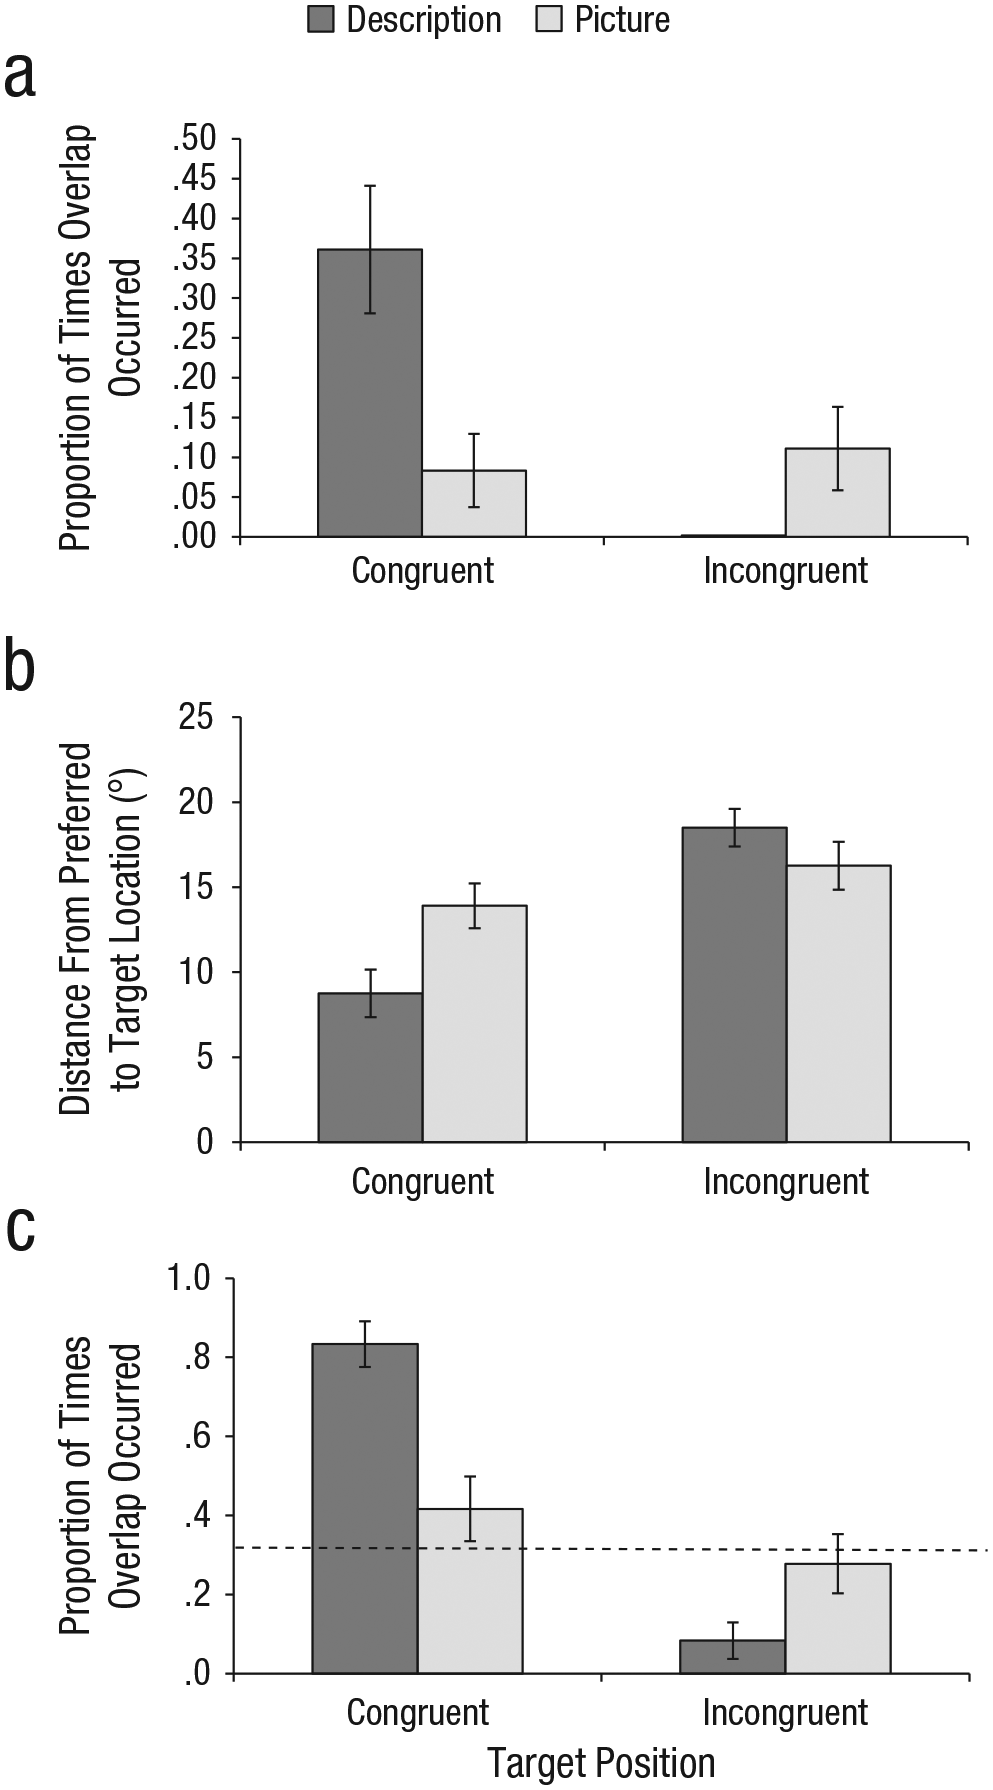
Results of Norming Study 4 from Experiment 2. The (a) mean proportion of times participants’ preferred location overlapped with the target location, (b) mean distance from the preferred location to the target location, and (c) mean proportion of times the preferred location overlapped with the target scene region are shown as a function of the congruency between the target’s function and its location in the scene, separately for each participant group. Chance (.33) is depicted by the dotted line. Error bars show ±1 SEM.
We first calculated the proportion of times there was overlap (across scenes) between participants’ preferred location and each target location (functionally congruent and functionally incongruent). We found a significant main effect of location, F(1, 35) = 8.75, p < .05, η2 = .25, as well as a significant interaction between location and group, F(1, 35) = 13.09, p < .01, η2 = .09, but a marginal main effect of group, F(1, 35) = 3.18, p = .08, η2 = .37. Further analyses showed that for the description group, the preferred target location overlapped significantly more often with the congruent location than with the incongruent location, t(35) = −4.17, p < .01, d = −1.41, but there was no difference in proportion of overlap between each location and the preferred location of the picture group, ts > 2.7, ps < .01. This is consistent with the notion that knowledge of an object’s function was associated with the object placement most consistent with that function, while the object picture did not convey similarly useful information.
In addition to looking at direct overlap of the preferred region with the target location, we also examined the distance of the preferred region to the congruent and incongruent locations when the regions did not overlap. Average distance from the preferred region to the selected target locations is depicted in Figure 10b. We found a significant main effect of location, F(1, 35) = 14.07, p < .01, η2 = .40, a marginal effect of group, F(1, 35) = 3.85, p = .058, η2 = .10, and a significant interaction between location and group, F(1, 35) = 5.93, p < .05, η2 = .17. Further analyses showed that the preferred region was significantly closer to the congruent location (8.76°) in the description group than in the picture group (> 14°), t(35) = −5.15, p < .01, d = −0.62. There was no such difference between the description and picture groups for the incongruent condition (p > .2), and the distance to the incongruent location from each of the preferred locations in the description and picture groups was farther than the distance to the congruent location in the description group, ts > 4.1, ps < .001.
Because the selection of the target location need not be an exact x-y position, but rather a general area of the scene (e.g., somewhere on the floor or a desk; see heat maps of participants’ selected regions in Fig. 1), we also looked at each overlap of the preferred region with the scene region of each target location. For this, we divided the scene into three distinct regions: the upper walls and ceilings (upper); countertops, desktops, and tabletops (middle); and floor (lower). We measured the proportion of times the selected preferred region overlapped with the scene region of the target location (target scene region) in the congruent and incongruent conditions. If there was no systematicity in the selection of the preferred target region, then the proportion of times it overlapped with the target scene region would be at chance (.33).
The average proportion of times the preferred region and the target scene region overlapped is depicted in Figure 10c. We found significant main effects of location, F(1, 35) = 26.51, p < .01, η2 = .76, and group, F(1, 35) = 7.57, p = .01, η2 = .22, as well as a significant interaction between location and group, F(1, 35) = 14.45, p < .01, η2 = .41. Further analyses showed that for the congruent scene region, the proportion of times the preferred regions overlapped was significantly greater when the description of the function was seen (.83) than when the picture was seen (.42), t(35) = 5.0, p < .01, d = 1.69, and greater than for the incongruent scene regions in each group, ts > 6.61, ps < .01. Also, the preferred region overlapped with the incongruent scene region significantly less often in the description group than in the picture group, t(35) = −2.02, p = .05, d = 0.68. Further, we found that for the description group, the overlap between the preferred and congruent regions was significantly above chance (.33), t(35) = 7.99, p < .001, d = −1.78, but the overlap between the preferred and incongruent regions was significantly below chance, t(35) = −5.28, p < .001, d = −1.79. No other conditions differed significantly from chance.
Overall, congruent and incongruent locations were validated across a number of measures. The results from these two norming studies showed that the placements chosen for the function-congruent condition were consistent with expectations based on the functional description. Likewise, the function-incongruent placements were not consistent with such expectations. Further, the results were consistent with the notion that the description of the object’s function led to highly consistent selections of placement, while the object picture did not convey similarly useful information.
Data analysis
As in Experiment 1, we examined both behavioral (accuracy and search time) and eye-movement measures and divided the eye-movement record into measures of attentional guidance and target processing. For each measure, we conducted a within-subjects ANOVA with congruency (congruent vs. incongruent) and target type (studied vs. novel) as factors. This was followed-up by two planned comparisons that examined the difference between studied and novel objects for each level of congruency; to achieve a family-wise error of .05, we used an alpha level of .025 for individual tests.
Results
Behavioral measures
Means for the behavioral measures are presented in Figures 5c and 5d. Average search accuracy was high (81% correct), and the ANOVA revealed a marginal interaction of congruency and target type, F(1, 23) = 3.36, p = .08, η2 = .04, but no other effects were significant, Fs < 1.8. Further analyses revealed marginally higher accuracy for studied objects than for novel objects in congruent locations, t(23) = 2.33, p = .029, d = 0.97, but no difference between target types for incongruent locations. For search times, analyses revealed a main effect of congruency, F(1, 23) = 33.09, p < .001, η2 = .28, and a significant interaction of congruency and target type, F(1, 23) = 23.99, p < .001, η2 = .18. Further analyses revealed that studied objects, compared with novel objects, were found significantly faster in congruent locations, t(23) = −4.66, p < .001, d = −1.4, and significantly slower in incongruent locations, t(23) = 2.8, p = .01, d = 0.76.
Eye-movement measures
Attentional-guidance measures for Experiment 2 are shown in Figures 7d through 7f. Analyses revealed main effects of congruency across all measures—latency to the target: F(1, 23) = 30.66, p < .001, η2 = .27; number of fixations prior to locating the target: F(1, 23) = 32.1, p < .001, η2 = .29; and scan-path ratio: F(1, 23) = 10.33, p = .004, η2 = .13. We also found significant interactions of congruency and target type across all measures—latency to the target: F(1, 23) = 24.25, p < .001, η2 = .18; number of fixations prior to locating the target: F(1, 23) = 31.07, p < .001, η2 = .21; and scan-path ratio: F(1, 23) = 19.37, p < .001, η2 = .16. There were no main effects of target type, Fs < 1.4, ps > .4, which was most likely due to opposing effects of congruency and was not surprising. Of main theoretical interest was the interaction between congruency and target type. The interaction reflected the effect of positioning on knowing the object function. Further analyses of objects in congruent locations revealed that, compared with searches for novel objects, searches for studied objects had shorter latencies to the target, t(23) = −4.62, p < .001, d = −1.37, fewer fixations prior to locating the target, t(23) = −5.62, p < .001, d = −1.5, and shorter scan paths, t(23) = −5.13, p < .001, d = −1.51. Additionally, analyses of objects in incongruent locations showed that searches for studied targets, compared with searches for novel targets, produced longer latencies to the target, t(23) = 2.87, p = .009, d = 0.79, and a greater number of fixations prior to locating the target, t(23) = 3.16, p = .004, d = 0.76, but scan paths were not significantly longer, t(23) = 1.88, p = .073, d = 0.50. Although previous research has shown that objects placed in incongruent locations are more difficult to process than objects placed in congruent locations (Malcolm & Henderson, 2010), target-processing measures (Figs. 8d–8f) showed no significant effects, Fs < 1.5, ps > .6.
Discussion
Results support the notion that an object’s function affected where participants searched for it in scenes. As in Experiment 1, participants located studied objects in function-congruent locations more efficiently than novel objects in function-incongruent locations. Interestingly, when objects were in function-incongruent locations, search performance was worse for studied objects than for novel objects. These results indicate that participants had expectations about where studied objects were located, and when those expectations were violated, performance worsened.
General Discussion
In the present study, we investigated whether knowledge of an object’s function could affect the guidance of attention when searching for that object in scenes. We demonstrated that search performance was significantly faster when an object’s function was known than when it was unknown. In Experiment 1, we found that participants trained on an object’s function had shorter search latencies, fewer fixations, and a more direct scan path toward target objects than participants who were familiar with that object’s appearance only.
In Experiment 2, we examined whether knowing an object’s function led participants to search in specific scene areas; invented objects were placed in locations either congruent or incongruent with those objects’ functions. Search performance benefitted from placement in congruent locations but was impaired for incongruent locations. This impairment suggests that knowing an object’s function informed search strategies initially and that knowledge of function led to spatial expectations that harmed search performance when they were violated.
One outstanding question is how knowledge of object function influences attention in relation to other sources of guidance. Previous research has shown that when the whole scene is available during search, guidance is heavily influenced by visual features in the periphery (Hillstrom et al., 2012; Hollingworth, 2009; Pereira & Castelhano, 2014). In the present experiments, the use of the flash-preview moving-window paradigm forced participants to rely on the initial representation of the scene along with knowledge about the target. While the use of the moving window allowed us to examine whether knowledge of the object’s function combined with scene context could benefit search, it is not clear whether object function would have the same benefit when peripheral information is available. Hillstrom et al. (2012) found that when the full scene was shown, the effect of a preview was limited to the first few fixations. Thus, it could be that the knowing the object’s function would last only as long as the preview information is useful. However, because object function may convey vital information about object location, the influence of object function may persist as it narrows search to relevant locations. Further research is needed to unpack how the characteristics of surrounding scene information and object function combine to affect performance (e.g., Malcolm, Nuthmann, & Schyns, 2014).
The influence of object function has many implications for theories across a number of research areas. One interesting query is how scene context is initially acquired. While previous experience of seeing objects within a particular context surely has an effect on learning (Brockmole & Henderson, 2006a, 2006b), the present study suggests that knowledge of object functions may also benefit knowledge of object placement. This would apply to both development of scene-context knowledge in infants and children as well as in adults, for whom learning a new environment quickly is crucial. Future research could look at how using objects in context (or alternatively, watching someone use objects) may establish contextual links.
On a related note, the present study has interesting implications for environmental and ecological theories, according to which real-world experience is central to cognitive function. In this study, participants did not have firsthand experience using the invented objects, but the results raise some interesting questions about the role of action itself. For instance, the strong beneficial effect of object function implies that passive learning of an object’s intended purpose is quite effective for search guidance. However, it also raises questions of how firsthand interactions with objects influence its link to the larger context. Further research is needed to examine how different methods of learning object functions varies in its effectiveness to guide attention.
The current results also have interesting implications for how object function and action is related to spatial knowledge. For instance, if a device requires reaching up high or down low, or requires the use of the hand or the foot, participants may be able to use the action to index spatial constraints within the context of a scene (e.g., upper, middle, or lower regions of the scene; Pereira, Liu, & Castelhano, 2015). Alternatively, associations with other objects in the scene may lead to spatial constraints (Bar, 2004; Fenske, Aminoff, Gronau, & Bar, 2006). With these and other possible links, it remains unclear how object function leads to improved search.
Finally, the present findings raise some interesting questions about how scenes and objects are processed in the brain. Many recent studies have revealed that different areas are recruited for different aspects of scene and object processing; such areas include the parahippocampal place area, retrosplenial complex, and transverse occipital sulcus (Baldassano, Beck, & Fei-Fei, 2013; Harel, Kravitz, & Baker, 2013; Troiani, Stigliani, Smith, & Epstein, 2014). Studies have also found that object-recognition tasks using isolated objects lead to activation of motor responses or body parts used to perform actions with the objects (Helbig et al., 2010; Kellenbach, Brett, & Patterson, 2003). However, whether there are similar links between entire environments and motor and body representations remains unclear. It would be interesting to investigate whether similar activation of actions occurs when retrieving likely spatial locations of objects. It is clear that further investigation into object functions will not only provide insights into how one processes visual information, but also into the development and influence of context on cognitive processing more generally.
Footnotes
Acknowledgements
The authors thank Sian Beilock, Ingrid Johnsrude, Kevin Munhall, and Mareike Wieth for thoughtful comments.
Action Editor
Philippe G. Schyns served as action editor for this article.
Declaration of Conflicting Interests
The authors declared that they had no conflicts of interest with respect to their authorship or the publication of this article.
Funding
This work was supported by grants from the Natural Sciences and Engineering Research Council of Canada, Canada Foundation for Innovation, and Ontario Ministry of Research and Innovation to M. S. Castelhano.