
Abstract
Can playing action video games improve visuomotor control? If so, can these games be used in training people to perform daily visuomotor-control tasks, such as driving? We found that action gamers have better lane-keeping and visuomotor-control skills than do non–action gamers. We then trained non–action gamers with action or nonaction video games. After they played a driving or first-person-shooter video game for 5 or 10 hr, their visuomotor control improved significantly. In contrast, non–action gamers showed no such improvement after they played a nonaction video game. Our model-driven analysis revealed that although different action video games have different effects on the sensorimotor system underlying visuomotor control, action gaming in general improves the responsiveness of the sensorimotor system to input error signals. The findings support a causal link between action gaming (for as little as 5 hr) and enhancement in visuomotor control, and suggest that action video games can be beneficial training tools for driving.
Playing action video games is an increasingly ubiquitous form of entertainment for adults and children. Much research has shown that it results in a wide range of benefits for both basic and higher-level visual functions, such as contrast sensitivity (R. Li, Polat, Makous, & Bavelier, 2009), motion-direction discrimination (Green, Pouget, & Bavelier, 2010), visuospatial resolution (Green & Bavelier, 2007), visuospatial attention (Feng, Spence, & Pratt, 2007; Green & Bavelier, 2003, 2006), and top-down guidance in visual search (Wu & Spence, 2013). The widespread positive effects of action gaming on visual processing have led researchers to propose that playing action video games enhances general learning capacity (e.g., Bavelier, Green, Pouget, & Schrater, 2012; Green & Bavelier, 2012).
The high demand that action gaming places on visuomotor-control skills notwithstanding, little research has focused on how action gaming affects visuomotor control. There is an older literature on changes in visuomotor control associated with video-game play more broadly construed. For example, one study found that compared with people who do not play video games, video-game players have enhanced eye-hand coordination, as indicated by better ability to follow a moving light in a rotary pursuit task (Griffith, Voloschin, Gibb, & Bailey, 1983). Furthermore, gamers also have faster reaction times than nongamers in simple visuomotor tasks (Bialystok, 2006; Orosy-Fildes & Allan, 1989; Yuji, 1996). Other studies found that elderly people who underwent video-game training developed better eye-hand coordination and had faster reaction times than those who did not play a video game (Clark, Lanphear, & Riddick, 1987; Drew & Waters, 1986). These studies, however, did not test whether the observed improvement in visuomotor control could be transferred to essential daily visuomotor-control tasks, such as driving. More important, they did not examine whether playing action video games leads to improvement in visuomotor control. It also remains an open question how action gaming affects visuomotor control and the underlying sensorimotor system, and whether different types of action video games have different effects on visuomotor control.
To address these important research questions, we took a control-theoretic approach and compared how people who did and did not frequently play action video games performed on a common driving task, lane keeping (Experiment 1). Next, because lane keeping involves using both locomotion-control strategies (see L. Li & Chen, 2010, for a review) and closed-loop visuomotor-control skills, we developed a visuomotor-control task to specifically examine visuomotor control underlying driving in action gamers (Experiment 2). This task mimicked the visuomotor-control component of lane keeping and allowed us to evaluate several aspects of closed-loop visuomotor control (i.e., control precision, response amplitude, and response delay).
To test for a causal relationship between action gaming and improvement in visuomotor control, we then randomly assigned non–action gamers to play either an action or a nonaction simulation video game. We tested two types of action video games frequently used in previous studies: a driving game (e.g., Wu & Spence, 2013) in Experiment 3 and a first-person-shooter (FPS) game (e.g., R. Li et al., 2009) in Experiment 4. We tested non–action gamers with our visuomotor-control task before and after 5 hr and 10 hr of video-game play. We then fitted their control performance data to the crossover model, which has been extensively validated (McRuer, Graham, Krendel, & Reisener, 1965; McRuer & Krendel, 1959) and has successfully accounted for human control performance on a variety of closed-loop visuomotor-control tasks, including driving and piloting aircraft (Anderson, 1970; Hess, 1977; L. Li, Stone, & Chen, 2011; L. Li, Sweet, & Stone, 2005, 2006; McRuer, 1980; McRuer & Klein, 1975). This model helped clarify how action gaming affects the sensorimotor system underlying visuomotor control. To examine whether the effects of action gaming on visuomotor control are related to the previously reported enhancement in basic visual functions, such as contrast sensitivity, we also measured participants’ contrast sensitivity before and after video-game play.
Experiment 1: Lane-Keeping Performance
Participants
Twelve action gamers (age range = 20–35 years, M = 25) and 12 non–action gamers (age range = 18–28 years, M = 22) participated in this experiment. Four of the action gamers and 3 of the non–action gamers had a driver’s license. All participants had normal or corrected-to-normal vision, were right-handed, and were male (because of the difficulty in finding female action gamers). All were students and staff at the University of Hong Kong and provided informed consent in accordance with guidelines from the Human Research Ethics Committee of the university.
Participants qualified as action gamers on the basis of the video-game experience they self-reported on a questionnaire prior to the experiment; specifically, participants were identified as action gamers if, during the previous 6 months, they had played action video games for a minimum of 5 hr per week. The action video games that the gamers reported playing included Counter-Strike, Call of Duty, Grand Theft Auto, Battlefield, Assassin’s Creed, and Team Fortress. Participants qualified as non–action gamers if, on the same questionnaire, they reported that they had played action video games for less than 1 hr per month or had no exposure to action video games in the previous 2 years. Our minimum sample size was determined on the basis of previous studies in our lab, which showed that a sample size of 12 participants in each group provides sufficient power to evaluate lane keeping (L. Li & Chen, 2010).
Lane-keeping task
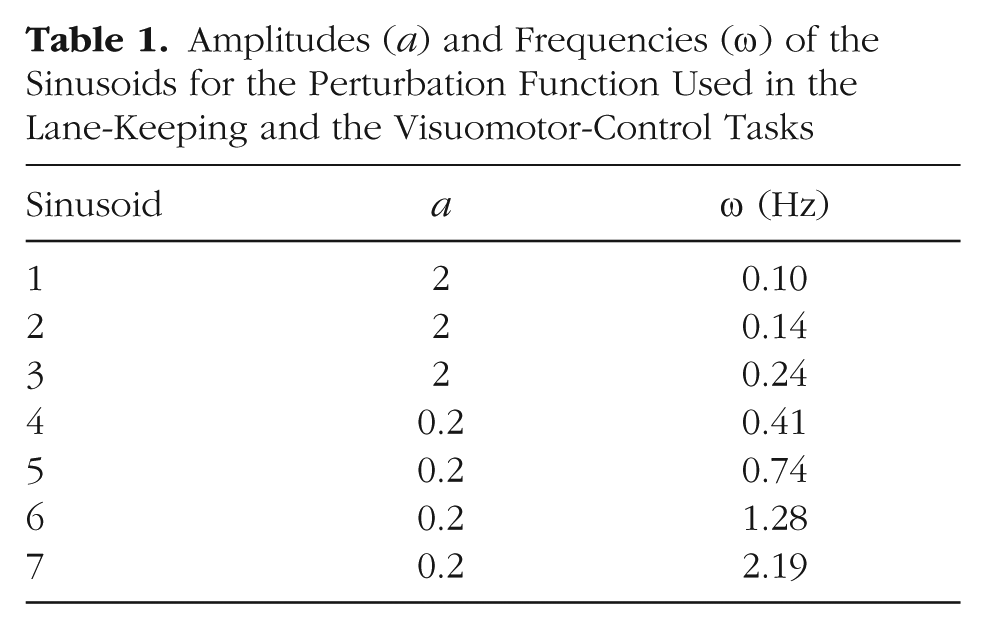
The display for this task (Fig. 1a) simulated steering a virtual vehicle down a straight lane, at the speed of 54 km per hour, over a textured ground plane (depth range = 1.55–100 m) while facing crosswind perturbation to the vehicle’s direction of movement (i.e., heading). The parameters of the lane (Fig. 1a, right) were set according to the standard highway lane markers specified by the U.S. Department of Transportation (2004). The perturbation function u consisted of the sum of seven harmonically unrelated sinusoids given as a function of time (t):

where ai represents the amplitude and ω i represents the frequency of the ith sine component (Table 1), ρ i is a random phase offset drawn from the range –π to π in each trial, and D is the disturbance gain. D was set to 2.86°, and the uncorrected vehicular-heading rotation rate due to crosswind perturbation averaged 8.38° per second (peak = 31.32°/s). This sum-of-sinusoids perturbation series made crosswind perturbation appear to be random (see McRuer & Krendel, 1974) and allowed for a frequency-based analysis of lane-keeping performance.
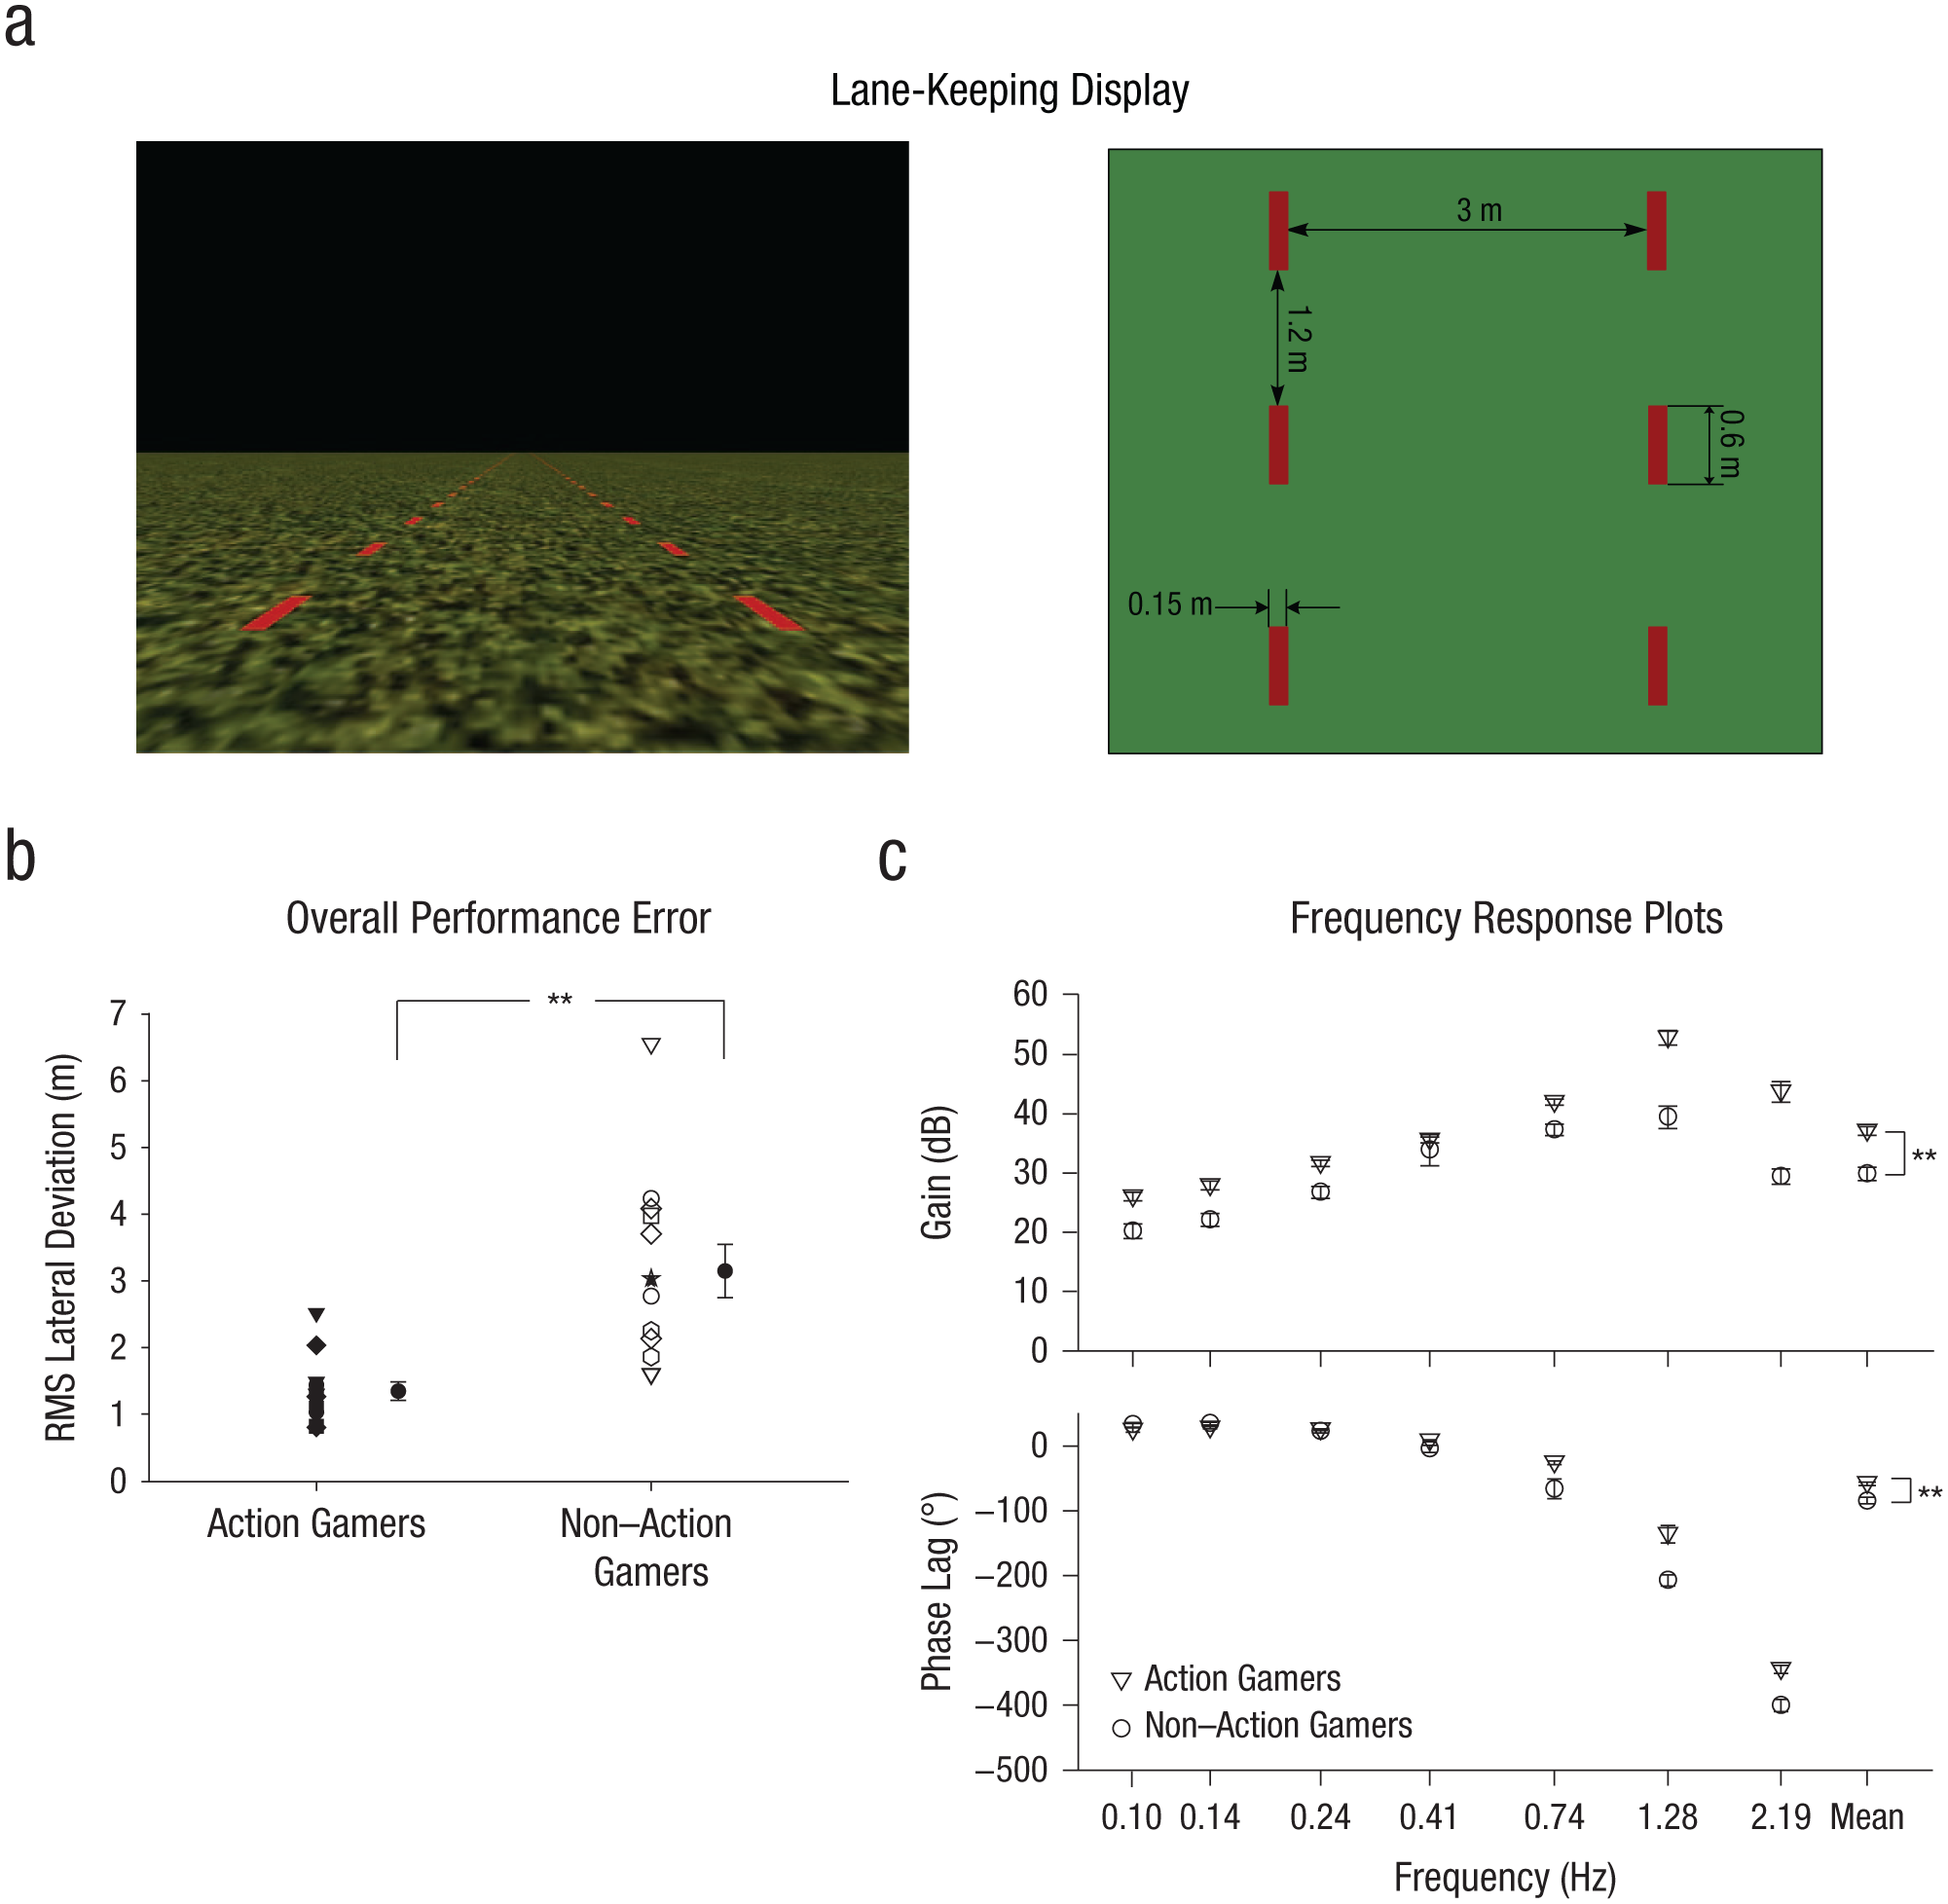
Study 1. In (a), the image on the left illustrates the display (110° × 94°) used in the lane-keeping task, and the image on the right shows the bird’s-eye view of a segment of the lane markers and their parameters. The graph in (b) shows the root-mean-square (RMS) vehicular lateral deviation for each participant; the mean for each participant group (n = 12) is plotted to the right of the individual results (filled circle). The graphs in (c) present the mean gain (top) and mean phase lag (bottom) for each group as a function of input perturbation frequency (group means averaged across frequency are plotted at the far right). Error bars indicate ±1 SE (note that some error bars are smaller than the data symbols). Asterisks indicate significant differences between groups (**p < .001).
Amplitudes (a) and Frequencies (ω) of the Sinusoids for the Perturbation Function Used in the Lane-Keeping and the Visuomotor-Control Tasks
Participants were asked to use a steering wheel (Porsche 911 GT2, Fanatec, Landshut, Germany) to steer the virtual vehicle to stay in the center of the lane during each 95-s trial. The angular displacement of the steering wheel (sampled at 60 Hz) was proportional to the vehicular-heading rotation rate. Given that the vehicular heading is the direction of the vehicular traveling velocity, which is the time derivative of the vehicular position in the lane, the displacement of the steering wheel was proportional to the vehicular lateral acceleration. Accordingly, the steering wheel had acceleration controller dynamics with respect to the vehicular lateral position. Its maximum displacement corresponded to a peak vehicular-heading rotation rate of 40.79° per second (i.e., peak vehicular lateral acceleration = 10.62 m/s2).
Participants were seated in a lightproof booth and viewed the display on a large screen (110° × 94°). Participants’ cyclopean eye (i.e., their straight-ahead) was aligned with the center of the screen. They completed two practice trials and then three experimental trials. The experiment lasted less than 30 min.
Data analysis
The time series of the vehicular lateral deviation from the center of the lane, the steering wheel’s displacement, and the input heading perturbation were recorded. We analyzed the data beginning 5 s after the start of each 95-s trial to ensure that we skipped the initial transient response. To examine the effects of action gaming on visuomotor control, we computed several metrics. Total performance error, which reflected overall control precision, was measured as the root mean square (RMS) of the recorded time series of the vehicular lateral deviation (in meters). RMS vehicular lateral deviation does not differentiate between performance error arising from inappropriate response amplitude and performance error due to time delay, so to examine the amplitude and delay of participants’ control responses as a function of input perturbation frequency, we performed frequency (Bode) analyses. Specifically, we applied Fourier analysis to the time series of the steering wheel’s displacement (in percentage of maximum displacement) and the vehicular lateral deviation (in meters) in each trial, computing the control-response amplitude (i.e., gain, in percentage of maximum meters) and delay (i.e., phase lag, in degrees) by taking the ratio of the Fourier coefficients of the steering wheel’s displacement and the vehicular lateral deviation at each input perturbation frequency. To examine whether action gamers and non–action gamers performed differently on the lane-keeping task, we conducted an independent-samples t test on each of these performance metrics.
Results
Figure 1b plots the mean RMS vehicular lateral deviation for the two participant groups. As expected, the action gamers showed better precision in lane keeping: The mean RMS vehicular lateral deviation was smaller for the action gamers (M = 1.34 m, SE = 0.14 m) than for the non–action gamers (M = 3.15 m, SE = 0.40 m), t(22) = 4.08, p = .0005, Cohen’s d = 1.67.
Figure 1c plots the lane-keeping control gain and phase lag at each input perturbation frequency for the two groups. The increase in gain and the phase lead at low frequencies are typical characteristics of a differentiator operator with acceleration controller dynamics in a closed-loop manual control task (Jagacinski & Flach, 2003; L. Li et al., 2005, 2006). Independent-samples t tests showed that the mean gain was larger for the action gamers (M = 37.09 dB, SE = 0.73 dB) than for the non–action gamers (M = 29.84 dB, SE = 1.13 dB), t(22) = 5.15, p = .000004, Cohen’s d = 2.10, and that the mean phase lag was smaller for the action gamers (M = 60.01°, SE = 2.87°) than for the non–action gamers (M = 84.17°, SE = 4.34°), t(22) = 4.43, p = .0002, Cohen’s d = 1.81.
Experiment 2: Performance on a Visuomotor-Control Task
Participants
Fourteen action gamers (age range = 19–23 years, M = 21; all males) and 14 non–action gamers (age range = 19–28 years, M = 22; all males) participated in this experiment. The two groups of participants were identified by the same criteria as in Experiment 1. Two of the action gamers and 5 of the non–action gamers also participated in Experiment 1. One action gamer and 2 non–action gamers had a driver’s license. All participants provided informed consent in accordance with guidelines from the Human Research Ethics Committee of the university. Our minimum sample size for this experiment was determined on the basis of previous studies in our lab, which showed that a sample size of 6 participants in each group provides sufficient power to evaluate visuomotor control (L. Li et al., 2011; L. Li et al., 2005, 2006).
Visuomotor-control task
The display for the visuomotor-control task (Fig. 2a) showed a red round Gaussian target (σ = 3.1°; peak luminance = 2 cd/m2) on a uniform black background (0.068 cd/m2; 60-Hz refresh rate). Its horizontal position was perturbed by the same perturbation function used in Experiment 1 (Equation 1). The disturbance gain (D) was set to 8.1°, so the uncorrected speed of the target’s movement due to perturbation averaged 23.5° per second (peak = 95.7°/s). The target initially appeared at the center of the screen and began moving when participants pulled the trigger of a high-precision joystick (Flybox, B&G Systems, Palo Alto, CA). The joystick’s displacement (sampled at 60 Hz) was proportional to the target’s movement velocity. Accordingly, the joystick had velocity controller dynamics with respect to the target’s position on the screen. This basic type of controller dynamics made the target easier to control than the vehicle in the lane-keeping task in Experiment 1, in which the steering wheel’s displacement was proportional to the vehicular lateral acceleration. The joystick’s maximum displacement corresponded to a peak target-movement speed of 81.2° per second. Participants were asked to smoothly move the joystick from left to right in order to control the horizontal movement of the target so as to keep it as close to the center of the screen as possible. The rest of the experimental setup was the same as in Experiment 1. Participants completed two practice trials and then six experimental trials. The experiment lasted less than 30 min.

Study 2. The screenshot in (a) captured the display (110° × 94°) in the visuomotor-control task when the target moved along the horizontal axis to the right of the center of the screen. The graph in (b) presents a typical participant’s raw performance data (target position error and joystick response) from part of a trial. The graph in (c) shows the root-mean-square (RMS) target position error for each participant; the mean for each participant group (n = 14) is plotted to the right of the individual results (filled circle). The graphs in (d) present the mean gain (top) and mean phase lag (bottom) for each group as a function of input perturbation frequency (group means averaged across frequency are plotted at the far right). Error bars indicate ±1 SE (note that some error bars are smaller than the data symbols). Asterisks indicate significant differences between groups (*p < .05, **p < .001).
Data analysis
The time series of the target position error (distance from the center of the screen), the joystick’s displacement, and the input target-position perturbation were recorded. As in Experiment 1, we analyzed the data beginning 5 s after the start of each 95-s trial to ensure that we skipped the initial transient response. Total performance error, which reflected overall control precision, was measured as the RMS of the recorded time series of the target position error (in degrees of visual angle). To examine the amplitude and delay of participants’ control responses as a function of input perturbation frequency, we performed frequency (Bode) analyses. Specifically, we applied Fourier analysis to the time series of the joystick’s displacement (in percentage of maximum displacement) and the target position error (in degrees of visual angle) in each trial, computing the control-response amplitude (i.e., gain, in percentage of maximum degrees) and delay (i.e., phase lag, in degrees) by taking the ratio of the Fourier coefficients of the joystick’s displacement and the target position error at each input perturbation frequency. To examine whether action gamers and non–action gamers performed differently on the task, we conducted an independent-samples t test on each of these performance metrics.
Results
Participants’ typical control response was a scaled and delayed version of the input target-position error, with the response at the highest frequencies smoothed out (Fig. 2b). Figure 2c plots the mean RMS target position error for the two participant groups. As expected, the action gamers showed better precision in visuomotor control: The mean RMS target position error was smaller for the action gamers (M = 14.40°, SE = 0.39°) than for the non–action gamers (M = 17.17°, SE = 0.57°), t(26) = 3.86, p = .00068, Cohen’s d = 1.50.
Figure 2d plots the visuomotor-control gain and phase lag at each input perturbation frequency for the two groups. The decrease in gain and the steady increase in phase lag at high frequencies are typical characteristics of a low-pass operator with velocity controller dynamics in a closed-loop manual control task (Jagacinski & Flach, 2003; L. Li et al., 2005, 2006). Independent-samples t tests showed that the mean gain, averaged across input perturbation frequencies, was larger for the action gamers (M = 10.9 dB, SE = 0.61 dB) than for the non–action gamers (M = 8.70 dB, SE = 0.67 dB), t(26) = 2.34, p = .027, Cohen’s d = 0.88, and that the mean phase lag was smaller for the action gamers (M = 87.13°, SE = 2.13°) than for the non–action gamers (M = 96.98°, SE = 3.57°), t(26) = 2.11, p = .044, Cohen’s d = 0.80.
Experiment 3: Effects of a Driving Game
Participants
Twelve new non–action gamers were recruited and randomly assigned to two groups of 6 members each (3 males, 3 females): the action group (age range = 19–37 years, M = 24), who were trained to play a driving game, and the control group (age range = 19–24 years, M = 22), who were trained to play a nonaction simulation game. One participant in each group had a driver’s license. All participants had normal or corrected-to-normal vision, were students and staff at the University of Hong Kong, and provided informed consent in accordance with guidelines from the Human Research Ethics Committee of the university. Our sample size for this experiment (6 participants in each group) was determined as in Experiment 2.
Video-game training
Participants in the action group used a steering-wheel controller (Wii Wheel, Nintendo, Kyoto, Japan) to play Mario Kart (Nintendo, Kyoto, Japan), a fast-action driving game that involves steering a go-cart on various racing tracks. Participants in the control group used a mouse and a keyboard to play Roller Coaster Tycoon III (Atari, Sunnyvale, CA), a simulation and strategy game that involves building and maintaining amusement parks. These two games were similar in their visual scene complexity and in the ease with which non–action gamers could learn them.
The training consisted of playing the specified video game for 10 sessions, each lasting 1 hr. Participants completed 1 or 2 sessions per day and finished the training within 3 weeks. We used the 36-item Flow State Scale (Jackson & Marsh, 1996), which assesses the experience of absorption in the task at hand, to measure participants’ game engagement at the end of each session. To ensure smooth progression, we had participants start playing at the easiest level of their game. Participants in the action group had to reach the fourth rank of an eight-rank performance scale before they were allowed to advance to a more difficult level. Participants in the control group progressed automatically to increasingly complex situations. All participants played the video game on a large-screen display (110° × 94°), and were asked to play the initial stage of the game again at the end of the training so that we could assess the improvement of their gaming performance from the first training session to the end of the training. They were instructed not to play any video game at home during the course of the experiment.
Contrast-sensitivity measurement
Each participant’s contrast sensitivity was measured before any video-game training and on a separate day after the 10 hr of training was completed. The procedure was similar to that used by R. Li et al. (2009). Displays were presented on a linearized CRT monitor (1,280 × 1,024 pixels; 100-Hz refresh rate). Each trial contained two sequential 30-ms stimulus intervals. A vertically oriented Gabor patch (σ = λ) of one of five spatial frequencies (1.5, 3, 6, 9, or 12 cycles/degree) was displayed in one of the two intervals on a uniform gray background (17 cd/m2). The other interval contained no Gabor patch; only the uniform gray background was shown. At the viewing distance of 1.5 m, the monitor’s screen subtended a visual angle of 15° × 11°. Participants were asked to indicate which of the two stimulus intervals on each trial contained the Gabor patch. The interstimulus interval was 800 ms.
We used an adaptive staircase procedure (Kontsevich & Tyler, 1999) to determine the luminance contrast at which the Gabor patch was detected correctly 75% of the time. In each measurement session, two staircases (each containing 30 trials) were tested for each of the five spatial frequencies. The staircases for the different spatial frequencies were randomly interleaved. Participants completed 15 practice trials (3 trials × 5 spatial frequencies) before data collection started. The measurement session took about 30 min.
Measuring visuomotor control
All participants performed the same visuomotor-control task used in Experiment 2 during three test sessions: on the same day before they started the first training session (pretest) and on non-training days after completing 5 hr of play (mid-test) and 10 hr of play (posttest). The mid-test and posttest were on non-training days in order to remove any immediate effect of gaming on performance. In each test session, participants completed two practice trials and then six experimental trials. The sessions lasted about 20 min each.
Data analysis
To compare the level of game engagement in the action and the control groups, we conducted a 2 (participant group) × 10 (training session) mixed-design analysis of variance (ANOVA) on the Flow State Scale scores. To examine the effects of video-game play on visuomotor control, we conducted a 2 (participant group) × 3 (test session) mixed-design ANOVA on each of the visuomotor-control performance metrics examined in Experiment 2. As none of the variables in the ANOVA had more than three levels, we used Fisher’s least significant difference for the post hoc tests. To compare contrast sensitivity before and after video-game play, we conducted a 2 (test session) × 5 (spatial frequency) repeated measures ANOVA for each group.
Results
Across the action and control groups combined, the level of game engagement increased over time, F(9, 90) = 3.72, p = .00053, η2 = .27, and there was no significant difference in game engagement between the two groups. Both groups also improved their gaming performance by the end of the training. For the action group, the mean ranking of performance on the initial level of the game (50cc Mushroom Cup) increased by 227% (SD = 110%) from the first training session to the end of the training. For the control group, the mean scores for two major performance indices (the number of guests and parking rating) for the initial game scenario (Vanilla Hills) increased by 94% (SD = 43%) and 86% (SD = 43%), respectively, from the first training session to the end of the training.
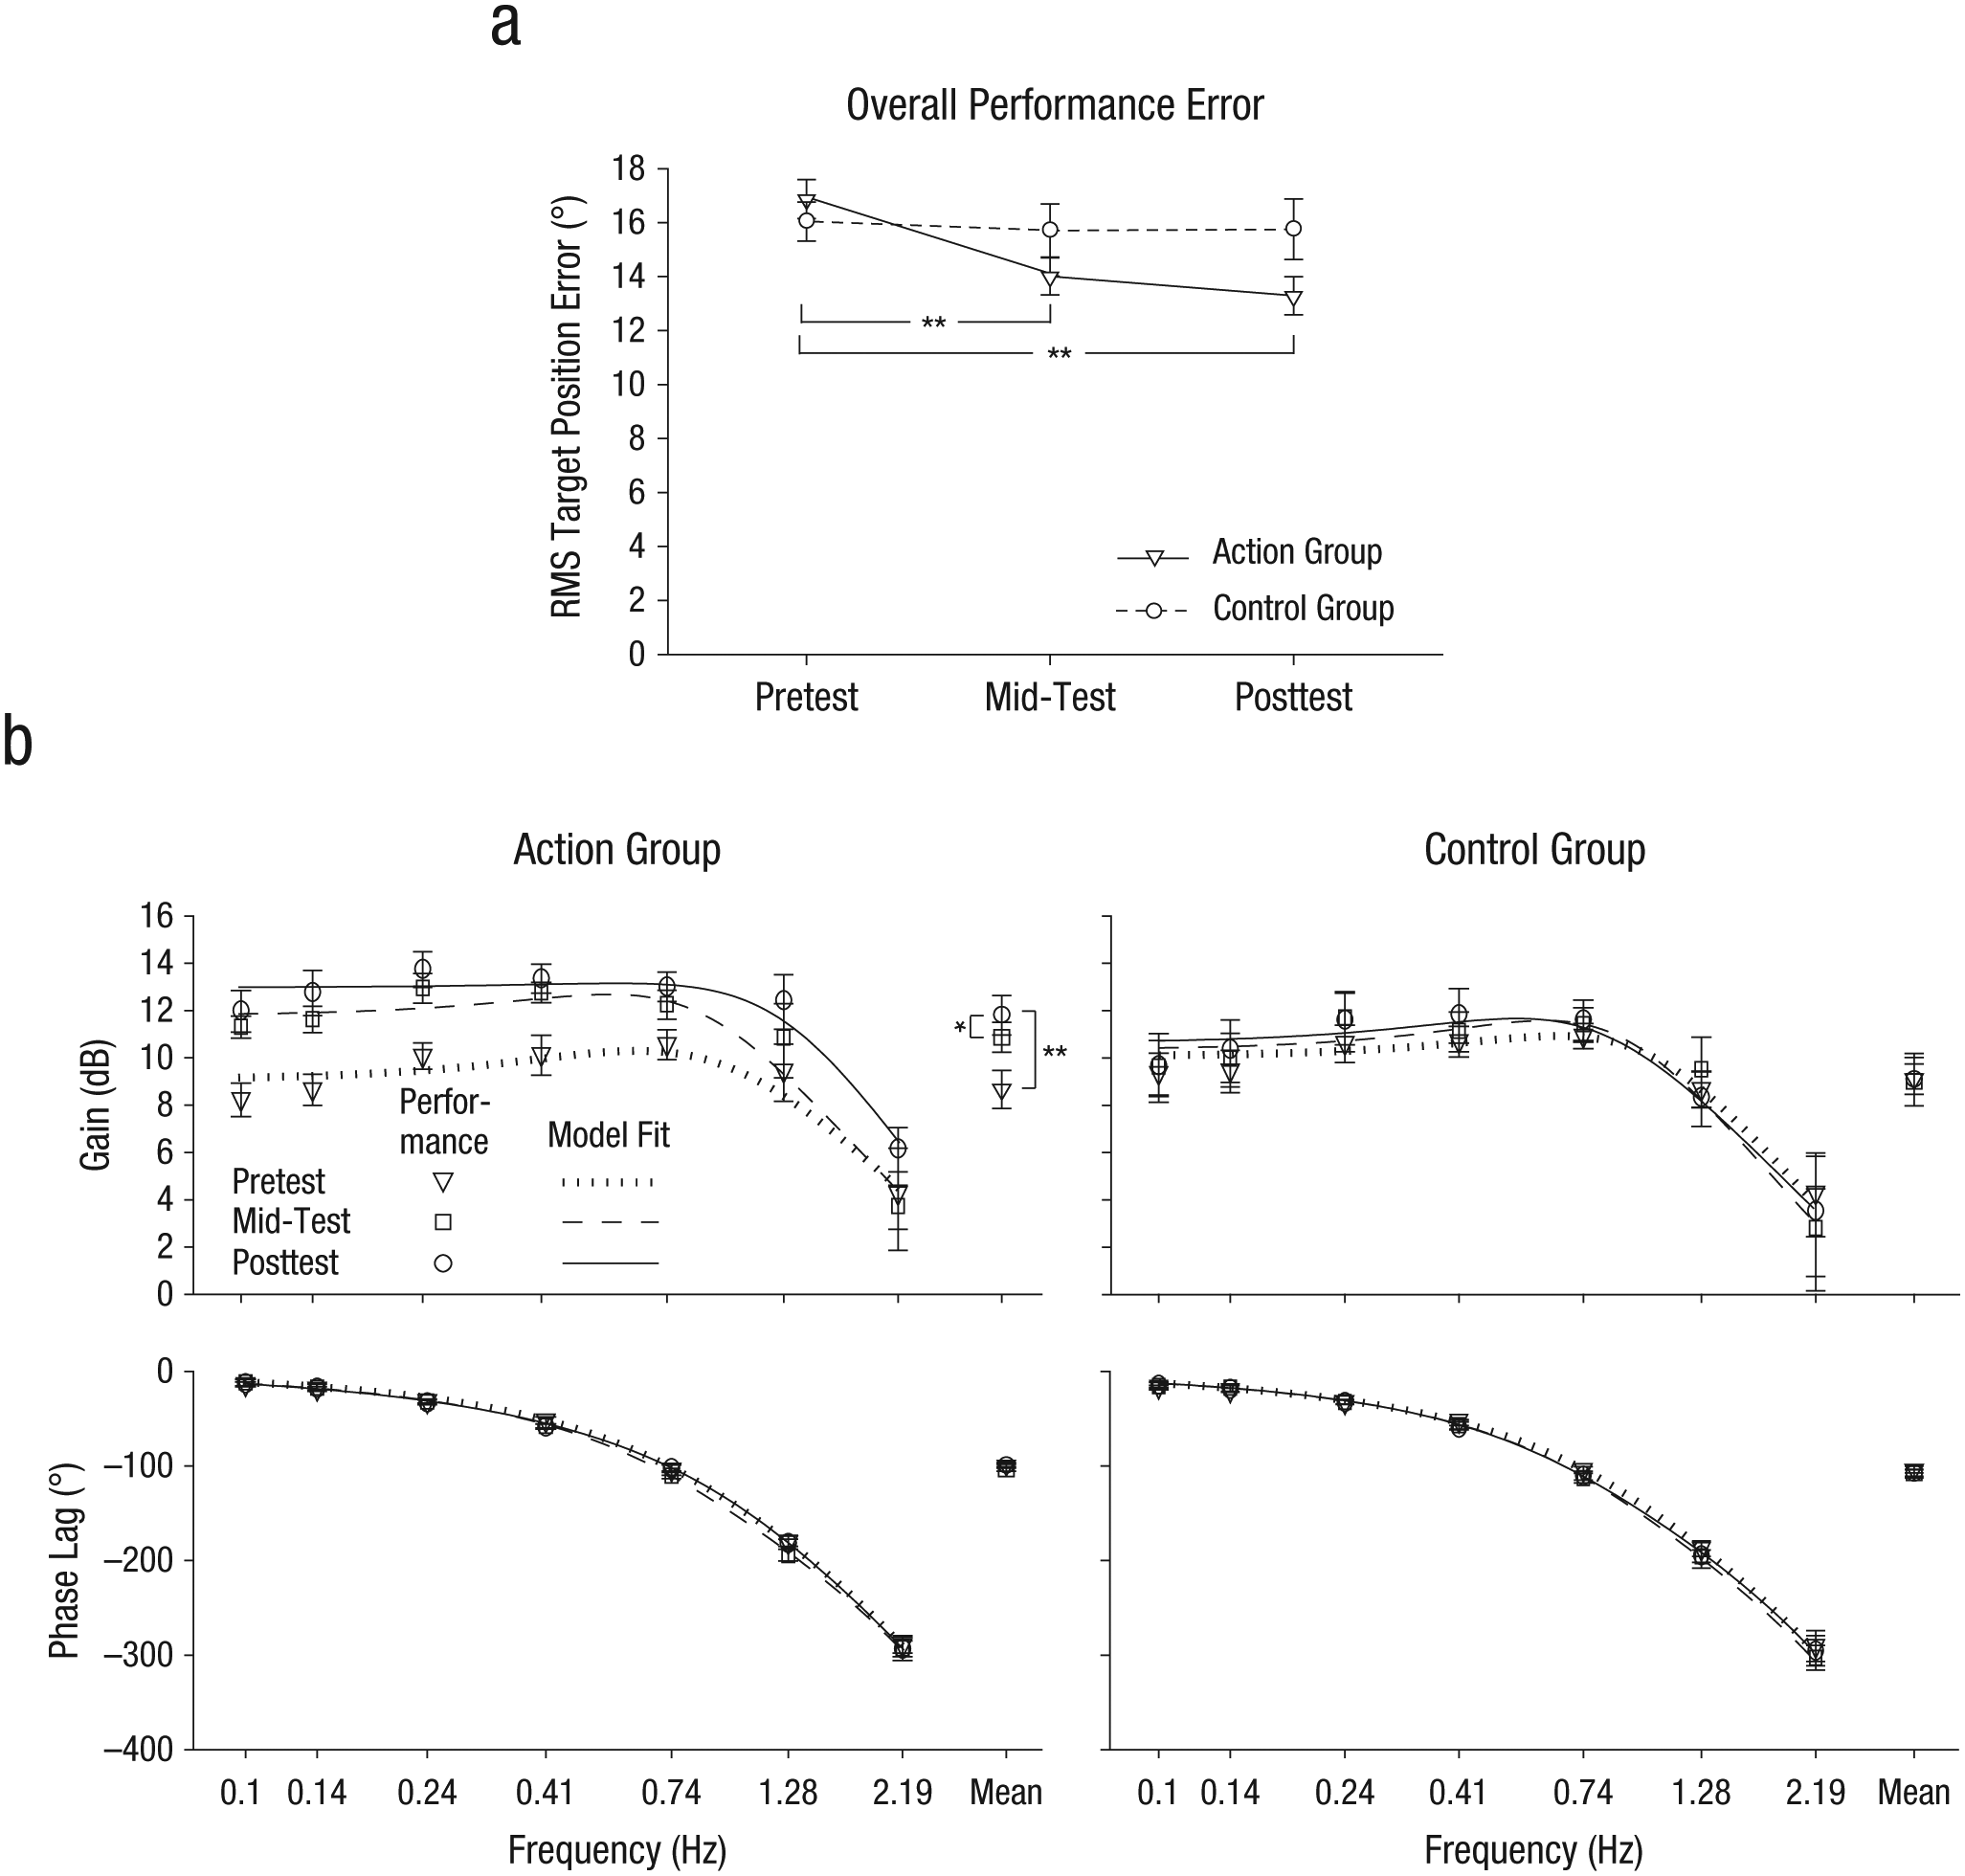
Figure 3a plots the mean RMS target position error at each test session for the action and the control groups. A 2 (participant group) × 3 (test session) mixed-design ANOVA on RMS error revealed both a significant main effect of test session, F(2, 20) = 19.66, p = .000019, η2 = .66, and a significant interaction of participant group and test session, F(2, 20) = 4.83, p = .02, η2 = .33. Whereas the action group’s mean RMS target position error decreased by 13% after 5 hr of play (p = .00022) and by 19% after 10 hr of play (p = .000003), compared with the group’s baseline performance (in the pretest session), the control group’s mean RMS target position error did not decrease significantly after 5 or 10 hr of play.

Participants’ performance on the visuomotor-control task in Experiment 3: (a) mean root-mean-square (RMS) target position error at each test session for the two participant groups (n = 6 per group) and (b) mean gain (top) and mean phase lag (bottom) at each test session for the action (left) and control (right) groups as a function of input perturbation frequency (the group means averaged across frequency are plotted at the far right in each graph). Error bars indicate ±1 SE (note that some error bars are smaller than the data symbols). The solid, dashed, and dotted curves represent the best-fitting simulations of the crossover model. Asterisks indicate significant differences (a) between sessions in the action group and (b) between session means (*p < .05, **p < .001).
Figure 3b plots the visuomotor-control gain and phase lag at each input perturbation frequency for the three test sessions for the action and control groups. The mixed-design ANOVA on the mean response gain averaged across the seven input perturbation frequencies revealed both a significant main effect of test session, F(2, 20) = 5.89, p = .0097, η2 = .37, and a significant interaction of participant group and test session, F(2, 20) = 7.02, p = .0049, η2 = .41. Whereas the action group’s mean response gain increased by 24% after 5 hr of play (p = .0012) and by 30% after 10 hr of play (p = .00011), compared with the group’s baseline (pretest) performance, the control group’s mean response gain did not increase significantly after 5 or 10 hr of play. Neither group’s overall phase lag was affected by video-game training.
We were able to call back and retest 5 of the 6 participants in the action group 70 to 126 days after their completion of the 10-hr training (see Fig. 4). At the follow-up test, these 5 participants maintained both their reduced RMS target position error, F(2, 8) = 27.88, p = .00025, η2 = .87, and their increased mean response gain, F(2, 8) = 7.02, p = .017, η2 = .64.

Visuomotor control of the action group in Experiment 3 at the pretest, posttest, and follow-up test: root-mean-square target position error (upper left), response gain (upper right), and phase lag (bottom). For each test, the mean for each of the 5 participants who participated in the follow-up is shown, with the mean averaged across the 5 participants plotted at the right (filled circle). Error bars indicate ±1 SE. Asterisks indicate significant differences between tests (*p < .05, **p < .001).
As expected, both the action and the control groups showed decreasing contrast sensitivity (i.e., higher contrast luminance level) with increasing spatial frequency, F(4, 20) = 618.77, p < .0001, η2 = .99, and F(4, 20) = 523.41, p < .0001, η2 = .99, respectively. However, there was no significant difference between pretraining and posttraining contrast sensitivity for either group.
Experiment 4: Effects of an FPS Game
Participants
Sixteen new non–action gamers were recruited and assigned to two groups of 8 members each (2 males, 6 females): the action group (age range = 20–43 years, M = 24), who were trained to play an FPS game, and the control group (age range = 19–29 years, M = 23), who were trained to play a nonaction simulation game. One participant in each group had a driver’s license. All participants had normal or corrected-to-normal vision, were students and staff at the University of Hong Kong, and provided informed consent in accordance with guidelines from the Human Research Ethics Committee of the university. Our minimum sample size for this experiment was determined on the basis of both previous studies (L. Li et al., 2011; L. Li et al., 2005, 2006) and Experiment 3, which showed that a sample size of 6 participants in each group provides sufficient power to evaluate visuomotor control.
Video-game training
Participants in the action group used a mouse and a keyboard to play the Death Match mode of Unreal Tournament 2004 (Atari, Sunnyvale, CA), an FPS game that requires players to shoot and terminate as many computer-generated enemies as possible while minimizing their own risk of being shot. Participants in the control group used a mouse and a keyboard to play The Sims 2 (Electronic Arts, Redwood City, CA), a life-simulation and strategy game that involves managing game characters’ daily activities to develop their careers and relationships and build families. These two games were similar in their levels of visual scene complexity and in the ease with which non–action gamers could learn them. Participants in the action group had to achieve twice as many kills of enemies as deaths of themselves before they were allowed to advance to a more difficult level. Participants in the control group progressed automatically to increasingly complex situations. In all other respects, the experimental procedures were the same as in Experiment 3, as were the data-analysis procedures.
Results
As in Experiment 3, across the action and the control groups combined, the level of game engagement increased over time, F(9, 126) = 3.61, p = .001, η2 = .21, and there was no significant difference in game engagement between the two groups. Both groups also improved their gaming performance by the end of training. The action group’s mean skill level, measured as (kills – deaths)/(kills + deaths), increased by 82% (SD = 77%) from the first training session to the end of the training. The control group’s performance, measured as the accumulated wealth of the family controlled by the player, increased quadratically with training session (r2 = .93).
Figure 5a plots the mean RMS target position error at each test session for the action and the control groups. The mixed-design ANOVA on RMS target position error revealed both a significant main effect of test session, F(2, 28) = 13.68, p = .000072, η2 = .49, and a significant interaction between participant group and test session, F(2, 28) = 9.52, p = .0007, η2 = .4. Whereas the action group’s mean RMS error decreased by 17% after 5 hr of play (p = .00002) and by 21% after 10 hr of play (p = .000001), compared with the group’s baseline performance (pretest session), the control group’s mean RMS error was not significantly reduced after 5 or 10 hr of play.
Participants’ performance on the visuomotor-control task in Experiment 4: (a) mean root-mean-square (RMS) target position error at each test session for the two participant groups (n = 8 per group) and (b) mean gain (top) and mean phase lag (bottom) at each test session for the action (left) and the control (right) groups as a function of input perturbation frequency (the group means averaged across frequency are plotted at the far right in each graph). Error bars indicate ±1 SE (note that some error bars are smaller than the data symbols). The solid, dashed, and dotted curves represent the best-fitting simulations of the crossover model. Asterisks indicate significant differences (a) between sessions in the action group and (b) between session means (*p < .05, **p < .001).
Figure 5b plots the visuomotor-control gain and phase lag at each input perturbation frequency for the three test sessions for the action and the control groups. The mixed-design ANOVA on the mean response gain averaged across the seven input perturbation frequencies revealed both a significant main effect of test session, F(2, 28) = 4.08, p = .028, η2 = .23, and a significant interaction between participant group and test session, F(2, 28) = 4.37, p = .022, η2 = .24. Whereas the action group’s mean response gain increased by 26% after 5 hr of play (p = .0088) and by 36% after 10 hr of play (p = .00042), compared with the group’s baseline (pretest) performance, the control group’s mean response gain did not increase significantly after 5 or 10 hr of play. Neither group’s overall phase lag was affected by video-game training.
Results for contrast sensitivity were similar to those in Experiment 3. That is, both the action and the control groups showed decreasing contrast sensitivity as spatial frequency increased, F(4, 28) = 255.74, p < .0001, η2 = .97, and F(4, 28) = 228.94, p < .0001, η2 = .97, respectively, and there was no significant difference between pre- and posttraining contrast sensitivity for either group.
Modeling
The performance metrics we used (RMS error, gain, and phase lag) assessed participants’ overall control performance as well as their control responses to specific input perturbation frequencies. These measurements, however, could not reveal the effects of playing different types of action video games on the sensorimotor system underlying visuomotor control. To examine these effects, we fitted the crossover model (McRuer et al., 1965; McRuer & Krendel, 1959) to participants’ performance data from the visuomotor-control task in Experiments 3 and 4. As Figure 6a shows, performance on this task can be modeled by applying a human operator transfer function, Yp, and controller dynamics, Yc, to input target perturbation and position error.
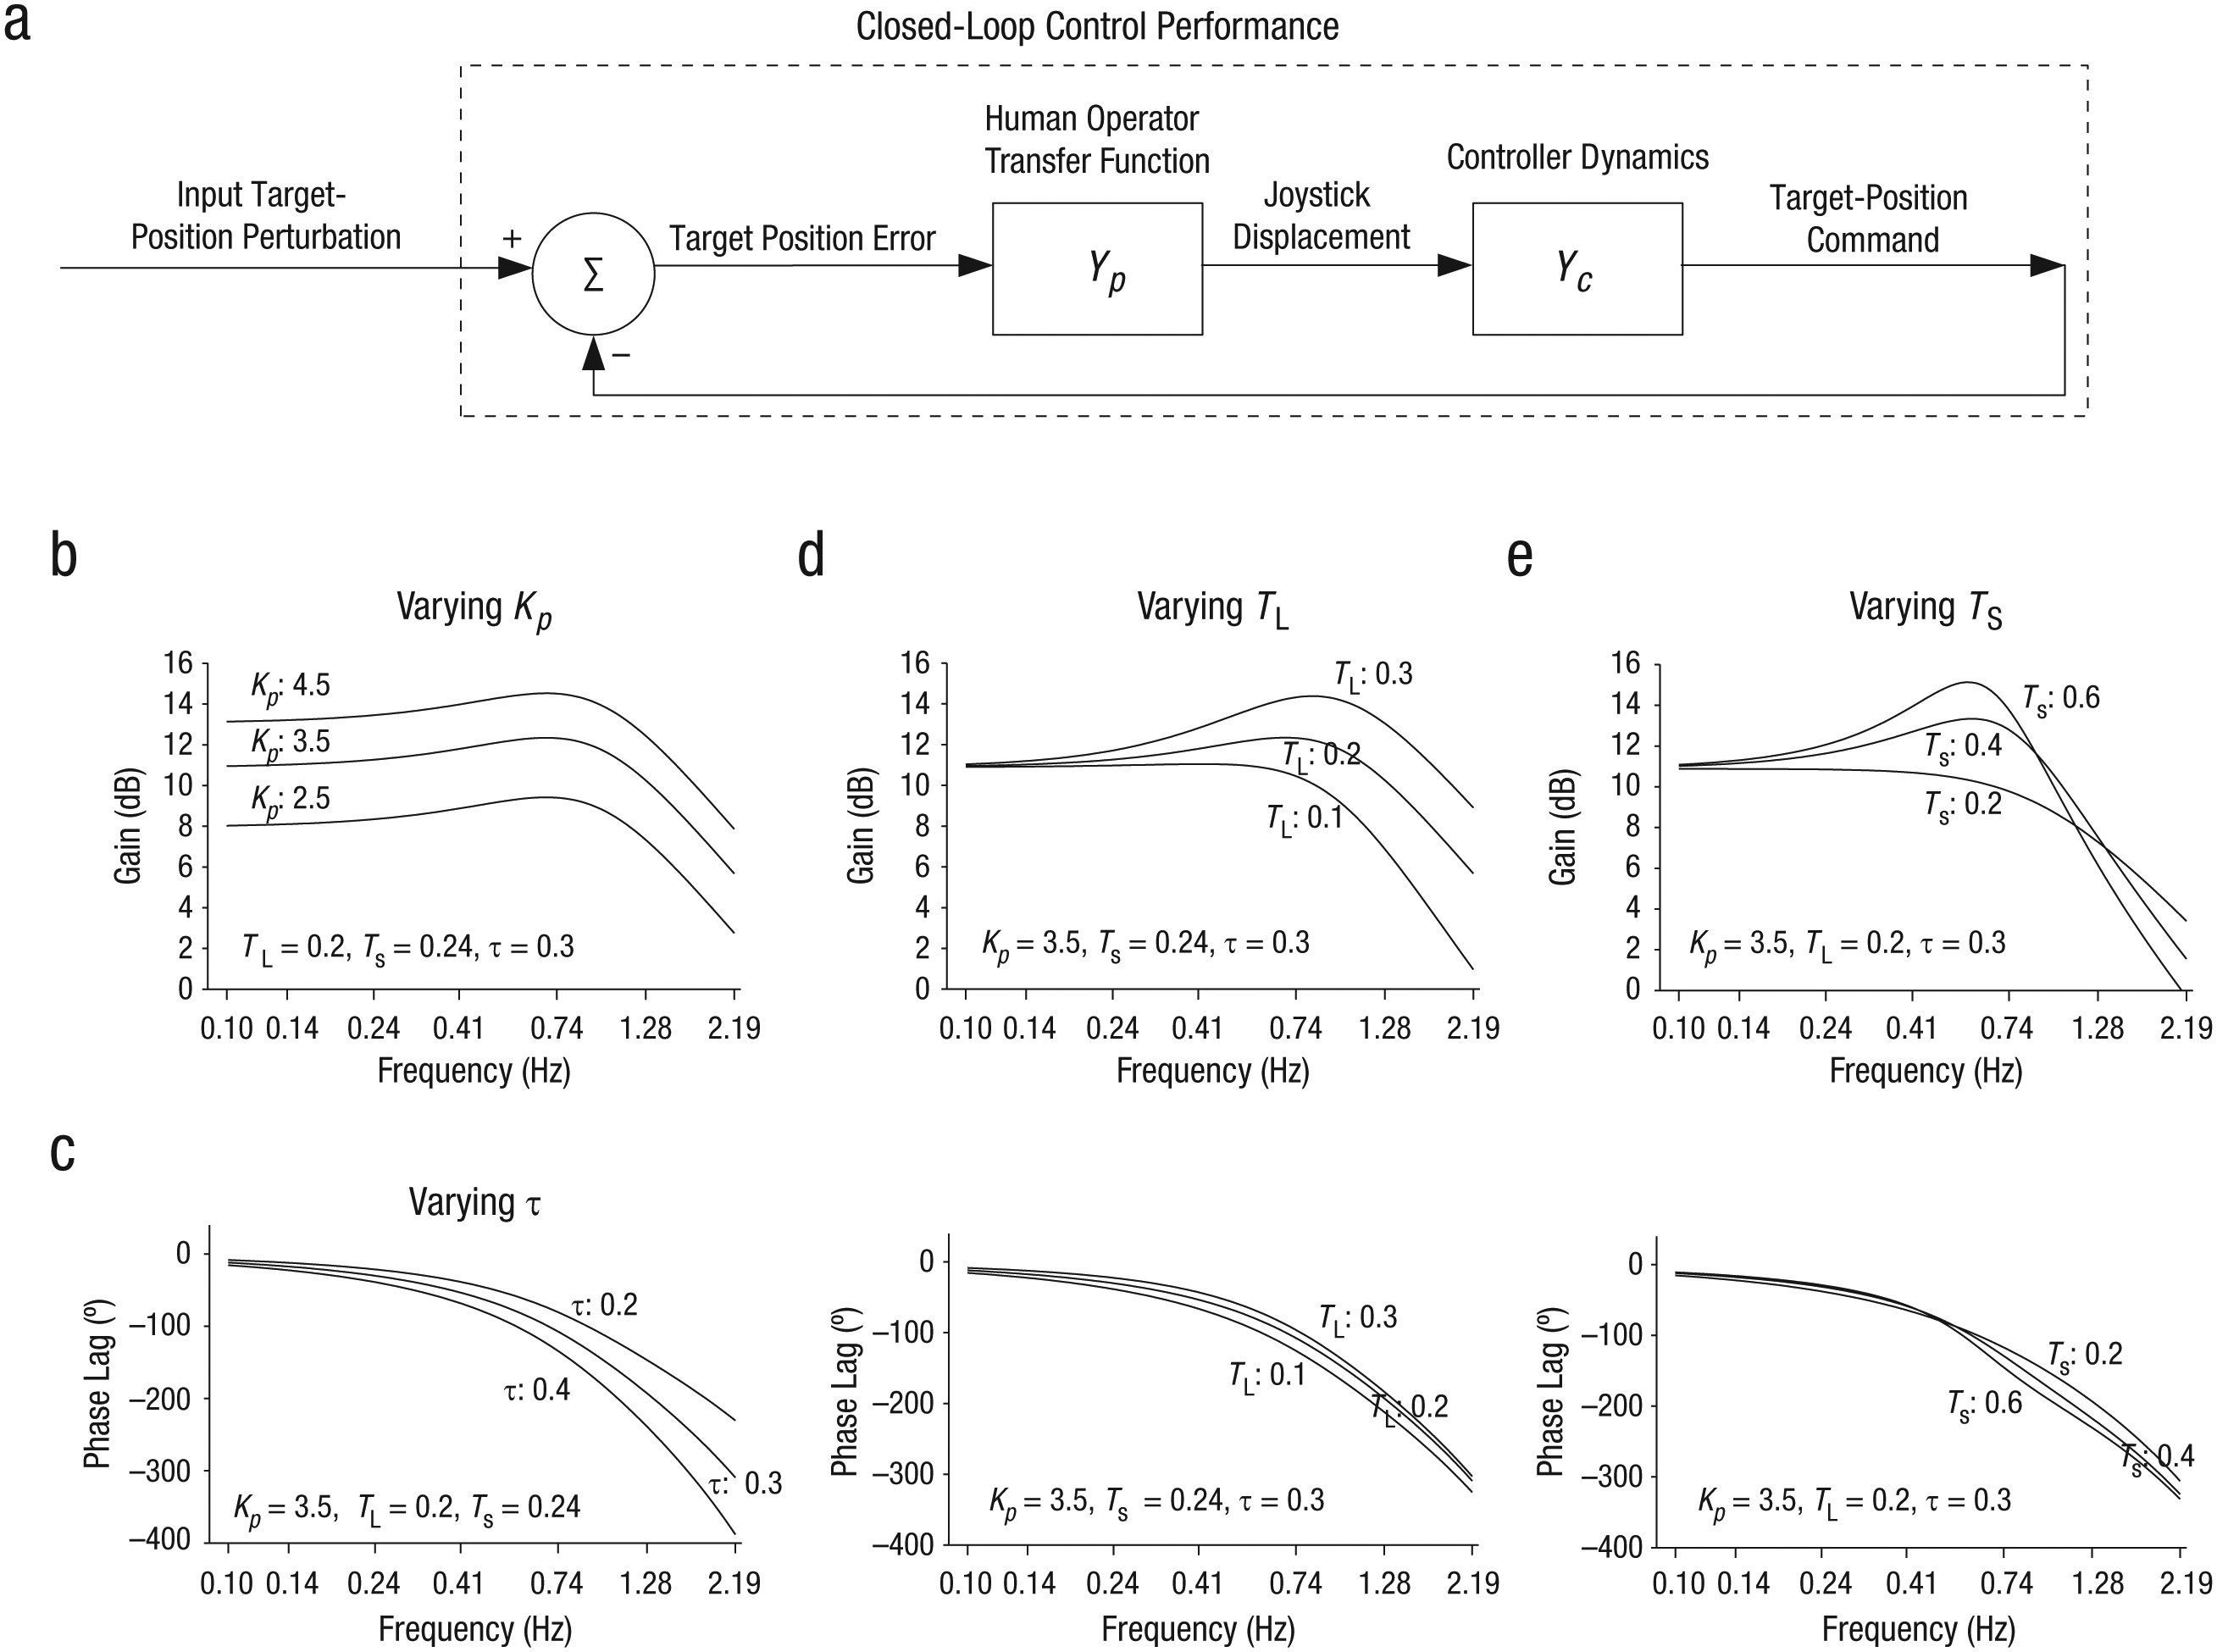
Simplified block diagram of the closed-loop visuomotor-control task and illustration of the effects of varying parameters in the crossover model. In this task (a), the human operator transfer function, Yp, which captures the participant’s control performance, and the controller dynamics function, Yc, which specifies the dynamics of joystick control, are applied to target position error. The output is a target position command. The graphs are frequency response (Bode) plots depicting effects of varying (b) gain (Kp), (c) reaction time (τ), (d) the lead time constant (TL), and (e) the system time constant (TS) in the crossover model on control performance.
The crossover model is a quasilinear dynamic model that can successfully describe and predict individuals’ performance in a variety of closed-loop visuomotor-control tasks, such as driving and piloting aircraft (e.g., Anderson, 1970; Hess, 1977; McRuer, 1980; McRuer & Klein, 1975). We have previously applied a modified version of the crossover model to examine visual cues used in the active control of object motion (L. Li et al., 2005, 2006) and self-motion (L. Li et al., 2011). In the crossover model, the human operator transfer function (Yp in Fig. 6a) is given by

where Kp represents the overall gain in control compensation and thus indicates the responsiveness of the sensorimotor system to the input error signal, τ represents reaction time (i.e., the time it takes for the sensorimotor system to process the input error signal and generate a control command), and TL represents a lead time constant indicating the extent to which the sensorimotor system can make sensory predictions of the effects of the current control actions (see Wolpert, Ghahramani, & Jordan, 1995) to anticipate input error signals and generate control responses ahead of time.
In this model, the neuromuscular system of the human operator and the physical properties of the controller (the joystick) are lumped together to form a second-order low-pass filter, which is given by

where ξ
n
, is a damping ratio, ω
n
is an undamped natural frequency, and s is the Laplace transform variable. Because the joystick’s displacement was proportional to the target’s movement velocity in the visuomotor-control task, the controller dynamics (Yc in Fig. 6a) was implemented as

The smaller the system time constant, the more stable the neuromuscular system is.
The crossover model allowed us to perform a quantitative evaluation of the effects of action gaming on the sensorimotor system underlying visuomotor control. The overall gain (Kp), the reaction time (τ), and the lead time constant (TL) capture the visual-stimulus-dependent (i.e., perception-dependent) characteristics of visuomotor control. In contrast, the system time constant (TS) captures the visual-stimulus-independent (i.e., perception-independent) characteristics of the neuromuscular system. Figures 6b through 6e illustrate how varying Kp, τ, TL, and TS in the crossover model affects gain and phase lag as a function of input perturbation frequency. Specifically, increasing Kp while keeping the other parameters constant causes an overall increase in gain (Fig. 6b), increasing τ causes an increase in phase lag in the high-frequency range (Fig. 6c), increasing TL causes an increase in gain but a slight decrease in phase lag in the high-frequency range (Fig. 6d), and increasing TS (which corresponds to decreasing the stability of the neuromuscular system) could cause an increase in both gain and phase lag, mostly at the undamped natural frequency of the neuromuscular system where the peak in gain occurs (Fig. 6e). The effect of action gaming on control performance could be due to a change in any of these model parameters.
Model parameters were determined by a best fit to the control performance data using a weighted (by variance) iterative least squares procedure (i.e., χ2 fit; see Sweet, Kaiser, & Davis, 2003, for details). For each participant in each of the three test sessions of Experiments 3 and 4, there were five model parameter values to fit 14 data points. Because the maximum TL is 5 s for human operators (Sweet et al., 2003), ξ n was limited to the range from 0 to 3.1, so that TL would not exceed 5 s. The fitted curves in Figures 3b and 5b show that the model accurately described the averaged control performance. Table 2 summarizes three measures of the goodness of model fits for the action and the control groups in these experiments: the range of the correlations between the model estimates and performance data, the percentage of variance explained, and the reduced χ2. The crossover model had close fits, explaining 96.83% to 99.98% of the variance of the performance data.
Goodness of Model Fit for the Action and the Control Groups in Experiments 3 and 4: Correlations Between the Model Estimates and the Performance Data, Percentage of Variance Explained, and Reduced χ2

Note: FPS = first-person-shooter.
Effects of the driving game
The upper row in Figure 7 plots the mean fitted parameters for the action and the control groups in Experiment 3 as a function of test session. A 2 (participant group) × 3 (test session) mixed-design ANOVA was conducted on each of the three fitted model parameters (Kp, τ, and TL) and on the lumped model parameter (TS). For Kp, there were both a significant main effect of test session, F(2, 20) = 6.28, p = .0076, η2 = .39, and a significant interaction of participant group and test session, F(2, 20) = 7.57, p = .0036, η2 = .43. Whereas Kp for the action group increased by 38% after 5 hr of play (p = .0005) and by 43% after 10 hr of play (p = .00011), for the control group, there was no significant change in Kp after 5 or 10 hr of play. No significant effects were found for the other three parameters (τ, TL, and TS). These results indicate that although playing a driving video game for as little as 5 hr improves the responsiveness of the sensorimotor system to the input visual error, it does not have much effect on reaction time, ability to anticipate input error to generate lead control, or stability of the neuromuscular system even after 10 hr of play.
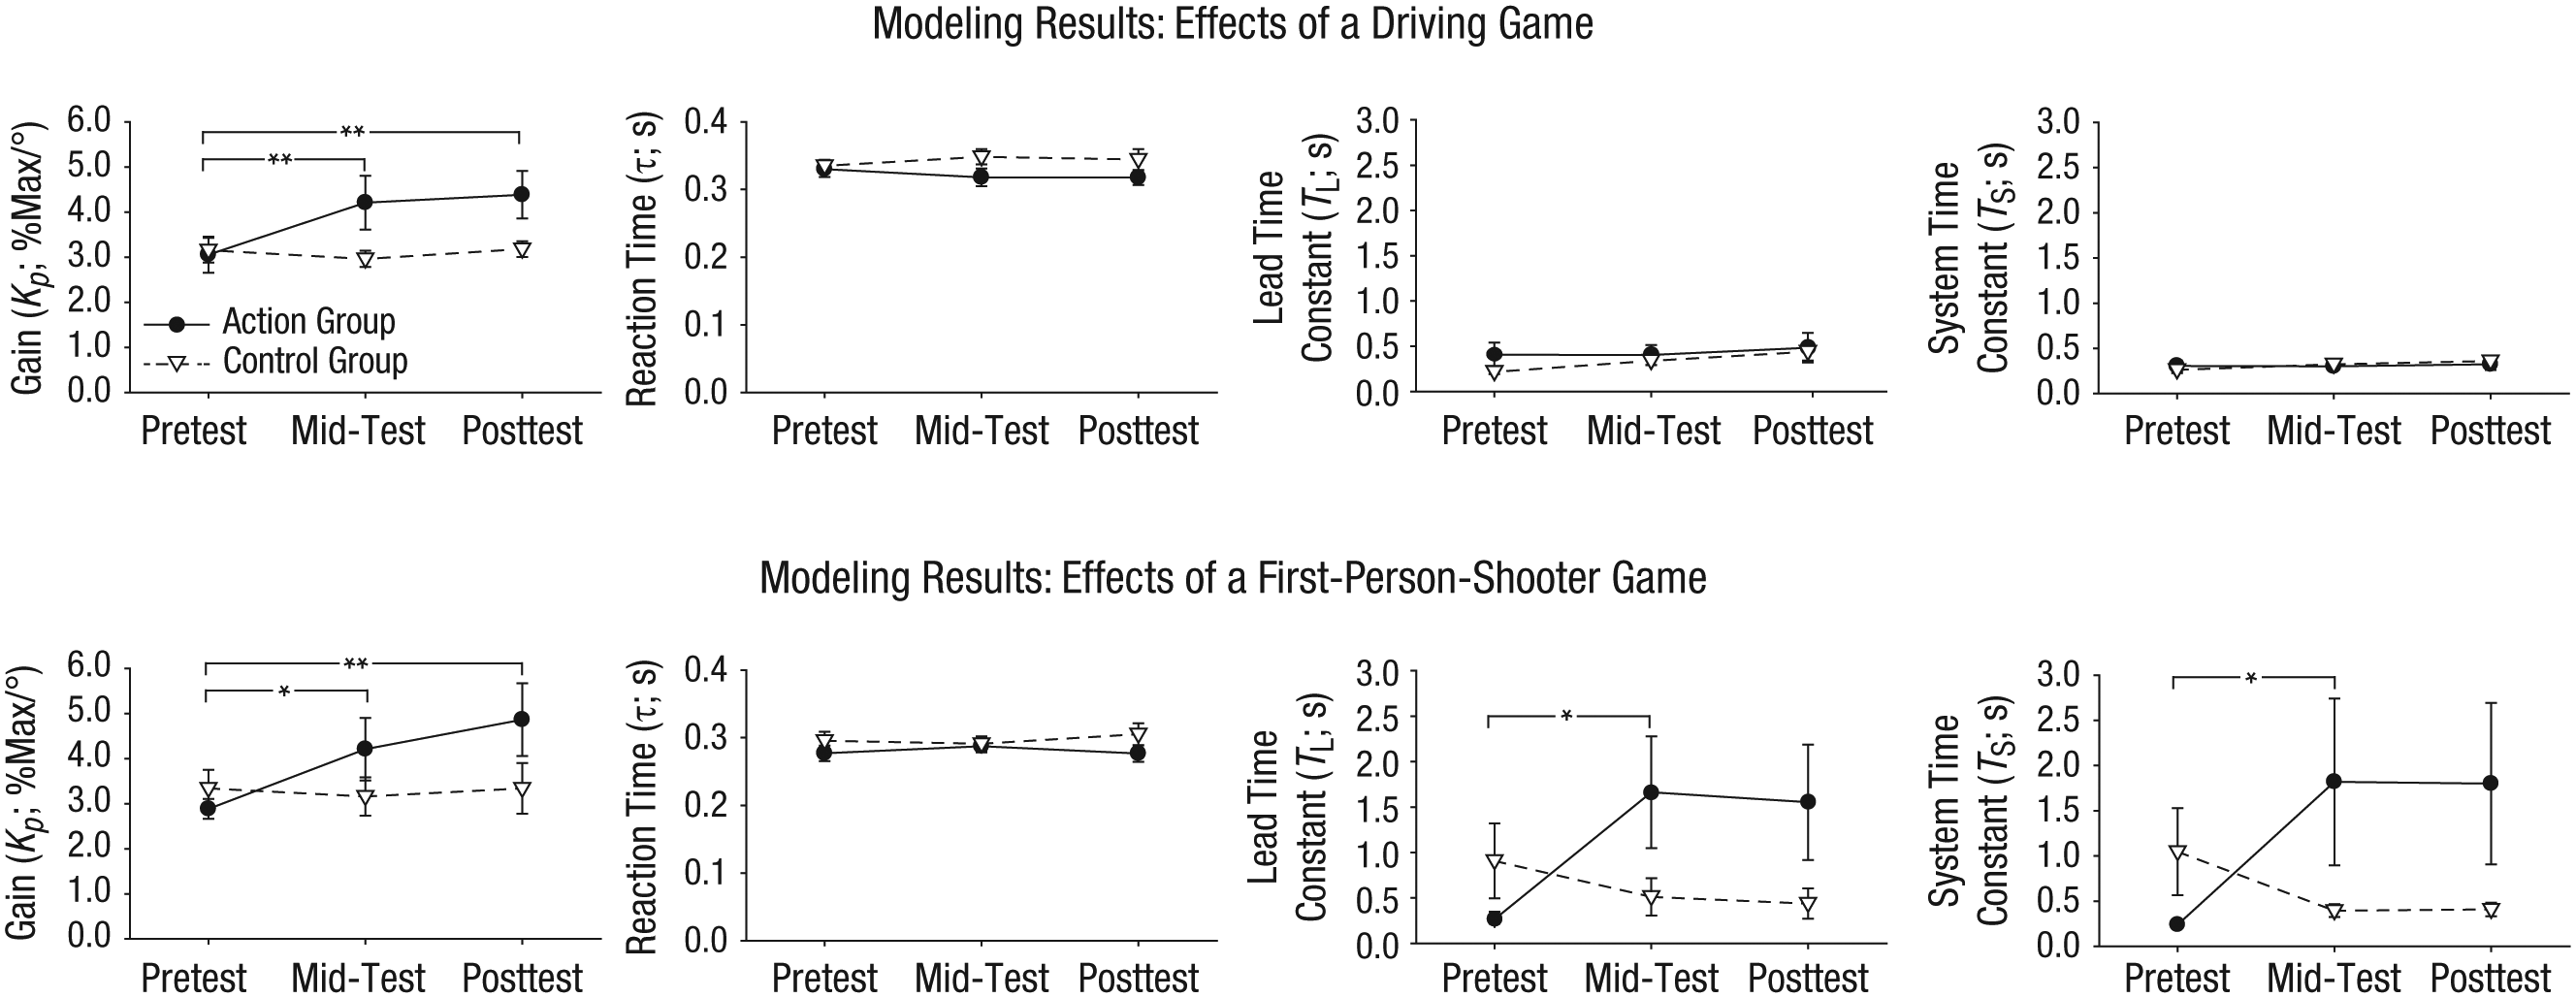
Modeling results for visuomotor control: best-fitting estimates for gain (Kp), reaction time (τ), lead time constant (TL), and system time constant (TS) as a function of test session and participant group (action or control). Results are shown separately for Experiment 3 (top row; n = 6 per group) and Experiment 4 (bottom row; n = 8 per group). Error bars indicate ±1 SE (note that some of the error bars are smaller than the data symbols). Asterisks indicate significant differences between test sessions in the action group (*p < .05, **p < .001).
Effects of the FPS game
The lower row in Figure 7 plots the mean fitted parameters for the action and the control groups in Experiment 4 as a function of test session. Again, a 2 (participant group) × 3 (test session) mixed-design ANOVA was conducted on each of the three fitted model parameters (Kp, τ, and TL) and on the lumped model parameter (TS). For Kp, these were both a significant main effect of test session, F(2, 28) = 4.23, p = .025, η2 = .23, and a significant interaction of participant group and test session, F(2, 28) = 4.58, p = .019, η2 = .25. Whereas Kp for the action group increased by 46% after 5 hr of play (p = .01) and by 69% after 10 hr of play (p = .00033), for the control group, there was no significant change in Kp after 5 or 10 hr of play. No significant effect was found for τ. For TL, only the interaction of participant group and test session was significant, F(2, 28) = 4.50, p = .02, η2 = .24. TL for the action group increased by 527% after 5 hr of play (p = .0073), but did not improve further after 10 hr of play. For the control group, there was no significant change in TL after 5 or 10 hr of play. For TS, again, only the interaction of participant group and test session was significant, F(2, 28) = 4.41, p = .022, η2 = .24. TS for the action group increased by 661% after 5 hr of play (p = .015) but did not increase further after 10 hr of play. For the control group, there was no significant change in TS after 5 or 10 hr of play.
These results indicate that playing an FPS video game for as little as 5 hr improves not only the responsiveness of the sensorimotor system but also its ability to anticipate input error in order to generate lead control. However, this improvement in anticipation is accompanied by a decrease in the stability of the neuromuscular system.
Discussion
In this study, we first examined lane keeping in people who did and did not frequently play action video games and found that the action gamers performed better: Their precision error was 57% smaller, their response amplitude was 24% larger, and their response delay was 29% shorter (Experiment 1). As lane keeping involves using locomotion-control strategies (see L. Li & Chen, 2010, for a review) in addition to essential closed-loop visuomotor-control skills, we developed a visuomotor-control task to specifically examine visuomotor control underlying driving in action gamers. We found that action gamers indeed had superior performance on the visuomotor-control task compared with non–action gamers: Their precision error was 16% smaller, their response amplitude was 25% larger, and their response delay was 10% shorter (Experiment 2).
To establish a causal relationship between action gaming and the improvement in visuomotor control, we recruited non–action gamers and randomly assigned them to play an action video game (action group) or a nonaction simulation video game (control group). We tested two types of action video games frequently used in previous studies, a driving game (Experiment 3) and an FPS game (Experiment 4). In both experiments, the action and the control groups showed similar game engagement during play, and both groups improved their gaming performance. Nevertheless, on the visuomotor-control task in Experiment 3, although the action group showed a 13% improvement in control precision and a 24% increase in response amplitude after as little as 5 hr of play, the control group did not show any improvement in visuomotor control even after 10 hr of play. Despite the small sample size (6 participants in each group), the effect sizes of the observed improvements were large (η2s ≥ .33), and these improvements lasted for at least 2 to 4 months.
In Experiment 3, participants in the action group used a steering-wheel controller to play the driving video game, whereas participants in the control group used a mouse and a keyboard to play the simulation video game. One could argue that the action group’s improved performance on the visuomotor-control task could have been due to the similarity between the steering wheel and the joystick controllers, despite the fact that they had different controller dynamics. One could also argue that compared with other types of action video games, the driving game had more in common with the visuomotor-control task. To eliminate these alternative explanations of the results, in Experiment 4, we tested the effects of an FPS video game that bears little similarity to the visuomotor-control task. In addition, participants in both the action and the control groups used a mouse and a keyboard to play the assigned video game. Again, the action group showed a 17% improvement in control precision and a 26% increase in response amplitude of visuomotor control after only 5 hr of play, and the control group did not show any improvement in visuomotor control. The sample size in Experiment 4 was also relatively small (8 participants in each group), yet the effect sizes of the observed improvements remained large (η2s ≥ .24).
Modeling the performance data with the crossover model allowed us to examine how action gaming affects the sensorimotor system underlying visuomotor control. The modeling results show that playing either a driving or an FPS video game for as little as 5 hr improves the responsiveness of the sensorimotor system to the input error signal. Playing an FPS video game also improves the ability of the sensorimotor system to anticipate the input error in order to generate lead control. However, although playing a driving video game for 5 or 10 hr did not affect the stability of the neuromuscular system, playing an FPS video game for 5 hr decreased its stability. We conclude that different types of action video games have both common and different effects on the sensorimotor system, according to their shared and differentiating features. For example, both driving and FPS video games contain high-speed moving objects and require players to make timely precise responses, which can lead to an increase in the sensorimotor system’s responsiveness to the input error signal. However, whereas driving video games require players to race as fast as possible while keeping the vehicle within the boundary of the winding roads, FPS video games require players to constantly make predictions about both where and when bullets will most likely hit (Green & Bavelier, 2012). As a consequence, training non–action gamers with an FPS video game also improves their ability to predict the input error signal and generate lead control.
The results of Experiments 1 and 2 show that compared with non–action gamers, people who had frequently played action video games had shorter response delays on both the lane-keeping and visuomotor-control tasks. This is consistent with previous research findings showing that video-game players have faster reaction times than nonplayers when performing simple visuomotor-control tasks (Bialystok, 2006; Orosy-Fildes & Allan, 1989; Yuji, 1996). However, we did not find that playing action games reduced response delay in the two training experiments. One reason is that we trained non–action gamers to play an action video game up a maximum of 10 hr, whereas action gamers in Experiments 1 and 2 had played a minimum of 5 hr per week for at least 6 months. A reduction in reaction time in visuomotor control might require much more than 10 hr of action gaming. Still, the findings of the current study clearly show that playing an action video game for as little as 5 hr improves the precision and response amplitude of visuomotor control. To the best of our knowledge, the current study provides the first empirical evidence for a causal link between action gaming and enhancement in visuomotor control.
R. Li et al. (2009) reported that playing an FPS video game for 50 hr improves contrast sensitivity in non–action gamers. In the current study, the measured contrast sensitivity of non–action gamers before and after 10 hr of play was similar in both Experiment 3 and Experiment 4. This indicates that action gaming can improve visuomotor control without affecting basic visual functions, such as contrast sensitivity. We propose that the improvement in visuomotor control caused by action gaming happens at a higher level related to the sensorimotor system’s efficiency in processing visual information for motor control. This is consistent with the proposal that playing action video games does not alter the quality of input sensory information but rather exercises the brain such that each stage of perceptual processing makes better use of the information from earlier stages (Bavelier et al., 2012).
To verify that our visuomotor-control task effectively tested visuomotor control underlying daily driving tasks, such as lane keeping, we conducted an extra experiment in which we trained participants with our visuomotor-control task and measured their lane-keeping performance before and after the training (see the Supplemental Material available online). We found that training participants for 40 min improved their control precision, response amplitude, and response delay in the lane-keeping task; in contrast, no improvement was observed for participants without such training. Also, the overall performance improvement in the visuomotor-control task during training was highly correlated with the improvement in lane keeping from the pre- to the posttest session (see Fig. S1 in the Supplemental Material). In a previous study in which hemianopic patients performed the same visuomotor-control task, we found that these patients displayed impaired control performance that mirrored their real-world driving disabilities (Niehorster, Peli, Haun, & Li, 2013).
Combined with these results, the findings of the current study support the claim that easily accessible action video games can be cost-effective training tools to help people improve their essential visuomotor-control skills used for driving. The differing effects of driving and FPS video games on the sensorimotor system underlying visuomotor control suggest that for experienced drivers, who have stable control but need to improve their ability to predict input error signals, training with FPS rather than driving video games is more effective. In contrast, for novice drivers, who are still struggling with obtaining stable control, training with driving rather than FPS video games is more helpful.
Footnotes
Acknowledgements
We thank Dorion Liston, Terry Au, and three anonymous reviewers for their helpful comments on a previous draft of this manuscript.
Action Editor
Alice J. O’Toole served as action editor for this article.
Declaration of Conflicting Interests
The authors declared that they had no conflicts of interest with respect to their authorship or the publication of this article.
Funding
This study was supported by two grants from the Research Grants Council of Hong Kong (HKU7482/12H and HKU 7460/13H) to L. Li.
References
Supplementary Material
Please find the following supplemental material available below.
For Open Access articles published under a Creative Commons License, all supplemental material carries the same license as the article it is associated with.
For non-Open Access articles published, all supplemental material carries a non-exclusive license, and permission requests for re-use of supplemental material or any part of supplemental material shall be sent directly to the copyright owner as specified in the copyright notice associated with the article.