
Abstract
Bullying and being bullied in childhood are both linked with later adjustment problems. The impact of childhood bullying on risk for poor physical health in adulthood is understudied. Black and White men (n = 305; mean age = 32.3 years) enrolled in the Pittsburgh Youth Study since the first grade underwent a comprehensive assessment of psychosocial, behavioral, and biological risk factors for poor health. Indices of bullying and being bullied were created by averaging annual ratings collected from participants and their caregivers when the participants were 10 to 12 years old. Results showed that being a bully in childhood was associated with greater stress and aggression and poorer health behaviors in adulthood, whereas being a victim of bullies in childhood was associated with lower socioeconomic resources, less optimism, and greater unfair treatment in adulthood. Unexpectedly, neither bullying nor being bullied in childhood was related to inflammation or metabolic syndrome. Bullying and being bullied in childhood were associated with distinct domains of psychosocial risk in adulthood that may later lead to poor physical health.
Bullying and being bullied are all too common an experience in childhood. Bullying is usually defined as a form of interpersonal aggression in which there is repeated intent to harm and control weaker people (Olweus, 2001; Vaillancourt, Hymel, & McDougall, 2003). Depending on the measurement method and sample, the prevalence of bullying in childhood and adolescence is between 5% and 13% and that of being bullied is between 10% and 33% (Hymel & Swearer, 2015). Although children who are bullied are more likely to exhibit adjustment problems than those who are not, the long-term impact of bullying on psychosocial functioning is not clear. McDougall and Vaillancourt (2015) reviewed the results of 17 prospective studies (11 data sets) examining the influence of being bullied on young adults’ mental health. They concluded that being bullied influences later anxiety, somatization, and psychotic experiences in young adulthood, particularly among men. However, studies sometimes find that the association between being bullied in childhood and adjustment problems in young adulthood becomes nonsignificant after accounting for concurrent childhood adjustment problems. These conclusions raise the possibility that the association between being bullied in childhood and later adult adjustment is due to common underlying factors.
Bullying other people may not have the same adverse consequences as being bullied. Evolutionary theory suggests that bullying may be adaptive in service of obtaining valued resources, such as influence, admiration, and tangible and economic assets (Ellis et al., 2012). Furthermore, disadvantage and limited environmental resources may affect the extent to which bullying strategies are used to obtain resources. Indeed, some data suggest that bullies who are not also victims of bullying (i.e., pure bullies) may not exhibit the negative effect of involvement in bullying (Gini & Pozzoli, 2009; Wolke, Copeland, Angold, & Costello, 2013; Wolke, Woods, Bloomfield, & Karstadt, 2001). For example, in the Great Smoky Mountain Study (Copeland et al., 2014; Wolke et al., 2013), regarding measures of health, financial and educational success, and interpersonal relationships among young adults, people who had been pure bullies in childhood and adolescence were similar to those who had been neither a bully nor a victim, and pure bullies had smaller age-related increases in inflammation relative to people who had been neither a bully nor a victim. However, people who were both victims and bullies were worse off in this study and in others (e.g., Arseneault, Bowes, & Shakoor, 2010).
Other theorists consider both bullying and being bullied to have negative consequences. In a diathesis-stress model (Swearer & Hymel, 2015), involvement in bullying, either as a perpetrator or victim, is viewed as ongoing stressful interpersonal events that result in negative outcomes. It is reasonable, however, to postulate that the nature of the stressful experiences differ for bullies and victims. One might argue from an evolutionary perspective that bullies must assert their position of dominance and control over people and be vigilant for challenges to their position. If successful, they continue to obtain valuable social and economic resources. However, other things being equal, later in adulthood, bullies may continue to be aggressive and domineering, and consequently have a greater number of stressful encounters with other people (compared with victims). Victims, too, must be vigilant, but in their case, the vigilance must be against impending threatening interactions with the potential loss of resources. Other things being equal, the loss of resources may extend to both socioeconomic resources and psychosocial resources (e.g., feeling socially isolated and anxious). Long-term vigilance against threat is known to have cognitive and psychobiological costs (Chen & Matthews, 2001; Gump & Matthews, 1998; McEwen & Stellar, 1993; Spacapan & Cohen, 1983). Furthermore, a large body of literature demonstrates that stressful events have a substantial and negative impact on mental and physical health (e.g., S. Cohen, Janicki-Deverts, & Miller, 2007). Yet little is known about how bullying and being bullied in childhood affect physical health in adulthood (McDougall & Vaillancourt, 2015).
The primary objective of the present study was to evaluate the impact of bullying and being bullied in childhood on psychosocial, behavioral, and biological risk factors for poor physical health in adulthood in a longitudinal sample of Black and White men. In particular, we focused on risk factors for cardiovascular disease because they begin in childhood and adolescence and track into adulthood (Lloyd-Jones et al., 2010) and because they are also risk factors for other indices of poor physical health. We measured negative health behaviors (cigarette and marijuana smoking), positive health behaviors (fruit and vegetable consumption and physical activity), biological risk factors (metabolic syndrome and inflammation), and psychosocial risk factors (low levels of socioeconomic resources, stress at work and home, anger and hostility, and low levels of positive psychosocial resources—i.e., social support, optimism about the future, and purpose in life). Accumulating evidence supports the predictive validity of these risk factors for cardiovascular disease, cancers, infectious diseases, accidents, and all-cause mortality (Adler et al., 1994; R. Cohen, Bavishi, & Rozanski, 2016; Holt-Lunstad, Smith, & Layton, 2010; Matthews & Gallo, 2011; Rasmussen, Scheier, & Greenhouse, 2009; Roest, Martens, de Jonge, & Denollet, 2010).
Consistent with the stress-diathesis model were the hypotheses that men who had higher levels of bullying or being bullied when they were boys would have lower levels of socioeconomic resources, greater stress at work and home, higher anger and hostility, lower levels of psychosocial resources, poorer health behaviors, and higher metabolic-syndrome scores and inflammation levels. We expected that higher scores for bullying would not have a deleterious effect on psychosocial risk factors and inflammation for men who also had lower scores for being bullied; this result would be anticipated on the basis of an evolutionary perspective as well as some evidence from other studies (e.g., Copeland et al., 2014). Secondary objectives of the study were to evaluate whether bullying and being bullied would have a greater impact on adult psychosocial, behavioral, and biological risk factors among the participants from families with lower socioeconomic status (SES) in childhood (compared with families with higher SES) and among Black participants (compared with White participants).
Method
Participants
Participants were recruited from the youngest cohort of the Pittsburgh Youth Study (Loeber, Farrington, Stouthamer-Loeber, & Raskin White, 2008), a longitudinal study of 503 boys initially recruited from Pittsburgh public schools in 1987 and 1988, when the boys were in the first grade. Eight hundred forty-nine boys were randomly chosen to undergo a multi-informant (i.e., parent, teacher, child report) screening that assessed risk for early conduct problems. Half the sample was recruited from the top 30% of the screening measure (i.e., the boys at the highest risk), and the rest were randomly selected from the remainder for a total of 503 boys in the longitudinal sample. The boys’ mean age at screening was 6.9, and racial composition was predominantly White (40.6%) and Black (55.7%). Nearly all primary caregivers were biological mothers (92%); 45.3% cohabitated with a partner, and 16.9% had completed less than 12 years of schooling. More than half of the families (61.3%) were receiving public financial assistance (e.g., food stamps). All of the childhood measures described later were collected by the original Pittsburgh Youth Study researchers.
We contacted eligible men (mean age = 32 years; age range = 30–34 years) from the Pittsburgh Youth Study to participate in a study examining early developmental factors associated with risk for cardiovascular disease. Exclusionary criteria were death (n = 18), prior withdrawal from the Pittsburgh Youth Study (n = 44), severe mental disability (n = 4), and current incarceration (n = 42). Of the 395 men remaining after exclusion, 312 (79%) agreed to participate in some of or all of the protocol. Among the men who were eligible but did not participate, 22 declined participation, 19 failed to respond to messages or missed appointments, and 42 could not be located. Of the 312 men, some no longer lived in the Pittsburgh area, so only 260 participated in the laboratory protocol. The current sample of 312 did not differ from the original sample of 503 in terms of race, p = .084, or risk group, childhood SES, and number of health problems in childhood, all ps > .250.
Overview of the protocol
Participants who lived within driving distance of Pittsburgh or planned to return for a visit were scheduled for a laboratory assessment. On arrival at the laboratory after an 8-hr fast, they completed consent forms, their body measurements were taken, blood pressure was measured, and blood was drawn. After a light meal and a 10-min rest, they performed a series of challenging tasks while cardiovascular measures were taken. Finally, they were interviewed regarding sociodemographic characteristics, health history, and health behaviors, and they completed questionnaires regarding stress and personal characteristics. At the conclusion of the laboratory portion, their sleep was measured for a week. If participants did not live near Pittsburgh or were unwilling to complete the laboratory portion, they completed telephone interviews and online questionnaires. The institutional review board at the University of Pittsburgh approved the study procedures.
Childhood measures
Bullying and being bullied
The Pittsburgh Youth Study researchers used an unpublished instrument adapted from Olweus (1986). At three annual assessments when the boys were ages 10 to 12, primary caretakers were asked, “In the past year, has he bullied other kids?” The children were asked a similar question, “In the past year, have you bullied other kids?” (1 = never/hardly ever, 2 = sometimes, 3 = often). Responses were averaged across years within informants, resulting in a final average with a potential range of 1 to 3, such that a higher score indicated more bullying. Across the three annual assessments, caregiver- and child-reported bullying scores were moderately stable (intraclass correlation coefficient, or ICC = .73 and .50, respectively). The caretaker-child interrater reliability was low (ICC = .22). Ratings were averaged across caregivers and children, which is a commonly accepted method for combining multiple-informant ratings in the developmental literature (Achenbach, McConaughy, & Howell, 1987).
The researchers examined the concurrent validity of the caregiver-reported and child-reported bullying scores by correlating them with the sum of three teacher-reported items assessing bullying behavior from the Teacher Report Form (“Is it true that the pupil is cruel, a bully or mean to others?” “Is it true that the pupil uses force or strong-arm methods to get money or things from students?” and “Is it true that the pupil picks on weaker peers?”). Correlations between average bullying scores across the three annual assessments were small but significant for parents’ and teachers’ ratings, r = .29, p < .001, and for children’s and teacher’s ratings, r = .28, p < .001. The magnitude of these correlations was consistent with results from several meta-analyses examining cross-rater agreement on measures assessing childhood externalizing problems (Achenbach et al., 1987; De Los Reyes et al., 2015).
The same three annual assessments were used to assess whether participants were being bullied. Primary caretakers were asked whether their child had been bullied at school, going to and from school, in the neighborhood, and anywhere else (1 = never/hardly ever, 2 = sometimes, 3 = often). Identical questions were asked of the child. Responses were averaged across the four locations within each year and each informant and were then averaged across years and informants, resulting in a final average with a potential range of 1 to 3. Higher scores indicated more instances of being bullied. The internal consistency for the caregivers’ ratings ranged from .71 to .77, and that for the children’s ratings ranged from .71 to .73. Across the annual assessments, the temporal stability for reports of being bullied was moderate, ICC = .40 for both the caregivers’ reports and the children’s reports. The interrater reliability was moderate, ICC = .40. Ratings were averaged across the caregivers and the children.
Family socioeconomic status
Each year, the caregiver completed a family information form to ascertain the educational attainment and current occupation of the parent(s) living in the home. These were coded into the occupational status and educational categories of the Hollingshead Index (Hollingshead, 1975) and summed; relatively more weight was given to occupation, as is standard. If a caregiver was unemployed at one of the annual assessments, the job code from the prior visit was used. If the child was from a two-parent family, the higher of the two parents’ Hollingshead scores was used. The scores were averaged across the three visits. Higher scores indicated higher SES. These childhood measures were available for only 305 men because 7 men were missing SES data for the years that they were ages 10 to 12.
Other potential childhood covariates
The boys may have had adjustment problems at ages 10 to 12, and these problems might account for associations with adult psychosocial risk, rather than whether the boys were bullies or victims of bullies in childhood. Consequently, we repeated our analyses, adjusting in the same model for both depression and anxiety obtained at the same annual assessments at ages 10 to 12. Depressed mood was assessed using the 13-item short-form Recent Mood and Feelings Questionnaire (Angold, Costello, Messer, & Pickles, 1995); measures of anxious behavior were derived from the Child Behavior Checklist (Achenbach, 1978; Achenbach & Edelbrock, 1987) completed by the boys. Children who are overweight and have health problems in childhood may become bullies or may be bullied; being overweight and having poor health as a child may also affect later metabolic syndrome, inflammation, and body mass index (BMI). Therefore, we adjusted for relative extent of being overweight and number of health problems. The degree to which children were overweight was rated by the child, a parent, and a teacher (averaged across ages 10–12); the number of health problems that a child had, as recorded by his caregiver (averaged across ages 10–12), was recoded as 0, 1, or 2 or more health problems.
Adult measures of risk for poor physical health
Socioeconomic resources
Multiple indices of socioeconomic resources were used: the Hollingshead Index, family income, difficulty paying for basics, and subjective social status. Participants were asked for their educational attainment and current occupation, and responses were coded into the Hollingshead Index scores as noted earlier. For those unemployed at the time of the study, the job code assigned was the lowest available if they were on public assistance or their income was derived from illegal activities. If they were currently unemployed but receiving unemployment compensation, the job code was based on the most recent prior Pittsburgh Youth Study visit (about 3 years earlier). Total annual income before taxes, from $0 to $100,000 or more, was divided into 13 ranges from which the participants chose. Participants were asked to rate how hard it was to pay for the very basics (e.g., food and heating) using a 4-point scale; lower scores indicated greater difficulty. Participants used 9-point scales to rate their subjective social status in two ways: relative to other people in the United States (according to their money, education, and occupational status) and relative to other people in the participants’ community (Adler, Epel, Castellazzo, & Ickovics, 2000). Higher scores indicated higher subjective social status.
Stress
Between 296 and 298 men completed questionnaire measures. Stress was measured in three ways: First, the participants were asked about frequency of 20 stressful life events in the past 6 months. Second, they answered four questions from the Perceived Stress Scale (S. Cohen, Kamarck, & Mermelstein, 1983) about stress in the past month using a 5-point scale from never (1) to very often (5); responses were summed, and higher scores indicated more stress. Finally, participants responded to 10 items about unfair treatment during everyday circumstances using a 5-point scale from never (1) to very often (5); responses were summed, and higher scores indicated more perceived unfair treatment (Williams, Yu, Jackson, & Anderson, 1997).
Aggression and hostility
Aggression and hostility were assessed by the Buss-Perry Aggression Inventory (Buss & Perry, 1992). This inventory yielded a score for each of four components: physical aggression (sample item: “If somebody hits me, I hit back”), verbal aggression (sample item: “I have threatened people I know”), anger (sample item: “Some of my friends think I’m a hothead”), and hostile attitudes (sample item: “I am suspicious of overly friendly strangers”). The statements were rated on a 5-point scale from not at all like me (1) to completely like me (5); higher scores indicate more aggression.
Psychosocial resources
We used three scales to measure psychosocial resources. The Social Provisions Scale (Russell & Cutrona, 1991), consisting of 20 items rated on a 4-point scale from strongly disagree (1) to strongly agree (4), was used to measure social support. The Life Orientation Test (Scheier & Carver, 1985), consisting of 6 items rated on a 4-point scale from strongly disagree (1) to strongly agree (4), was used to measure general optimistic attitudes about the future. The Life Engagement Test (Scheier et al., 2006), consisting of 6 items rated on a 4-point scale from strongly disagree (1) to strongly agree (4), was used to measure purpose in life. The higher the scores on these scales, the higher the level of psychosocial resources available.
Health behaviors
We used Pittsburgh Youth Study questions from earlier evaluations to ask participants about their smoking and marijuana use. They were asked whether they had smoked cigarettes in the past year and the average number of cigarettes smoked per day; responses were coded for the following categories: “never or not in the past year,” “≤ 10 cigarettes per day,” and “> 10 cigarettes per day.” Participants were also asked the number of days in the past year that they had used marijuana or hashish; responses were coded for the following categories: “never,” “≤ 5 joints per week,” and “≥ 6 joints per week.” The Paffenbarger Physical Activity Questionnaire (Paffenbarger, Wing, & Hyde, 1978) was used to assess average number of kilocalories per week expended in leisure activities, walking, and stair climbing. Data on daily fruit and vegetable consumption were collected using six items from the fruit and vegetable section of the Behavioral Risk Factor Surveillance System Questionnaire (Centers for Disease Control and Prevention, 2011).
Biological risk factors
Laboratory assessments for biological risk factors were completed for 260 men. Height and weight were measured, and BMI (kg/m2) was calculated. After participants had rested for 10 min, blood pressure was measured several times while they were sitting, and the measurements were averaged. Metabolic syndrome was defined according to the clinical criteria from the National Cholesterol Education Program Adult Treatment Panel III (Grundy et al., 2005). For men, these criteria are resting systolic blood pressure of 130 mmHg or higher, resting diastolic blood pressure of 85 mmHg or higher, or use of antihypertensive medications; fasting glucose of 100 mg/dl or higher or use of antidiabetes medications; triglyceride levels of 150 mg/dl or higher; high-density-lipoprotein cholesterol of less than 40 mg/dl; and waist circumference of 40 in. or more. We used as our primary outcome the number of these criteria on which the participants scored above the clinical cutoffs, as opposed to the conventional definition (i.e., the presence of three or more of the five indicators). C-reactive protein and interleukin 6 were our measures of inflammation. Participants were removed from the inflammation analysis if they reported being ill, taking anti-inflammatory medications, or had C-reactive protein values greater than 10 mg/L, which could indicate an acute infection. As a result, there were 220 men in the inflammation analysis.
Laboratory assays were conducted by the Heinz Laboratory at the University of Pittsburgh, which is a certified laboratory. We used a turbidimetric high-sensitivity test to measure C-reactive protein, and interleukin 6 was measured in duplicate using a high-sensitivity enzyme-linked immunosorbent assay kit (HS600; R&D Systems, Minneapolis, MN). Total cholesterol and triglyceride concentrations were determined by coupled enzymatic methods. High-density-lipoprotein cholesterol was isolated according to the method of Izawa. Glucose was measured by hexokinase-coupled reaction (Beckman Coulter, Center Valley, PA).
Data reduction and statistical analysis
Our first step was to reduce the number of dependent variables by conducting principal component analyses of measures within the domains of socioeconomic resources, health behaviors, stress, aggression, and psychosocial resources; metabolic syndrome, inflammation, and BMI were not subjected to component analysis because their pathophysiology differs. The following factors emerged from these analyses:
For the five indices of socioeconomic resources, one factor with an eigenvalue of 2.46 and loadings ranging from .60 to .80
For the four health behaviors, one factor (including smoking and marijuana use in the past year) with an eigenvalue of 1.37 and loadings of .77 and .83, respectively, and a second factor (including physical activity per week and fruit-and-vegetable consumption) with an eigenvalue of 1.10 and loadings of .76 and .76, respectively
For the three stress indices, one factor with an eigenvalue of 1.74 and loadings of .65 to .82
For the four aggression and hostility indices, one factor with an eigenvalue of 2.55 and loadings from .77 to .84
For the three indices of psychosocial resources, one factor with an eigenvalue of 2.22 and loadings ranging from .83 to .90.
We then z-transformed the scores, so they had a mean of 0 and a standard deviation of 1, and averaged them within the domains. If results for a particular summary score were significant, we performed analyses of the individual unstandardized scores that comprised the summary scores. We chose to use this strategy rather than analyzing latent factors derived from confirmatory factor analysis because our goal was to reduce the data, not to make statements about the latent structure of the variables; factor scores are indeterminate, whereas principal component scores are not. The results of principal component and factor analysis yielded highly similar results (data not shown) so the overall pattern of findings would not change (Fabrigar, Wegener, MacCallum, & Strahan, 1999).
Before beginning the project, we calculated statistical power using PROC POWER in SAS, assuming a target sample of 300 participants, two-tailed tests, and a Type I error rate of .05. The power calculations took into account standard covariates and tested for the ability to detect significant main effects and interactions. We also conducted Monte Carlo studies using Mplus software (Version 7.3; Muthén & Muthén, 2015) to estimate power for our more complicated proposed relationships, which are beyond the scope of this article. The results of these calculations confirmed that the sample size of 300 was adequate for model testing. A post hoc analysis indicated that the magnitude of the correlations we would have power of .80 to detect would be .162, .174, and .189 for sample sizes of 300, 260, and 220, respectively, if we assumed three covariates and an alpha of .05.
We used t tests and χ2 tests to describe differences in the children’s and adults’ measures by race. The scores for bullying and being bullied were treated as continuous variables in the models, given that there are no established reference ranges for these measures. Our primary analyses were multivariate regression analyses predicting adult summary scores (within domain) and biological risk factors; the scores for bullying and being bullied were entered in Step 1, and their interaction was entered in Step 2 (the predictors were mean-centered). In the primary analyses, we adjusted for race, risk-group status at screening, and Hollingshead family SES scores when the participants were ages 10 to 12. If a particular summary score showed significant effects, we performed analyses of the individual scores that contributed to the summary score.
In secondary analyses, we examined whether race or Hollingshead childhood family SES scores moderated the effects in separate models. Separate analyses for ratings by the children and caregivers are provided in the Supplemental Material available online and are not discussed further. Additional covariates addressed whether concurrent measures of childhood adjustment, as indexed by depressive symptoms and anxiety, accounted for the effects of bullying and being bullied. In other words, we analyzed whether childhood adjustment in general (as opposed to bullying and being bullied) was the predictor of adult psychosocial risk. Covariates of childhood overweight and health problems also were introduced in the analyses of metabolic syndrome and inflammation. Significant main effects for either scores for bullying or scores for being bullied would support the stress-diathesis model. Finding either a nonsignificant effect for bullying or a significant interaction of bullying and being bullied (higher scores for bullying and lower scores for being bullied are associated with lower psychosocial and cardiovascular-disease risk) would support the evolutionary model.
Results
Sample description
Table 1 shows the characteristics of the participants in childhood and adulthood. Participants are separated by race, given our secondary aim of examining whether race moderated associations between bullying or being bullied and risk factors. On average, the sample was lower middle class; Black participants generally had lower Hollingshead family SES scores in childhood than did White participants. As in other population-based samples (e.g., Wolke et al., 2013), average scores for bullying and being bullied were low. Across the 3 years, 5% to 8% of caregivers reported that their boys bullied other children “often,” 60% to 70% reported “never,” and the remainder indicated “sometimes.” Likewise, 3% to 5% of boys reported that they bullied other children often, 77% to 82% reported “never,” and the remainder indicated “sometimes.” Again across the 3 years, 3% to 7% of caregivers reported that their boys were “often” a victim, 62% to 75% reported “never,” and the remainder indicated “sometimes” in any of the four locations. Likewise, 3% to 13% of the boys reported that they were “often” a victim of bullying in any of the four locations, 62% to 80% reported “never,” and the remainder indicated “sometimes.” There were no differences in scores for bullying or being bullied by race. Scores for bullying and being bullied were correlated, r(305) = .25, p < .001. Further, scores for bullying and being bullied were correlated with depressed mood and anxious behavior scores, r = .34 to .36, ps < .001. Compared with nonparticipants, participants tended to have slightly lower bullying scores (Ms = 1.39 vs. 1.33, respectively), p = .068, but similar scores for being bullied.
Sample Characteristics

Note: This table presents mean values, with standard deviations in parentheses, unless otherwise noted. The data in the table are untransformed, with the exception of the summary scores, which are averaged z scores. The range of possible values for each measure is indicated in parentheses next to that measure. Asterisks indicate variables on which the races differed significantly (*p < .05, **p < .01, ***p < .001), according to t tests and χ2 tests. SES = socioeconomic status.
Compared with White men, Black men had lower summary scores for socioeconomic resources and higher summary scores for negative health behaviors and stress; there were no differences in summary scores for psychosocial resources or aggression. More specifically, relative to White men, Black men had lower Hollingshead SES scores, income, and subjective social status (compared with other people in the United States), reported experiencing a greater number of stressful life events and more unfair treatment, and had higher scores for physical aggression and lower scores for social support. Smoking cigarettes was more common among Black men, but White men were heavier smokers; marijuana was more common among Black men. None of the biological markers differed by race.
Scores for bullying and being bullied in childhood in relation to adult measures
Table 2 shows the results of linear and logistic regression analyses of scores for bullying and being bullied averaged across informants and their interaction. Significant interactions of scores for bullying or being bullied with childhood family SES and race are noted in the text.
Regression Coefficients From Multivariate Models Predicting Adult Outcomes Using Childhood Scores for Bullying, Being Bullied, and Their Interaction

Note: The models were adjusted for race, risk-stratification group, and Hollingshead family socioeconomic status (SES) scores when the boys were 10 to 12 years old. The scores for bullying and being bullied were averages of child and parent reports. Results for statistically significant terms (p < .05) are shown in boldface type. CI = confidence interval.
Socioeconomic resources
The men who had higher scores for being bullied at ages 10 to 12 had lower SES summary scores as adults. The analysis of summary scores revealed a significant interaction between being bullied and race, β = 0.114, p = .028, b = 0.08, 95% confidence interval, or CI = [0.01, 0.15]. Higher scores for being bullied were associated with lower summary scores among White men, β = −0.29, p < .001, b = −0.20, 95% CI = [−0.30, −0.11], but not among Black men, p > .250. Follow-up analyses showed that the men who had higher scores for being bullied had lower adult family income, lower subjective social status on both the U.S. and community ladders, and reported that it was harder to pay for basics. Being bullied and race had a marginal interaction effect on the Hollingshead SES scores in adulthood, β = 0.10, p = .055, b = 1.56, 95% CI = [−0.03, 3.14]. Higher scores for being bullied were associated with lower Hollingshead SES scores in adulthood among White men, β = −0.19, p = .008, b = −2.88, 95% CI = [−5.01, −0.76], but not among Black men, p > .250. Bullying and its interaction with being bullied did not have a significant effect on overall SES score and had no significant interactions with childhood family SES.
Psychosocial risk factors
Stress
The men who had higher scores for bullying or being bullied in childhood had higher stress summary scores. There were no significant interactions with race or with childhood family SES. Follow-up analyses showed that men who had higher scores for both bullying and being bullied had greater perceived stress, whereas the men with higher scores for bullying had a greater number of recent stressful life events, and those with higher scores for being bullied had higher perceptions of unfair treatment.
Aggression
The men with higher scores for bullying in childhood had higher aggression summary scores. There were no significant interactions with race or family SES. Follow-up analyses showed that the scores for bullying were associated with all four of the aggression-component scores.
Resources
The men with higher scores for being bullied had lower psychosocial-resource summary scores. Significant interactions of scores for bullying and being bullied indicated that the men who had low scores for bullying and being bullied had the highest resource scores (Fig. 1), to which scores for social support and life purpose contributed strongly. Higher victim scores were associated with lower optimism scores. The three-way interaction of Bullying × Being Bullied × Race was nonsignificant, as was the three-way interaction of Bullying × Being Bullied × Childhood SES.
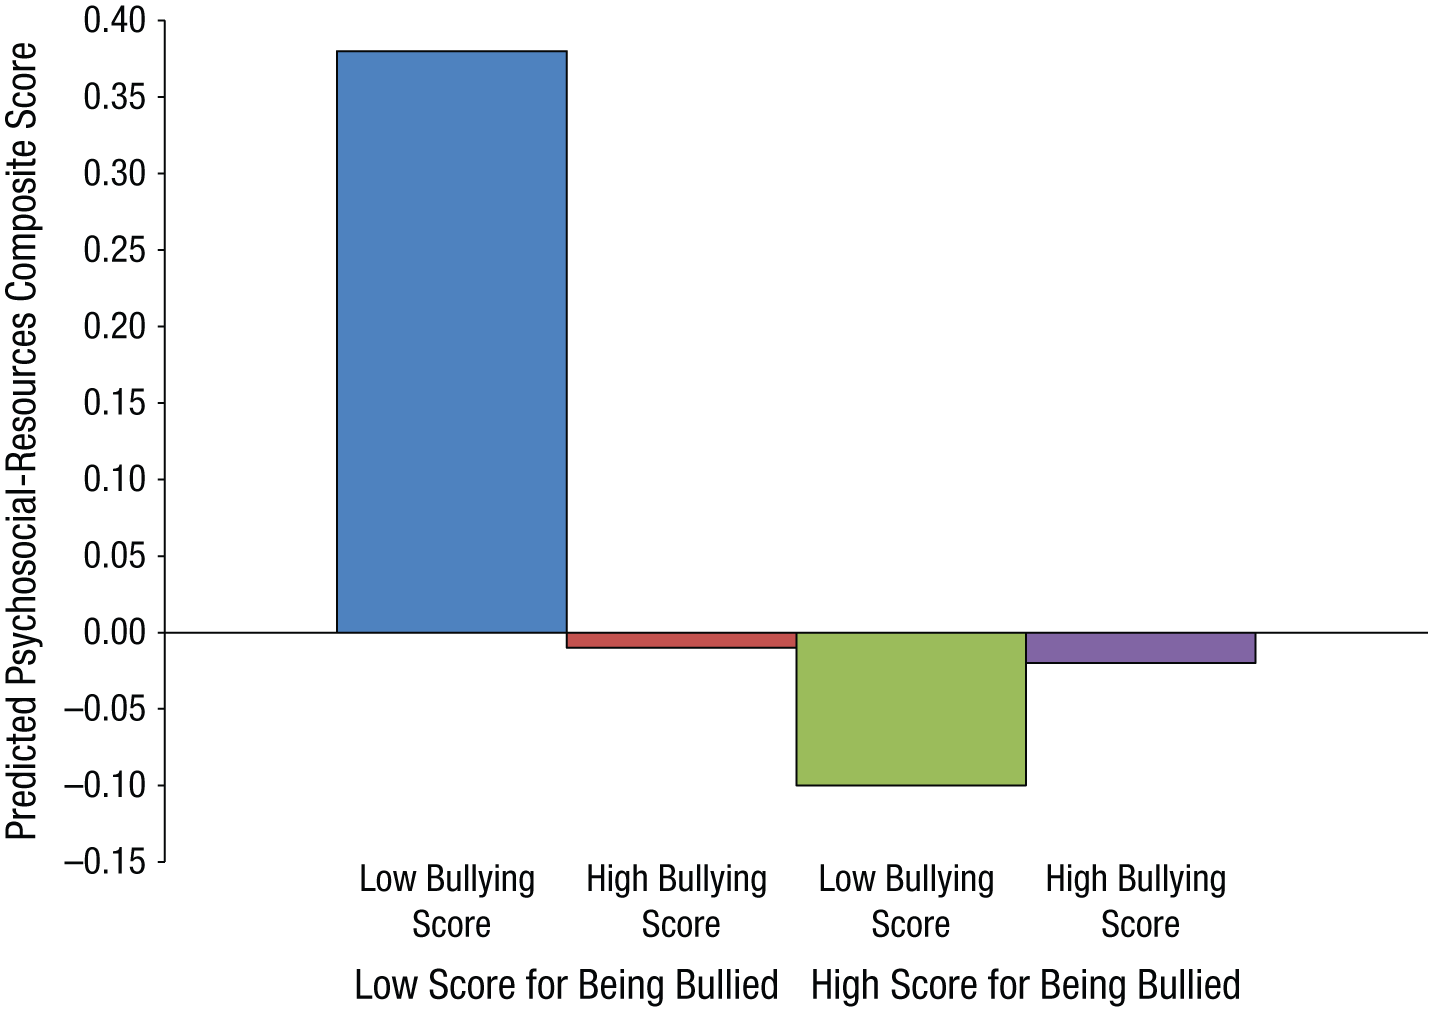
Predicted psychosocial-resources summary scores of participants according to their combination of scores for bullying and being bullied in childhood. Low = 1 SD below the mean; high = 1 SD above the mean.
Health behaviors
The men who had higher scores for bullying had higher negative-health-behavior summary scores. Scores for being bullied were unrelated. Follow-up analyses showed that the men with higher scores for bullying both smoked more cigarettes and used more marijuana per week as adults.
Analyses of the overall positive-health-behavior summary scores revealed a marginally significant interaction term for Bullying × Being Bullied, such that the men who had lower scores on both reported more positive health behaviors as adults. This was primarily because the men who had lower scores on both reported greater physical activity as adults.
Biological risk factors
Higher scores for bullying and being bullied were not associated with elevated biological risk factors. Higher scores for bullying were associated with being thinner, but this effect was qualified by a Bullying × Race interaction term, β = −0.14, p = .033, b = −0.03, 95% CI = [−0.06, –0.00]. The main effect for bullying was significant for Black men, β = −0.28, p = .001, b = −0.06, 95% CI = [−0.10, −0.03], but not for White men, p > .250. Higher scores for bullying tended to be associated with fewer clinical cutoffs for the metabolic syndrome, p = .066. Because higher BMI is associated with greater risk of the metabolic syndrome and elevated inflammation, we repeated the analyses, adjusting for adult BMI. The null associations remained.
Adjustment for other childhood factors
Adjustments for depressive symptoms and anxious behaviors at ages 10 to 12 did not change the significant results reported, except for the stress summary score. The main effect for bullying became nonsignificant, p = .113, and the main effect for being bullied approached significance, p = .070; greater anxiety behaviors in childhood were independently related to higher stress summary scores, p = .002, but depression scores were unrelated. Adjustments for overweight ratings and poor health conditions in childhood did not alter the null results for the biological variables, and the association between higher scores for bullying and lower adult BMI remained significant, p = .033. When we removed from the analysis the men who at the age of 12 or 13 had reported having smoked on at least 1 day during the previous year (n = 30) or reported having used marijuana on at least 1 day during the previous year (n = 19), bullying scores remained associated with smoking cigarettes in adulthood, p = .024, and marijuana use in adulthood, p = .017.
Discussion
The present study adds to the literature on the adult consequences of bullying and being bullied during childhood in a number of ways. First, we found that the extent to which one is a bully and the extent to which one experiences being bullied in childhood are associated with psychosocial and behavioral risk factors in adulthood. In our study, a higher score for bullying was associated with a greater number of negative health behaviors, greater aggressiveness, and more experiences of stressful circumstances. A higher score for being bullied was associated with lower socioeconomic resources overall and more experiences of stressful circumstances and unfair treatment. These results were apparent in analyses that took into account race, risk-stratification group, and Hollingshead family SES scores at ages 10 to 12; overall, the results remained significant with further adjustment for childhood depressive symptoms and anxiety. Furthermore, we found no convincing evidence that the boys from low SES families who were bullies or victims were worse off as adults, which suggests that low SES in childhood may not identify children who are especially vulnerable to involvement in bullying.
Second, the effects of bullying and being bullied are largely true for both Black and White men, with several exceptions. Among Black participants, greater engagement in negative health behaviors and being thinner were associated with higher bullying scores, and among White participants, lower socioeconomic-resources summary scores were associated with higher scores for being bullied. The latter finding was particularly driven by Hollingshead SES in adulthood and suggests that being bullied in childhood may have a greater impact on adult attainment of education and occupational status for White men than for Black men.
Third, and perhaps most important, we found no evidence that being a bully or victim in childhood was associated with adverse metabolic-risk scores or inflammation. The null results were unexpected because two studies have reported that victims of bullying have elevated inflammation levels (Copeland et al., 2014; Takizawa, Danese, Maughan, & Arseneault, 2015). Perhaps our results differ because of a smaller sample size as well as sample differences; in the Pittsburgh Youth Study, approximately half the boys at screening were at risk for antisocial behavior, and half the boys were Black.
Perhaps we should conclude that involvement in childhood bullying has no long-term consequences for biological markers of poor physical health. However, arguing against that conclusion is the evidence that both childhood bullies and victims have elevated levels of psychosocial risk factors for poor physical health, which would likely result in poor health later in life. Because the boys with higher scores for bullying in childhood continued to be aggressive and experienced more frequent stressors in adulthood, we anticipate with longer follow-up that they would be at greater risk for poor physical health, including cardiovascular-disease events. Furthermore, the boys with higher scores for bullying in childhood were more likely to be smokers in adulthood, which is a major risk factor for cardiovascular disease and other life-threatening diseases. Likewise, the boys with higher scores for being bullied attained lower income, reported lower subjective socioeconomic rank relative to the United States and their community, and had more financial difficulties; with longer follow-up, they too might be at greater risk for poor physical health, given the well-established associations between SES and many chronic diseases and early mortality (Adler et al., 1994; Matthews, Gallo, & Taylor, 2010).
Our findings provide partial support for both the stress-diathesis and the evolutionary models of bullying and being bullied. Being either a bully or a victim in childhood was associated with more stress and fewer psychosocial resources (compared with the boys with low scores in bullying and being bullied), which is consistent with the diathesis-stress model. However, as noted earlier, the nature of the stressful circumstances may be quite different for bullies and victims. Victims must be vigilant for threatening interactions with potential loss of resources, whereas bullies must assert their position of dominance and control over others in order to obtain valuable social and economic resources. The latter argument is consistent with the evolutionary model and may help explain why boys with higher bullying scores did not have lower socioeconomic resources in adulthood. The greater smoking and marijuana use of childhood bullies later in life (compared with boys with low bullying scores) may reflect the accelerated lifestyle that the evolutionary model posits among people with limited resources or social disadvantage (Ellis et al., 2012).
The present study has a number of limitations. The findings may not generalize to girls or to other ethnic groups or children living in rural settings. Furthermore, the fact that some men were ineligible because they were deceased or incarcerated may have affected the results in unknown ways. Men who were ineligible because of incarceration tended to have higher scores for bullying but similar scores for being bullied compared with the men in our sample (data not shown). Exclusion of these men may have resulted in lower bullying than one would anticipate from the sampling plan. The biological risk measures were administered once, and perhaps the change over time is more sensitive to earlier childhood experiences, as was the case for the association observed between inflammation and bully or victim status in the Smoky Mountain Study (Copeland et al., 2014). The sample size was adequate to detect associations with a magnitude between .16 and .19, but not smaller associations. The study did not allow for evaluation of whether the obtained temporal relationships between childhood bullying or being bullied and adult risk factors were present because bullying is a marker for later risk or because bullying is a contributor to later risk. Finally, we did not have direct measures of vigilance for threat to one’s status and dominance or loss of resources, which are hypothesized mechanisms accounting for differential effects of bullying and being bullied.
The strengths of the study were having multiple informants and repeated measures of bullying and being bullied at a time during development when these behaviors are more common. Having the opportunity to examine differences between Black and White men was useful and unique. The ability to evaluate whether the obtained associations were independent of other childhood behaviors and family circumstances allowed for fuller understanding of the effects of bullying and being bullied specifically. Finally, it was advantageous to measure objective health indicators rather than to rely on self-reported health history. To our knowledge, other than investigations on obesity and inflammation (Copeland et al., 2014; Takizawa et al., 2015), this report is the only one on cardiometabolic risk in relation to bullying and being bullied in childhood.
In summary, more than 20 years later, the men who bullied more as children were more likely to smoke cigarettes and use marijuana, to experience stressful circumstances, and to be aggressive and hostile; the men who were bullied more as children had more financial difficulties, had lower subjective social status, felt more unfairly treated by others, and were less optimistic about their future. These outcomes set the stage for high risk for later poor health, including clinical cardiovascular disease events, albeit through different psychosocial pathways. Interventions in children at risk for involvement in bullying have the promise of long-term psychosocial and perhaps physical health benefits in adulthood.
Footnotes
Acknowledgements
We thank the study originators, Rolf Loeber and Magda Stouthamer-Loeber.
Action Editor
Ian H. Gotlib served as action editor for this article.
Declaration of Conflicting Interests
The authors declared that they had no conflicts of interest with respect to their authorship or the publication of this article.
Funding
This research was supported by National Heart, Lung, and Blood Institute Grant R01-HL111802. Data collection for the Pittsburgh Youth Study was funded by National Institute on Drug Abuse Grant DA411018, National Institute of Mental Health Grants MH48890 and MH50778, the Pew Charitable Trusts, and Office of Juvenile Justice and Delinquency Prevention Grant 96-MU-FX-0012.
References
Supplementary Material
Please find the following supplemental material available below.
For Open Access articles published under a Creative Commons License, all supplemental material carries the same license as the article it is associated with.
For non-Open Access articles published, all supplemental material carries a non-exclusive license, and permission requests for re-use of supplemental material or any part of supplemental material shall be sent directly to the copyright owner as specified in the copyright notice associated with the article.