



Abstract
Heritable variance in psychological traits may reflect genetic and biological processes that are not necessarily specific to these particular traits but pertain to a broader range of phenotypes. We tested the possibility that the personality domains of the five-factor model and their 30 facets, as rated by people themselves and their knowledgeable informants, reflect polygenic influences that have been previously associated with educational attainment. In a sample of more than 3,000 adult Estonians, education polygenic scores (EPSs), which are interpretable as estimates of molecular-genetic propensity for education, were correlated with various personality traits, particularly from the neuroticism and openness domains. The correlations of personality traits with phenotypic educational attainment closely mirrored their correlations with EPS. Moreover, EPS predicted an aggregate personality trait tailored to capture the maximum amount of variance in educational attainment almost as strongly as it predicted the attainment itself. We discuss possible interpretations and implications of these findings.
Variance in personality traits has a substantial genetic component (Vukasović & Bratko, 2015). However, the specific genetic variants responsible for this have largely remained elusive, possibly because of the highly polygenic nature of the traits (Chabris et al., 2013). That is, large numbers of single-nucleotide polymorphisms (SNPs) collectively explain from nearly zero to under 20% of variance in personality traits, but the effect of any one SNP is usually too small to be reliably detectable (Lo et al., 2017; Smith et al., 2016; van den Berg et al., 2016). The same tends to be true for other psychological phenotypes, such as intelligence (Davies et al., 2015) or subjective well-being (Okbay, Baselmans, et al., 2016). Slightly more variance has been traced to specific SNPs for some phenotypes that are arguably less related to psychology, such as educational attainment (Okbay, Beauchamp, et al., 2016) and body mass index (Locke et al., 2015).
It has also been suggested that personality traits could be conceived of as mostly phenotypic phenomena with little or no genetic or biological architecture of their own (Turkheimer, Pettersson, & Horn, 2014). If this is true, personality traits’ observed genetic variance may to some extent (perhaps even to a large extent) reflect genetic influences that act broadly across the organism as a nonspecific “genetic pull” rather than contribute to some systems specifically responsible for what appear as personality traits (Turkheimer et al., 2014). The genetic and resultant biological underpinnings of personality traits should then be shared with other phenomena that phenotypically relate to these personality traits but fall outside the personality domain per se (Mõttus, Marioni, & Deary, 2017).
Here, we address this possibility by investigating whether phenotypic variability in personality traits is associated with polygenic propensity for educational attainment; polygenic propensity refers to the combined additive effect of a large number of common SNPs captured in DNA arrays (i.e., SNPs in which the less prevalent alleles are not too rare), and educational attainment is the highest educational level obtained (hereafter referred to as “education”). Numerous phenotypic traits may share genetic influences with personality characteristics. We chose education because it is a broad behavioral phenotype that has a sizable heritable component (Colodro-Conde, Rijsdijk, Tornero-Gómez, Sánchez-Romera, & Ordoñana, 2015; Silventoinen, Krueger, Bouchard, Kaprio, & McGue, 2004), it is phenotypically correlated with a range of personality traits (Damian, Su, Shanahan, Trautwein, & Roberts, 2015), and yet it is not part of how the traits are usually operationalized (i.e., as self- or informant-reported summaries of thinking, feeling, and behaving). In addition, the SNPs associated with education have been relatively well characterized (Okbay, Beauchamp, et al., 2016).
Twin studies have revealed that the phenotypic correlations between several personality traits and the academic results of children and adolescents can largely be accounted for by shared genetic influences (Hicks, Johnson, Iacono, & McGue, 2008; Rimfeld, Kovas, Dale, & Plomin, 2016). In addition to the additive influences of individual genetic variants, these estimates reflect nonadditive dominance and epistatic effects caused by interactions between and within genetic loci, effects of rare variants, and person-environment correlations (Purcell, 2002), and they are possibly confounded with twins’ shared environmental effects (Vinkhuyzen et al., 2012). Likewise, polygenic propensity for adult education has been linked with childhood self-control and interpersonal skills (Belsky et al., 2016) and low adult neuroticism (Okbay, Beauchamp, et al., 2016). The findings of these two studies point directly to a possible overlap in the genomic correlates of personality traits and those of education, although neither study addressed the implications of its findings for the genetic etiology of personality.
It is not known, however, whether such polygenic correlations with education are specific to these three personality traits or generalize to a wider spectrum of traits, such as the domains and facets of the five-factor model (FFM). To the extent that genetic variance in both education and personality does reflect a more general genetic pull, one would expect education to have a wider range of polygenic correlations with individuals’ characteristic patterns of thinking, feeling, and behaving. Specifically, polygenic correlations should then be particularly likely for personality traits that are phenotypically correlated with education.
Employing published meta-analytic associations (Okbay, Beauchamp, et al., 2016) between years of education and SNPs, we created an education polygenic score (EPS) for each of the 3,061 adult Estonians who participated in the study. We correlated these scores with the five FFM domains and their 30 facets, as well as with an aggregate personality trait that combined, with optimal weights, education-related facets of personality. The range of 30 personality traits allowed us to test the ubiquity of polygenic correlations across the spectrum of personality characteristics. We used both self- and informant-rated personality traits, which allowed us to generalize the findings across specific assessment methods.
Method
Sample
The sample for this study was a subset of the Estonian Biobank cohort (approximately 52,000 individuals), a volunteer-based sample of adults residing in Estonia (Leitsalu et al., 2014). The participants were recruited randomly by general practitioners, physicians, or other medical personnel in hospitals or private practices as well as in the recruitment offices of the Estonian Genome Centre of the University of Tartu. Each participant provided informed consent, went through a standardized health examination, and donated a blood sample for DNA testing. From among 3,426 individuals for whom both personality data (i.e., from self-reports, informant reports, or both) and DNA data were available, we selected 3,061 individuals (1,821 women) who were at least 25 years old (mean age = 49.54 years, SD = 15.49, age range = 25–91 years) and had therefore had a chance to complete higher education and obtain a postgraduate degree. Apart from a slight overrepresentation of women (59%), the sample was a fairly representative cross-section of the adult Estonian population. For example, 37% of participants had higher education, which is comparable with the population estimate available from the Organisation for Economic Co-operation and Development (http://stats.oecd.org). Personality data were collected only for the latest recruits of the Estonian Genome Centre of the University of Tartu because the questionnaire was integrated at the last phase of the study.
Measures
Personality
All but 15 of the selected participants (i.e., N = 3,046) completed the Estonian version of the NEO Personality Inventory 3 (NEO PI-3; McCrae & Costa, 2010), which is a slightly modified version of the Estonian version of the Revised NEO Personality Inventory (Kallasmaa, Allik, Realo, & McCrae, 2000). The NEO PI-3 has 240 items that measure the 30 personality facets, which are then grouped into the five FFM domains; each domain includes 6 facets, and each facet consists of 8 items. The items were answered on a 5-point scale (0 = false or strongly disagree; 4 = true or strongly agree). Personality traits of 2,904 of the selected participants (including the 15 participants with missing self-reports) were rated by informants, who were typically a spouse or partner, a parent or child, or a friend. For cross-rater correlations, see Mõttus, McCrae, Allik, and Realo (2014).
Education
Education was based on self-reports and quantified on an eight-level scale: no formal education (n = 6), lower basic education (n = 31), basic education (n = 207), secondary education (n = 550), vocational secondary education (n = 956), applied higher education (n = 177), higher education (n = 967), or postgraduate education (n = 167). For the purpose of the analyses reported here, the variable was treated as if it were based on an interval scale. When we repeated all analyses with education converted into years of education, according to the method of Okbay, Beauchamp, et al. (2016), the results obtained were nearly identical to the results reported here.
Education polygenic scores
Genotyping was completed using different platforms (HumanCNV370-Duo and -Quad BeadChips, OmniExpress BeadChips, and HumanCoreExome-10 and -11 BeadChips; Illumina, San Diego, CA), and the genotype data were imputed using a reference panel (Phase I integrated variant set release, Version 3; NCBI build 37, hg19) from the 1000 Genomes Project (1000 Genomes Project Consortium, 2015). Imputed genotype probabilities were converted into hard-called genotypes using default settings in PLINK software (Version 1.9; Chang et al., 2015). In short, if the value of the “imputation info metric” (e.g., prediction uncertainty) returned by the software was less than .90, the variant was coded as missing; otherwise, the genotype with the highest probability was used. In further measures of quality control, SNPs with a minor allele frequency less than .01 and a Hardy-Weinberg Equilibrium p value of less than .001 were omitted from analyses.
Generally speaking, polygenic scores aggregate the small effects of large numbers of SNPs on a phenotype. The effect size for each SNP’s designated allele (typically the less prevalent one) is taken from an independent sample and multiplied by the count (0, 1, 2) of the allele for a given individual in the target sample. The sums of these products across all SNPs then constitute the individual’s polygenic score.
For the current study, the effect sizes for individual SNPs were taken from a meta-analysis in which more than 8 million SNPs were linked with years of formal schooling (Okbay, Beauchamp, et al., 2016). At our request, the authors of the meta-analysis removed the contributions of the Estonian Genome Centre data from their combined results (i.e., discovery sample plus replication sample) for the purpose of the current study, so that the meta-analytic N varied from 100,000 to 319,946, depending on the SNP. The genotypes were pruned using clumping to retain SNPs in linkage equilibrium, with an r2 of less than .25 within a 250-base-pair window. The clumping procedure was carried out on the basis of the subsample of 1,377 participants who had been genotyped using HumanCoreExome platforms; SNPs with the lowest p values in relation to education (in the meta-analysis of Okbay, Beauchamp, et al., 2016) were retained as the index SNPs of the clumps. No p-value cutoff was used for retaining SNPs. As a result of these procedures, each participant’s EPS value was based on between 323,818 and 337,334 alleles. Ten principal components representing possible population stratification were calculated on the basis of the genotype data, and EPS was residualized for these components, as well as for the numbers of alleles contributing to EPS. The scores were calculated using PLINK software.
Analyses
We first correlated individual FFM domains and facets with both EPS and education, controlling for age and sex. The p value for each set of 35 correlations (i.e., EPS with self-reported traits, EPS with informant-reported traits, education with self-reported traits, and education with informant-reported traits) was adjusted for false-discovery rate (Benjamini & Hochberg, 1995). In addition, to efficiently capture the multifacet associations between personality and education, we weighed scores of the 30 personality facets by the facets’ unique associations with education and then aggregated these weighted scores into a single composite variable. This composite, which we refer to as the education polyfacet score, was analogous to the EPS, which aggregated mostly very small effects of individual SNPs on education; that is, education polyfacet scores aggregated the effects of personality facets on education. To calculate the weight for each facet, we used a regression procedure called the least absolute shrinkage and selection operator (LASSO; Tibshirani, 2011) with 50-fold cross-validation and a shrinkage parameter that minimized cross-validated error. Using this method allowed us to effectively deal with multicollinearity among facets as well as reduce biases caused by overfitting. By nature, the polyfacet scores captured as much variance in education as could collectively be predicted by the 30 facets, even those that were not significantly correlated with education in the bivariate analyses. The polyfacet score can therefore be conceived of as reflecting an education-specific personality trait. We then carried out exactly the same procedure for the EPS as we had for the polyfacet scores, separately for self-ratings and informants’ ratings of the personality facets. All polyfacet scores were residualized for age and sex.
Results
EPS had a correlation of .18, 95% confidence interval (CI) = [.14, .21], with its target phenotype, education (p < .001 for all correlations reported in the text, unless noted otherwise). The association did not appear perfectly linear across the levels of education; people with medium levels of education were rather similar in their EPS (Fig. 1). However, the average difference between people with lower basic education and those with a postgraduate degree was substantial (0.84 SD units). Table 1 shows the associations of personality traits with both phenotypic education and EPS (for confidence intervals, see Table S1 in the Supplemental Material available online).
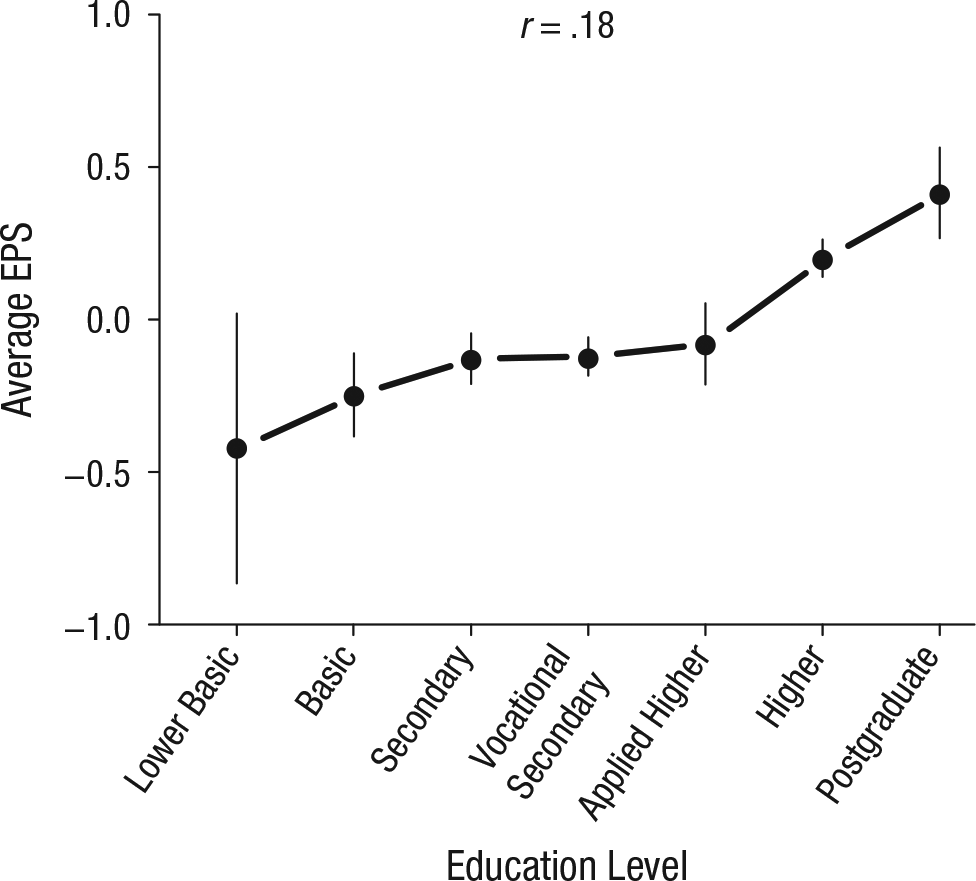
Mean standardized education polygenic score (EPS) as a function of education level. Mean EPS is not shown for the 6 participants with no formal education. Error bars indicate 95% confidence intervals.
Associations of the Personality Domains and Facets With Education and Education Polygenic Scores

Note: All p values are adjusted for false-discovery rate (per column); df = 3,044 for analyses based on self-ratings, and dfs = 2,901 and 2,902 for analyses based on informants’ ratings. Associations for which the 99% confidence intervals did not span zero are highlighted in boldface.
Personality and polygenic propensity for education
For both self-ratings and informants’ ratings, EPS was significantly negatively correlated with the neuroticism domain and positively correlated with the openness domain, although not all of facets’ associations were significant. Specifically, for both rating types, the associations were significant for hostility (N2), openness to aesthetics (O2), openness to actions (O4), openness to ideas (O5), and openness to values (O6). The associations were also significant in both rating types for trust (facet A1 of the Agreeableness domain). Some associations were significant only for self-reported ratings; for example, people with higher EPS tended to rate themselves lower on modesty (A5) and tendermindedness (A6), whereas this was not apparent in the informants’ ratings. In relative terms, the associations of EPS with self-reported facet scores were highly similar to their associations with informant-rated facet scores: The correlation between the two vectors of 30 correlations (Fisher-transformed) was .86, 95% CI = [.73, .93].
What we find particularly noteworthy is that the facets’ associations with EPS also closely mirrored their associations with phenotypic education. Specifically, the correlations between facets and education and between facets and EPS (from Table 1, Fisher-transformed) strongly tracked each other in both the self-reported ratings, r(28) = .91, 95% CI = [.81, .96], and the informants’ ratings, r(28) = .84, 95% CI = [.69, .92]. As shown in Figure 2, the associations between facets and education and between facets and EPS tracked each other across the spectrum of effect sizes, in that these links were not driven by the few facets that significantly correlated with both education and EPS. 1 For example, even when we considered only those facets that had an absolute correlation of less than .05 with EPSs (i.e., mostly nonsignificant correlations), the associations between facets and education and between facets and EPS still mirrored each other in both self-reported ratings, r(16) = .61, 95% CI = [.21, .84], p = .007, and informants’ ratings, r(22) = .78, 95% CI = [.55, .90].

Scatterplot showing the association between the correlations of the 30 personality facets with education and the correlations of the 30 facets with education polygenic scores (EPSs). Results are shown separately for self-reported personality ratings and informants’ personality ratings.
Associations with polyfacet scores
Education had sizable correlations, r = .39–.45 (Table 2), with its polyfacet scores. The correlations between education polyfacet scores and EPS were .17 and .14, respectively, for self-ratings and informants’ ratings. 2 These correlations suggest that the association of EPS with the education-related aspects of personality, appropriately aggregated, was of nearly the same magnitude as its correlation with the phenotypic education itself (the correlations were not significantly different, p > .05). Table 2 also provides partial correlations among the variables (i.e., correlations adjusting for the other two correlations) to gauge the extent to which either education polyfacet scores accounted for the effect of EPS on education or, conversely, the extent to which education accounted for the effect of EPS on education polyfacet scores. The associations between EPS and both education and polyfacet score were attenuated but remained substantially greater than zero; thus, neither personality nor education was able to fully mediate the other’s polygenic influences. The correlations between the polyfacet scores for education and the similarly created polyfacet scores for EPS were .81, 95% CI = [.79, .82], and .79, 95% CI = [.78, .81], for self-ratings and informants’ ratings, respectively. These high correlations are consistent with the results presented in Table 1 and Figure 2, which show that correla-tions between facets and education closely mirrored those between facets and EPS (for LASSO regression coefficients used for creating polyfacet scores, see Table S2 in the Supplemental Material).
Zero-Order and Partial Correlations Between Education, Education Polyfacet Score, and Education Polygenic Score (EPS)

Note: Values in brackets are 95% confidence intervals.
Discussion
The results showed a systematic overlap between additive polygenic variance in education and personality. Although polygenic correlations between education and a limited number of traits were reported previously (Belsky et al., 2016; Okbay, Beauchamp, et al., 2016), we examined them across five FFM domains and their 30 facets, relying on one of the most comprehensive personality assessment frameworks currently available (McCrae & Costa, 2010). EPS correlated with several self-rated and informant-rated personality traits, especially those belonging to the neuroticism and openness domains, and the associations closely mirrored the correlations of the traits with phenotypic education.
Although individual correlations between personality traits and EPS were small in absolute scale, they must be interpreted in the appropriate context. For example, polygenic scores for traits such as subjective well-being, depressive symptoms, and neuroticism typically account for less than 1% of the variance in their respective traits (Okbay, Baselmans, et al., 2016). This is similar to how polygenic scores for a different phenotype, education, predicted some personality traits in this study. In addition, EPS was unlikely to capture full genetic variance in education and, therefore, in related personality traits. For example, the heritability of education has been estimated at more than 20% according to alternative procedures from genome-wide association studies (Marioni et al., 2014), whereas EPS could account for only 3% of education’s phenotypic variance. Moreover, when we aggregated facets according to their association with education, the resulting correlations with EPS were comparable with EPS’s correlation with education itself.
There are multiple ways to interpret such polygenic overlap. One possible explanation is that the same genetic variants independently influence both education and personality, perhaps through some unknown biological or environmental pathways (or both). In addition, experiences related to education may contribute to personality traits, and therefore genetic influences on education can account for some of the genetic variance in these traits. For example, certain genetic variants may predispose people to completing more years of schooling (e.g., via faster information processing or better physical health that allows for more engagement with education), which in turn may enhance people’s interests in aesthetic and intellectual experiences or contribute to disapproval of dishonesty. In both cases, the genetic etiology of personality is at least partly entangled with that of education. Alternatively, personality traits may mediate the genetic variance in education (Rimfeld et al., 2016). Some traits may predispose people to seek out more schooling, and their genetic influences can thereby account for some of the genetic variance in education, alongside any downstream consequences of this important life outcome, such as job success or health. If so, the polygenic influences previously linked with education pertain more proximally to personality traits than to education.
To assess the plausibility of these explanations, one could try to study people with no “exposure” to the hypothesized mediator (van Kippersluis & Rietveld, 2017). If the polygenic correlations observed between education and personality traits are absent in people without formal education, this would support the notion that education is the mediating phenotype in these associations. However, applying the same logic to examine the mediating role of personality traits would be problematic because personality traits are never absent; they only vary in degrees. In addition, specific genetic variants with known causal pathways to the hypothesized mediator could be used to disentangle causality (Davey Smith, 2010); at the moment, however, too few (if any) genetic variants with clear causal pathways to personality traits and education are known.
The associations of the 30 personality facets with EPS closely mirrored their associations with education itself. This may provide indirect evidence against the possibility that the genetic effects captured by EPS pertained only to personality traits, which then phenotypically transmitted these effects to education. If this were the case, there would be no reason to expect the correlations between EPS and facets to almost perfectly track those between education and facets. Of course, this similarity in the patterns of correlation could happen because of unmeasured mediators—for example, biological or parental characteristics, as well as other behavioral traits or life circumstances—linking EPS with both education and personality facets. We controlled only for age, sex, and genetic stratification. But even then, the genetic variance in personality would be entangled with that of education, and overlapping genetic variants would in part contribute independently to both. However, we would expect associations of EPS with facets to mirror associations of education with facets when both education and personality independently reflect the same genetic influences or when education mediates the genetic influences to personality.
Recently, Lo and colleagues (2017) provided evidence for sizable polygenic overlap between the FFM personality traits and a range of psychiatric phenotypes, as well as between the FFM traits themselves. There is also evidence for polygenic overlap between personality and some aspects of physical health, such as body mass index and heart disease, as well as health-relevant behaviors such as smoking (Gale et al., 2016). Most of these mental-health- and physical-health-related phenotypes also have polygenic correlations with education (Bulik-Sullivan et al., 2015; Okbay, Beauchamp, et al., 2016). Combined with our results, this pattern of findings can be interpreted in the light of the hypothesis that the observed genetic variance in personality traits may at least partly reflect a general genetic pull—genetic influences that act broadly across a range of phenotypes rather than specifically on what have been operationalized as personality traits (Turkheimer et al., 2014).
The partial entanglement of genetic variance in personality traits with genetic variance in education has implications beyond helping us to understand the etiology of the traits. First, attempts to delineate the specific genetic underpinnings of education or aspects of physical health may incidentally reveal the genetic mechanisms of phenotypically related personality traits. In addition, these phenotypes could be used as proxies to narrow the range of genetic variants that are potentially related to personality, as has been done for intelligence (Rietveld et al., 2014). Second, the genetic overlap needs to be factored into any attempts to interpret the phenotypic associations of personality traits with education and its associated characteristics, such as those reflecting socioeconomic success. Turkheimer and his colleagues (2014) argued that when associations of personality traits with other variables are investigated “our scientific hypotheses are usually phenotypic in nature” (p. 533). To the extent that genetic overlap is involved, there may be less of such phenotypic causation. The implications of our findings naturally stretch beyond the associations between personality traits and education. Genetic overlap should be considered for any phenomenon that is hypothesized to be either causal to behavioral traits or among their downstream consequences. For example, personality traits are phenotypically associated with obesity (Sutin, Ferrucci, Zonderman, & Terracciano, 2011), but these links may reflect genetic overlap (at least to some extent). With genetic data becoming widely available, researchers will be increasingly able to decompose phenotypic associations into genetic and nongenetic components.
In sum, the current study examined polygenic overlap between education and a range of personality traits and found clear evidence for such an overlap. There are various possible interpretations for this finding. In combination with recent evidence for genetic correlations between personality and various aspects of mental and physical health, the regularity with which the genetic and phenotypic associations between personality traits and education mirrored each other suggests that genetic influences on personality may not necessarily pertain to some personality-specific neurobiological structures. Instead, genetic variance in personality traits may reflect the results of a more general genetic influence-related pull. Moreover, it is possible that this general pull extends to other psychological traits not addressed in this study, such as attitudes, beliefs, or motivation. Psychological phenomena are ubiquitously heritable, but they may not be aligned with distinct etiological mechanisms.
Footnotes
Acknowledgements
We thank researchers of the Social Science Genetic Association Consortium for carrying out the meta-analysis of genome-wide association studies on years of education that did not contain Estonian data.
Action Editor
Brent W. Roberts served as action editor for this article.
Declaration of Conflicting Interests
The authors declared that they had no conflicts of interest with respect to their authorship or the publication of this article.
Funding
This study was funded by Estonian Research Council Grants IUT20-60, IUT2-13, and PUT1660; EU Horizon 2020 Grant 692145; and European Regional Development Fund Project 2014-2020.4.01.15-0012. U. Vainik was supported by Personal Postdoctoral Research Funding Project PUTJD654.

Notes
References
Supplementary Material
Please find the following supplemental material available below.
For Open Access articles published under a Creative Commons License, all supplemental material carries the same license as the article it is associated with.
For non-Open Access articles published, all supplemental material carries a non-exclusive license, and permission requests for re-use of supplemental material or any part of supplemental material shall be sent directly to the copyright owner as specified in the copyright notice associated with the article.
