



Abstract
When object A moves adjacent to a stationary object, B, and in that instant A stops moving and B starts moving, people irresistibly see this as an event in which A causes B to move. Real-world causal collisions are subject to Newtonian constraints on the relative speed of B following the collision, but here we show that perceptual constraints on the relative speed of B (which align imprecisely with Newtonian principles) define two categories of causal events in perception. Using performance-based tasks, we show that triggering events, in which B moves noticeably faster than A, are treated as being categorically different from launching events, in which B does not move noticeably faster than A, and that these categories are unique to causal events (Experiments 1 and 2). Furthermore, we show that 7- to 9-month-old infants are sensitive to this distinction, which suggests that this boundary may be an early-developing component of causal perception (Experiment 3).
The human mind evolved in an environment that contained certain physical regularities. Some of those regularities are reflected in the adult perceptual system, as well as in core knowledge, that is, early-developing sets of expectations about the world that shape perception, learning, and cognition from infancy (Carey, 2009; Spelke & Kinzler, 2007). The influence of real-world physical constraints on core knowledge and adult perception is most obvious for the domain of physical objects. For example, from early infancy, people expect objects to obey certain physical principles, such as spatiotemporal continuity (i.e., objects do not move between two locations without traversing the space in between), and expect individual objects to be cohesive by maintaining single bounded contours (Spelke, Breinlinger, Macomber, & Jacobson, 1992). These same principles that seem to be part of core knowledge of objects also constrain the perceptual processing of objects in adulthood (e.g., Scholl & Pylyshyn, 1999; vanMarle & Scholl, 2003). For example, moving objects that obey the principle of continuity (but not those that do not) serve as natural “units” of attention (Flombaum & Scholl, 2006; Scholl, 2001).
Notably, these results need not imply the existence of some kind of “physics engine” in perception (Ullman, Spelke, Battaglia, & Tenenbaum, 2017). Rather, such results could simply reflect the fact that the input the visual system has received from the world over the course of evolution has been constrained in particular ways by physics (McIntyre, Zago, Berthoz, & Lacquaniti, 2001). However, there are many physical constraints on the environment that are much more sophisticated than simple continuity or cohesion. In particular, the physical constraints on interactions between objects may have shaped the sensitivity of the visual system to certain specific properties of such interactions. We propose that a perceptual constraint combined with a real-world physical regularity creates a categorical distinction in the perception of causal collision events.
Causal Perception
Imagine a simple event involving two objects, such as the one rendered schematically in Figure 1a (for an animation, see jfkominsky.com/CategoricalConstraints.html). In this event, object A moves until it is directly adjacent with object B, at which point A immediately stops and B begins moving in the same direction. As long as certain spatiotemporal constraints are satisfied (cf. Figs. 1b–1c), observers irresistibly perceive this launching event as involving a causal relationship; that is, A causes B to move (Michotte, 1946/1963; Scholl & Tremoulet, 2000). Critically, observers truly perceive causality in this event. Although this is not the venue for a comprehensive review of the historical debate on this point, causal judgments and causal perception can be dissociated empirically (Schlottmann & Shanks, 1992; cf. Rips, 2011), and launching events are subject to uniquely perceptual effects (e.g., Moors, Wagemans, & de-Wit, 2017), including retinotopically specific visual adaptation (Rolfs, Dambacher, & Cavanagh, 2013). Furthermore, causal perception is early developing, emerging by 6 months of age (Leslie & Keeble, 1987) or earlier (Mascalzoni, Regolin, Vallortigara, & Simion, 2013).

Causal perception. The classic example of causal perception is the launching event (a), in which observers automatically and irresistibly perceive that the first object, A, causes the second object, B, to move. This percept can be disrupted by introducing (b) a spatial offset or (c) a temporal offset, or (d) by having the objects appear to slip past each other without making contact.
Real-world collision events obey Newtonian constraints. One little-known consequence of Newton’s third law is that, regardless of the relative masses of objects A and B, the force of the collision alone can never result in B moving at more than double the speed of A (see the Supplemental Material available online for a mathematical proof). This rule provides an absolute limit to B’s speed, but because of air resistance, friction, and imperfect collisions, events in which object B moves at all faster than object A are physically (and empirically) unlikely in the natural environment, except in cases in which B is self-propelled. For similar reasons, events in which B moves slower than A are very likely (Runeson, 1983). Thus, events in which B moves faster than A are both unexpected and an indication that some unseen forces are acting on B.
Early work on causal perception suggested that people are sensitive to this asymmetry. Observers categorized causal collision events in which B moved detectably faster than A after contact as “triggering” or “releasing,” rather than “launching,” but they often categorized events in which A moved as much as three times the speed of B as “launching” (Boyle, 1960; Michotte, 1946/1963; Natsoulas, 1961, cf. Sanborn, Mansinghka, & Griffiths, 2013). However, these explicit reports indicate the existence of a distinction between launching and triggering in causal judgment, but they do not directly address whether there is actually a distinction in causal perception.
If perception is sensitive to this categorical distinction between causal events, one would expect perception to treat causal collision events in which B moves detectably faster than A as qualitatively different from other causal events. For example, events in which A’s speed is one third that of B (i.e., events with a speed ratio of 1:3) should be seen as categorically different from events in which A and B have the same speed (e.g., events with a speed ratio of 1:1). However, no such boundary should exist between events with equally different speed ratios if B moves slower than A (e.g., 1:1 events vs. 3:1 events). Such a distinction not only may be present in adults’ causal perception, but also may be an aspect of core causal perception that is present from infancy. We designed three experiments to test these hypotheses with adult observers (Experiments 1 and 2) and preverbal infants (Experiment 3).
In Experiment 1, we devised a visual search task based on the logic that this proposed categorical boundary when B moves detectably faster than A should lead to oddball effects. Among an array of 1:1 and 3:3 causal collision events, a 1:3 causal collision event should be easily detectable because it is an oddball belonging to a different perceptual event category, whereas a 3:1 causal collision event should be less detectable. Thus, in Experiment 1a, we compared search for 1:3 events with search for 3:1 events among 1:1 and 3:3 events. We expected that this sensitivity to the speed ratio would apply only to causal collision events, and not to minimally matched noncausal events in which two objects moved independently (and therefore the Newtonian speed limit did not apply). Moreover, if this advantage for finding 1:3 causal collision events is genuinely an oddball effect due to a categorical boundary rather than to 1:3 events simply standing out on their own, then a 1:1 event or a 3:3 event should be easier to detect in an array of 1:3 events than in an array of 3:1 events. We tested this prediction in Experiment 1b.
Experiment 1a
Method
Stimuli and procedure
To test whether perception distinguishes causal collision events in which B moves faster than A from causal collision events in which B does not move faster than A, we designed a visual search task in which the search array consists of a set of two-object events like those in Figure 1. If the target event violates the Newtonian speed-ratio constraint and the distractor events do not, then the target event should stand out as an oddball. So, if the distractor events in a search array are all symmetric 1:1 (or 3:3) events that adhere to this Newtonian constraint, and the target event is an asymmetric event that violates this constraint (e.g., a 1:3 event), then the target event should be easier to find (detected more quickly) than an equally asymmetric target event that does not violate this constraint (e.g., a 3:1 event). However, this advantage should hold only for cases in which the Newtonian limit could apply (i.e., causal collision events), and not when both objects in the event appear to move independently.
We designed four conditions: causal, temporal offset, spatial offset, and slip event. All stimuli were presented on a 2010 11-in. MacBook Air running MATLAB and the Psychophysics Toolbox (Brainard, 1997). In every condition, subjects saw three pairs of discs, separated by vertical lines, on each trial. Figure 2 shows a diagram (not to scale) of a display sequence. Each disc subtended 0.6° of visual angle (at a viewing distance of 60 cm), and at the start of a trial, the two discs in each pair were separated by 2.4° of visual angle. The midpoints of adjacent pairs were separated by 10° of visual angle. In the spatial-offset condition, the bottom of the left disc in each pair was vertically offset from the top of the right disc by 0.6° of visual angle; in the other conditions, the two discs in each pair were on a shared horizontal axis.
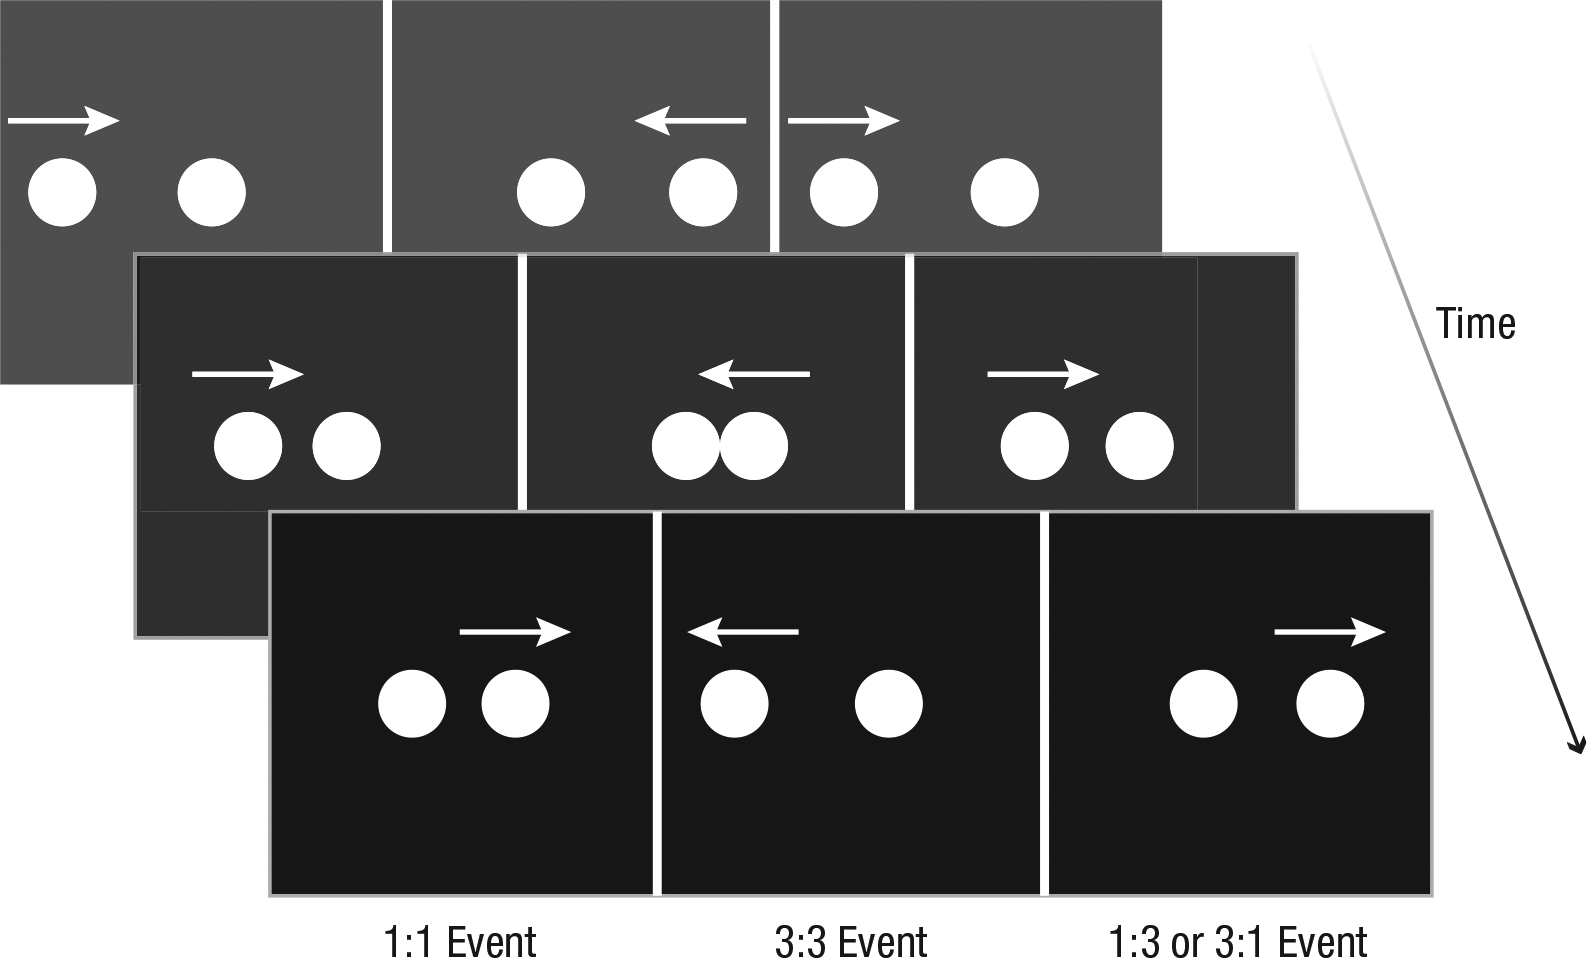
Schematic illustration of a trial in the causal condition of Experiment 1. Three events were presented side by side in a loop that repeated until subjects responded. Subjects had to find the event in which the two discs moved at different speeds relative to each other. In half of the trials, this target event was a 1:3 event (i.e., the speed of the disc that moved first was one third the speed of the disc that moved second); in the other half, it was a 3:1 event.
In all conditions except the slip-event condition, one disc in each pair began moving toward the x-coordinate of the other disc in that pair, until the two discs were adjacent on the x-axis. In the slip-event condition, the first disc moved until it was fully overlapping with the second, and then continued moving until it was adjacent to the disc on the opposite side (see Fig. 1d). In the causal, spatial-offset, and slip-event conditions, the first disc then stopped, and the other disc in the pair immediately began moving in the same direction (in the slip-event condition, this meant passing through the first disc). In the temporal-offset condition, both discs were stationary for 300 ms before the second one began moving. In all conditions, the second disc moved until the two discs were once again horizontally separated by 2.4° of visual angle, at which point it stopped and both discs were stationary for 200 ms. After this pause, the animation repeated in the opposite direction (i.e., what was previously the second disc moved toward what was previously the first disc, etc.).
In every condition, the two discs within two of the pairs moved at the same speed. In one of these pairs, both discs moved at 9° per second (3:3 event), and in the other, both moved at 3° per second (1:1 event). In the third pair, one disc moved at 9° per second, and the other at 3° per second. On 1:3 trials, the approaching disc moved at 3° per second, and on 3:1 trials, it moved at 9° per second. All three events started at the same time, so the collision happened sooner for events in which the first object moved at 9° per second, and after the first collision, the three events were completely decoupled. (This fact actually worked against our hypotheses, because subjects were exposed to the speed difference earlier in the 3:1 events than in the 1:3 events.)
Subjects were instructed to press the space bar as soon as they detected the pair in which the two discs were moving at different speeds (i.e., the asymmetric event). After they pressed the space bar, the animation paused, and they used the mouse cursor to select the asymmetric event. This procedure ensured that subjects had to locate the target event before pressing the space bar in order to respond accurately.
For the causal, temporal-offset, and spatial-offset conditions, the experiment included 96 trials per condition: 8 repetitions of each possible combination of target-event speed ratio (1:3 vs. 3:1), target-event location (left vs. middle vs. right), and distractor locations (1:1 distractor event left vs. right of 3:3 distractor event). In the slip-event condition, we included 10 repetitions of each of these combinations, for a total of 120 trials, because this condition was designed after the other three had started, and we felt subjects could complete the additional trials in the allotted time (analyses using only the first 96 trials of the slip-event condition yielded results qualitatively identical to those reported here). All trials in all conditions were presented in fully random order. The conditions were run entirely between subjects.
Subjects
On the basis of effect sizes observed in in-lab pilot testing, we estimated that each of our four conditions would require approximately 12 subjects; we recruited 85 subjects from the New Haven, Connecticut, area with the goal of meeting that target after applying our exclusion criterion (see the next section). Because subjects were recruited before we were able to check whether they passed this criterion, we exceeded our target for some conditions and elected to include all valid data in our analyses rather than arbitrarily exclude subjects. All subjects were over 18 years old, gave informed consent, and were compensated with either $5 or a half-hour of course credit for a roughly 30-min study.
Results
Exclusions
Subjects were excluded if they failed to select the correct target event on more than 50% of the trials. Across all four conditions, we excluded 28 subjects for this reason. In addition, we excluded 1 subject who failed to complete the experiment and 3 who participated in more than one condition of the experiment because of experimenter error. In total, 32 subjects (roughly 38% of all those recruited) were excluded from analyses.
Success in identifying the correct event on at least 50% of the trials was an easy and objective test of whether subjects understood the task and were able to perform it accurately (mere chance responding would result in 33% accuracy). It is somewhat surprising that so many subjects failed this criterion. We can offer no definitive explanation, but present two likely contributing factors. The first is that some subjects may have failed to understand the instructions and therefore did not know what kind of target event they were looking for. We endeavored to address this concern in Experiment 1b by adding practice trials. The other possibility is that some subjects genuinely might not have been able to detect the asymmetric events (e.g., some subjects spontaneously reported, “they all look the same”; see Experiment 2 for further investigation of the ability to detect speed asymmetries).
Our final sample consisted of 13 subjects in the causal condition, 14 each in the temporal- and spatial-offset conditions, and 12 in the slip-event condition. In addition, prior to analyzing group effects on reaction time (RT), we excluded individual trials in which subjects selected the incorrect event or their RT was more than 2.5 SD from their average RT on trials they responded to correctly.
Reaction times
We averaged the RTs for each target-event speed ratio for each subject. A 4 (condition: causal vs. spatial offset vs. temporal offset vs. slip event; between subjects) × 2 (speed ratio: 1:3 vs. 3:1; within subjects) mixed-model analysis of variance (ANOVA) revealed a significant interaction between condition and speed ratio, F(3, 49) = 3.48, p = .023, η p 2 = .176. We then analyzed the effect of speed ratio separately in each condition using paired-samples t tests (see Fig. 3). As predicted, subjects in the causal condition were significantly faster to detect the 1:3 (triggering) event (M = 4.13 s, SD = 2.31) compared with the 3:1 event (M = 4.86 s, SD = 2.70), t(12) = 3.751, p = .003, d = 0.253, 95% confidence interval (CI) for d = [0.094, 0.413]. (Cohen’s d for t tests and CIs were calculated using the R package metafor; Viechtbauer, 2010.) In contrast, subjects showed no significant effect of speed ratio in the spatial-offset condition (1:3 events: M = 4.12 s, SD = 1.37; 3:1 events: M = 4.25 s, SD = 1.63), t(13) = 0.779, p = .45; the temporal-offset condition (1:3 events: M = 4.50 s, SD = 3.07; 3:1 events: M = 4.35 s, SD = 2.54), t(13) = 0.833, p = .42; or the slip-event condition (1:3 events: M = 5.26 s, SD = 2.12; 3:1 events: M = 5.69 s, SD = 1.56), t(11) = 1.52, p = .158.
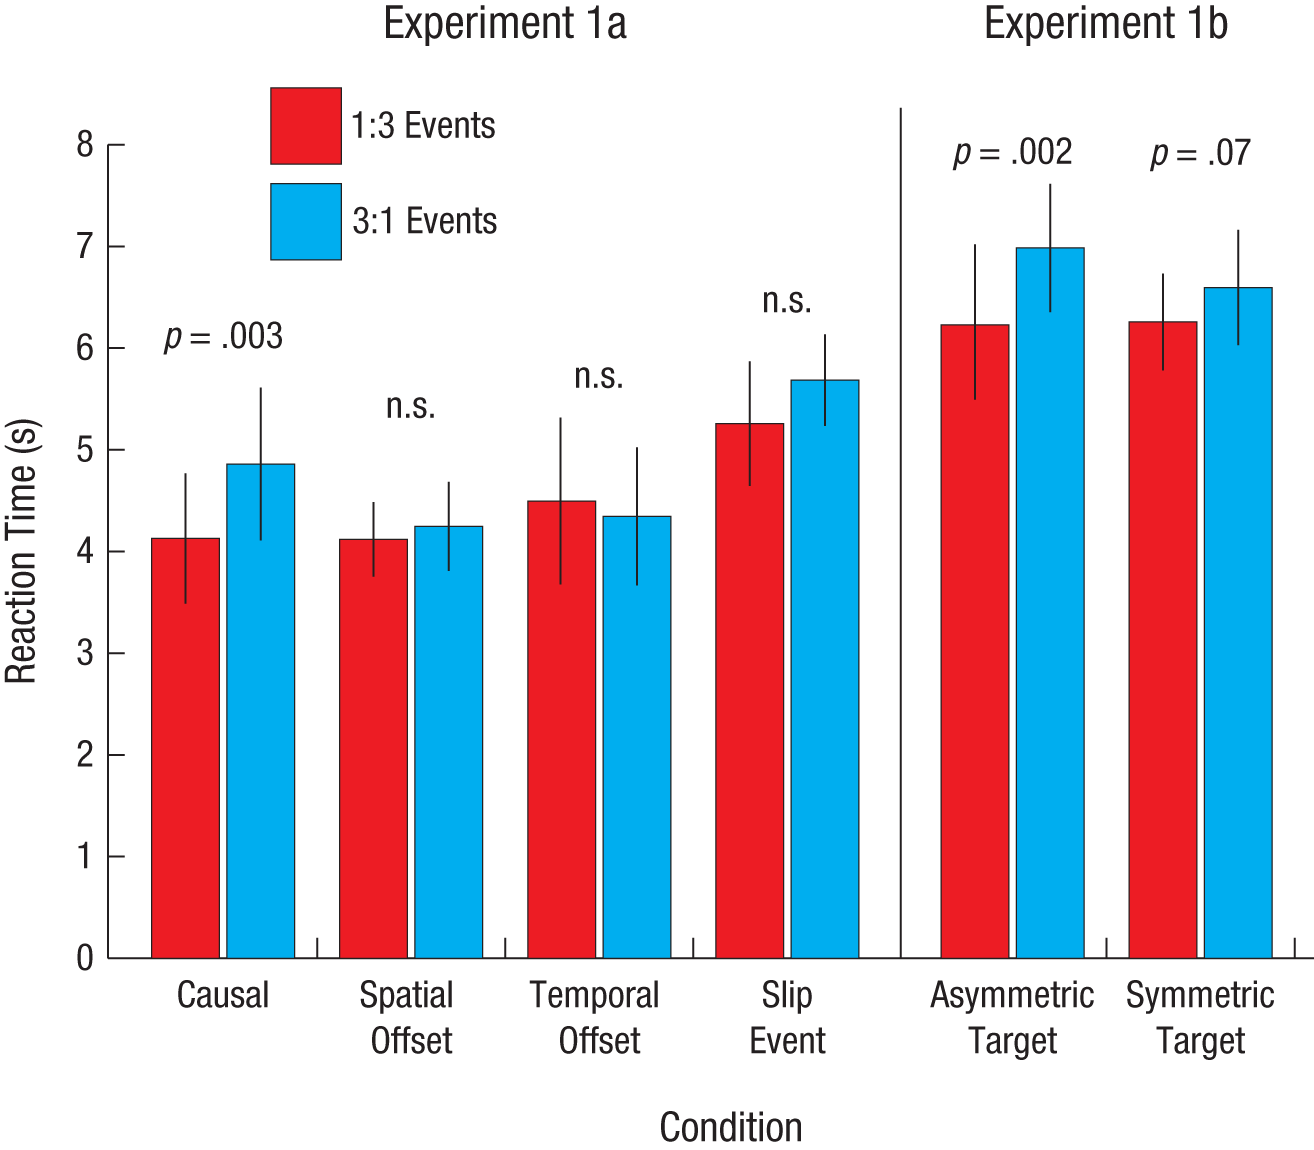
Results of Experiments 1a and 1b. Reaction time in each condition, separately for trials with speed ratios of 1:3 and 3:1. Error bars represent ±1 SEM.
We further tested whether causality interacted significantly with speed ratio, using a separate 2 (condition type: causal vs. noncausal) × 2 (speed ratio: 1:3 vs. 3:1) mixed-model ANOVA for each noncausal condition. The analysis of the causal and spatial-offset conditions showed a significant interaction, F(1, 25) = 5.63, p = .026, η p 2 = .184, as did the analysis of the causal and temporal-offset conditions, F(1, 25) = 11.04, p = .003, η p 2 = .306. However, the interaction in the analysis of the causal and slip-event conditions was not significant, F(1, 23) = 0.80, p = .379.
To further understand the nonsignificant result of the comparison between the causal and slip-event conditions, we conducted additional post hoc 2 × 2 mixed-model ANOVAs comparing the slip-event condition with the other noncausal conditions. We found no significant interaction when comparing the slip-event condition with either the spatial-offset condition, F(1, 24) = 0.90, p = .353, or the temporal-offset condition, F(1, 24) = 3.15, p = .089.
In short, the slip-event condition showed no significant advantage for 1:3 over 3:1 target events on its own, but the magnitude of the raw (nonsignificant) RT difference did not differ significantly from that of any other condition—neither the causal condition, which showed the advantage, nor the other noncausal conditions, which did not. Although these results are inconclusive, we take them as indicating that, if there is truly any advantage for locating 1:3 over 3:1 slip events, it is at least less reliable than the advantage we found for causal events, even if it is not significantly different in magnitude. However, the properties of the slip event may be worth more thorough investigation in future work, as to our knowledge this is only the second time it has been used in studies of causal perception (Rolfs et al., 2013).
Accuracy
We also analyzed accuracy by subjects, to ensure that the RT results did not simply reflect a speed-accuracy trade-off. We analyzed raw accuracy, with no trials excluded because of RT, in a 4 (condition) × 2 (speed ratio) mixed-model ANOVA and found no main effects and no interaction, all ps > .5. Subjects were equally accurate in the causal condition (M = .88, SD = .13), spatial-offset condition (M = .91, SD = .13), temporal-offset condition (M = .90, SD = .13), and slip-event condition (M = .91, SD = .11), and were equally accurate for 1:3 events (M = .90, SD = .13) and 3:1 events (M = .90, SD = .11). To further determine whether a speed-accuracy trade-off could account for our results, we conducted a separate by-subject analysis of accuracy by speed ratio for each condition. In the causal condition, the only condition with an RT effect, responses were equally accurate for 1:3 events (M = .87, SD = .34) and 3:1 events (M = .88, SD = .32), t(12) = 0.43, p = .67. There was also no difference in the spatial-offset condition (1:3 events: M = .91, SD = .10; 3:1 events: M = .91, SD = .09), t(13) = 0.53, p = .61; the temporal-offset condition (1:3 events: M = .90, SD = .15; 3:1 events: M = .90, SD = .12), t(13) = 0.26, p = .797; and the slip-event condition (1:3 events: M = .92, SD = .09; 3:1 events: M = .90, SD = .09), t(11) = 1.24, p = .24. Put simply, the difference in RTs between 3:1 and 1:3 events, and the interaction of speed ratio with condition, cannot be accounted for by a speed-accuracy trade-off.
Experiment 1b
Method
Stimuli and procedure
To investigate whether the results of Experiment 1a indicate that there is a categorical boundary between 1:3 events and symmetric events, rather than that 1:3 causal events are simply more prominent than other causal events in any circumstance, we tested whether 1:1 and 3:3 causal events are easier to detect in an array of 1:3 events than in an array of 3:1 events. The stimuli were identical to those used in the causal condition in Experiment 1a, but were adapted to run in a Web browser using the Qualtrics online survey system (Qualtrics, 2005) and the GreenSock TimelineMax javascript animation library (GreenSock, Inc., 2015). The only visual difference was that the events involved black discs on a white background instead of white discs on a black background, and the discs were slightly larger. (Variation in the resolution of subjects’ computer monitors and in viewing distance means that subjects may have seen discs that were bigger or smaller than those in Experiment 1a, but this was not expected to matter.)
There were only two conditions, an asymmetric-target condition, identical to the causal condition in Experiment 1a, and a symmetric-target condition. In the symmetric-target condition, subjects were instructed to find the symmetric (causal) event among two asymmetric (causal) events. The target symmetric event could be either a 1:1 or a 3:3 event, and the asymmetric distractor events were either both 1:3 or both 3:1 events. To prevent the asymmetric events from syncing up and giving an impression of common motion, we started the three events in each trial of both conditions at (separately determined) random points in their animation.
Subjects still responded using the space bar, but instead of clicking on the target event, they pressed a number key (“1,” “2,” or “3”) to indicate which event was the target event. In an attempt to compensate for the fact that there would be no experimenter reading the instructions to the subjects, we added four training items with feedback to the start of the experiment. For these training items, subjects were not allowed to proceed to the next trial until they had selected the correct option.
Subjects
Subjects were Amazon Mechanical Turk (MTurk) workers. All were over the age of 18, were located in the United States, and with lifetime MTurk work approval rates greater than 90%. We anticipated noisier RT data than in Experiment 1a because the study was run in a Web browser and because subjects completed the study in their own home rather than a controlled lab environment, so we doubled our target sample size. Recruitment continued until there were 24 subjects in each condition who passed the exclusion criterion (N = 48). Approximately 28% of the 67 recruited subjects were excluded because they failed to meet the accuracy cutoff (n = 17) or because Qualtrics unexpectedly failed to record their RTs (n = 2). Subjects were paid $2 for a study that took most of them less than 20 min to complete.
Results
Reaction times
Individual trials were excluded using the same criteria as in Experiment 1a. Preliminary analyses indicated that there was no effect of target-event speed ratio (1:1 vs. 3:3) in the symmetric-target condition, so we collapsed across this variable for the primary analysis. This allowed us to conduct a 2 (condition: asymmetric target vs. symmetric target) × 2 (asymmetric speed ratio: 1:3 vs. 3:1) mixed-model ANOVA. Regardless of condition, subjects were significantly faster to respond when the speed ratio of the asymmetric events was 1:3 (M = 6.24 s, SD = 3.09) than when it was 3:1 (M = 6.79 s, SD = 2.92), F(1, 46) = 11.319, p = .002, η p 2 = .197. However, there was no main effect of condition, F(1, 46) = 0.044, p = .835, and no interaction, F(1, 46) = 1.647, p = .206.
We conducted planned paired-samples t tests to examine the effect of asymmetric speed ratio in each condition. The results of Experiment 1a were replicated: Subjects in the asymmetric-target condition were significantly faster to locate 1:3 target events (M = 6.23 s, SD = 3.74) than 3:1 target events (M = 6.98 s, SD = 3.09), t(23) = 2.787, p = .01, d = 0.237, 95% CI = [0.085, 0.389]. In the symmetric-target condition, there was no significant advantage for finding 1:1 or 3:3 events among 1:3 events (M = 6.26 s, SD = 2.33) compared with finding them among 3:1 events (M = 6.60 s, SD = 2.78), t(23) = 1.885, p = .072, d = 0.063, 95% CI = [−0.239, 0.365]. From the RT results alone, it appeared that there might be no oddball effect (or only a marginal effect) in the symmetric-target condition, but the analysis of accuracy suggested otherwise.
Accuracy
The 2 subjects for whom Qualtrics failed to record RT data achieved above-threshold accuracy, so we included them in our accuracy analysis (n = 1 in each condition). (Analyses of accuracy excluding these 2 subjects yielded results qualitatively identical to those reported here.) We conducted a 2 (condition: asymmetric target vs. symmetric target) × 2 (asymmetric speed ratio: 1:3 vs. 3:1) mixed-model ANOVA, which revealed no effect of condition, F(1, 48) = 1.70, p = .198, but a significant main effect of asymmetric speed ratio, F(1, 48) = 11.58, p = .001, η p 2 = .194, and a significant interaction, F(1, 48) = 10.01, p = .003, η p 2 = .173.
To explore this interaction further, we conducted paired-samples t tests examining the effect of asymmetric speed ratio in each condition. In the asymmetric-target condition, as in Experiment 1a, subjects were not significantly more or less accurate at finding 1:3 events (M = .88, SD = .16) compared with 3:1 events (M = .87, SD = .15), t(24) = 0.19, p = .85. However, in the symmetric-target condition, subjects were significantly better at finding the symmetric event when the distractors were 1:3 events (M = .86, SD = .15) than when the distractors were 3:1 events (M = .77, SD = .17), t(24) = 4.22, p < .001, d = 0.532, 95% CI = [0.245, 0.819].
This is the only instance in which we found a significant effect on accuracy, and it indicates two things. First, it supports the hypothesis that there is a genuine categorical boundary between 1:3 causal collision events and symmetric causal collision events (i.e., 1:3 events do not simply “stand out” on their own). Second, and more decisively, it demonstrates that 3:1 causal collision events are not easily distinguished from symmetric causal collision events, as it was clearly more difficult to distinguish symmetric events from 3:1 events than from 1:3 events. It is unclear why we found this effect on accuracy in only this condition, but in fact it is even stronger evidence that there is a perceptual distinction between triggering events and launching events, but not between symmetric launching events and 3:1 launching events.
Discussion
Experiment 1 demonstrated that adults’ causal perception distinguishes between triggering and launching events. Causal collision events with a 1:3 speed ratio were easily distinguished from those with symmetric speed ratios, but 3:1 causal collision events were not as easily distinguished from symmetric causal collision events, despite being equally different from symmetric events in objective terms. Critically, there was no such asymmetry for noncausal events. These performance-based results provided initial evidence that causal perception, independently of judgment or reasoning, is sensitive to a distinction between launching and triggering.
Experiment 2
Although Newtonian physics imposes a 1:2 limit on launching events under ideal conditions, the real world is very rarely ideal. Rather, as Michotte (1946/1963) put it, the impression of triggering likely emerges whenever “the speed of B [becomes] noticeably greater than that of A” (p. 109). Thus, causal events in which B moves noticeably faster than A, but below the 1:2 limit, may still be perceived as triggering events.
However, the perceptual constraints on detecting speed differences in launching events are unknown. Research with moving Gabor patches suggests that speed ratios as low as 1:1.06 can be distinguished from a speed ratio of 1:1 (J. F. Brown, 1931; Orban, Van Calenbergh, De Bruyn, & Maes, 1985; Traschütz, Zinke, & Wegener, 2012; Werkhoven, Snippe, & Alexander, 1992), but research on single moving objects suggests a range of detection thresholds anywhere between 1:1.4 and 1:4 for a given observer (Calderone & Kaiser, 1989; Watamaniuk & Heinen, 2003). No studies have explicitly examined speed discrimination in events involving two objects.
The goal of Experiment 2 was therefore twofold. First, starting from Michotte’s (1946/1963) assertion that triggering requires only a noticeable increase in B’s speed, we wanted to establish what changes are “noticeable” in this context. Understanding this perceptual constraint would lead to clear predictions about the speed ratios that might produce an advantage for causal collision events, such as the advantage we found in Experiment 1. For example, it would not be worth investigating whether 1:1.5 causal events are seen as triggering events if the difference in speeds is not detectable in isolation.
Second, we wished to rule out a low-level perceptual-differences account of the results of Experiment 1. The advantage for 1:3 causal events could have arisen because of a general advantage for 1:3 events, in combination with, for example, greater ease in processing or extracting speed information from causal events, compared with noncausal events. In other words, this account suggests that there may be an advantage for locating slow:fast noncausal events, as well as slow:fast causal events, but that with our stimuli, this advantage was masked by differences in how the speeds of the objects were perceived in noncausal events because of differences in low-level features unrelated to the causal status of the events. For an extreme example, consider an array of events in which one object in each pair is projected onto the floor and the other object is projected onto the ceiling. We would expect the advantage for finding 1:3 events to be diminished or eliminated in such a case simply because it would be difficult to compare the speeds of the objects. This low-level account of the results obtained in Experiment 1 predicts that the ability to detect a difference in the speeds of two objects differs between isolated causal and noncausal events.
Therefore, we directly tested sensitivity to speed differences in causal and noncausal events, for events in which A moved faster than B and events in which A moved slower than B, and for a range of speed multipliers (for both A and B) above and below 2. We designed a task in which subjects judged the relative speed of two objects in serially presented single events.
Method
Subjects
This experiment was run online using MTurk. Workers who had participated in Experiment 1b were excluded, but otherwise we used the same recruitment criteria (location and previous work approval rate) as in Experiment 1b. We aimed to recruit 24 subjects who passed our exclusion criterion (see the next section). This required recruiting 34 subjects, who were paid $6.50 for a task that took approximately 40 min.
Stimuli and procedure
The stimuli in this experiment were constructed in the same way as in Experiment 1b, and were very similar to those stimuli except that there was only one event on the screen at any given time, instead of three. All of the events were two-object events, in which the two discs (A and B) could move either at the same speed or at different speeds, and this varied across trials (but not within a trial). Subjects were told that they would see one event at a time, and they would have to determine whether the two discs in the event moved at the same speed, in which case they should press the “F” key, or at different speeds, in which case they should press the “J” key. Each event played in a loop until subjects made a response, and as soon as a key press was detected, the experiment advanced to the next trial.
There was a block of causal events and a block of noncausal, spatial-offset events; block order was counterbalanced across subjects. In the causal block, all trials were causal events like those in Experiment 1b. The noncausal block, which was similar to the spatial-offset condition of Experiment 1a, was identical to the causal block except that, in every event, there was a vertical offset between the closest edges of the two discs equal to the diameter of one disc (as in the spatial-offset condition of Experiment 1a; see Fig. 1b).
In each block, there were three categories of trials: matching-speed trials, slow:fast trials (A moved slower than B), and fast:slow trials (A moved faster than B). These three categories were crossed with five speed multipliers: 1.5, 1.75, 2, 2.25, and 2.5. Thus, there were five different types of slow:fast trials (speed ratios of 1:1.5, 1:1.75, 1:2, 1:2.25, and 1:2.5), five types of fast:slow trials (speed ratios of 1.5:1, 1.75:1, etc.), and five types of matching-speed trials (speed ratios of 1.5:1.5, 1.75:1.75, etc.). In addition, there was a set of 1:1 events, which were included to ensure that subjects could not immediately determine whether the two objects moved at the same or different speeds on the basis of the speed of either object alone. There were eight repetitions of each of these 16 trial types, for a total of 128 test trials in each block. In addition, 1:3, 3:1, and 3:3 trials were presented eight times each in each block and used for purposes of exclusion: If subjects were less than 50% accurate on these trials (in either block), they were excluded from analyses and replaced. Note that 10 of 34 subjects (29%) were excluded by this criterion, which suggests that some individuals might not easily detect speed differences even when the ratio is as high as 1:3 or 3:1. Thus, some of the exclusions in Experiment 1 may have been the result of the same inability to detect differences in speed, even of this magnitude.
Trials within each block were presented in fully random order, and each block was preceded by four training trials (two matching-speed trials, one slow:fast trial, one fast:slow trial), in which subjects received feedback on their answers.
Results
Analytic strategy
Our primary dependent variable was subjects’ sensitivity to differences in speed, which was measured using the d′ sensitivity index from signal detection theory. We calculated d′ separately for each asymmetric event type and each speed multiplier for each subject. Computing d′ requires identifying hits, misses, and false alarms, which we defined as follows: Hits were correct, “different speed,” responses on asymmetric trials (i.e., slow:fast and fast:slow trials), misses were “matching speed” responses on asymmetric trials, and false alarms were “different speed” responses on matching-speed trials.
One issue with d′ is that it becomes indeterminate when there is extreme sensitivity or insensitivity, that is, if either the hit rate or the false alarm rate is exactly 0 or 1. When these values occurred, they were corrected by 0.0625 in the appropriate direction (i.e., half the effect of responding correctly or incorrectly on one trial). This is a common correction for data of this sort (G. S. Brown & White, 2005; Murdock & Ogilvie, 1968).
Noticeable differences in speed
Figure 4 presents the average d′ values for slow:fast and fast:slow trials in the two conditions. We conducted a 2 (condition: causal vs. noncausal) × 2 (trial type: slow:fast vs. fast:slow) × 5 (speed multiplier: 1.5 vs. 1.75 vs. 2 vs. 2.25 vs. 2.5) repeated measures ANOVA on these values. We found a main effect of speed multiplier, F(4, 92) = 28.34, p < .001, η p 2 = .552, but no interaction between speed multiplier and condition, F(4, 92) = 1.03, p = .39, or between speed multiplier and trial type, F(4, 92) = 0.80, p = .53, and no three-way interaction, F(4, 92) = 0.51, p = .72. These results indicate that the effect of speed multiplier was consistent across causal and noncausal events, and across slow:fast and fast:slow events. Therefore, to analyze the effect of speed multiplier, we collapsed across conditions and trial type and conducted post hoc comparisons on the resulting average d′ values.
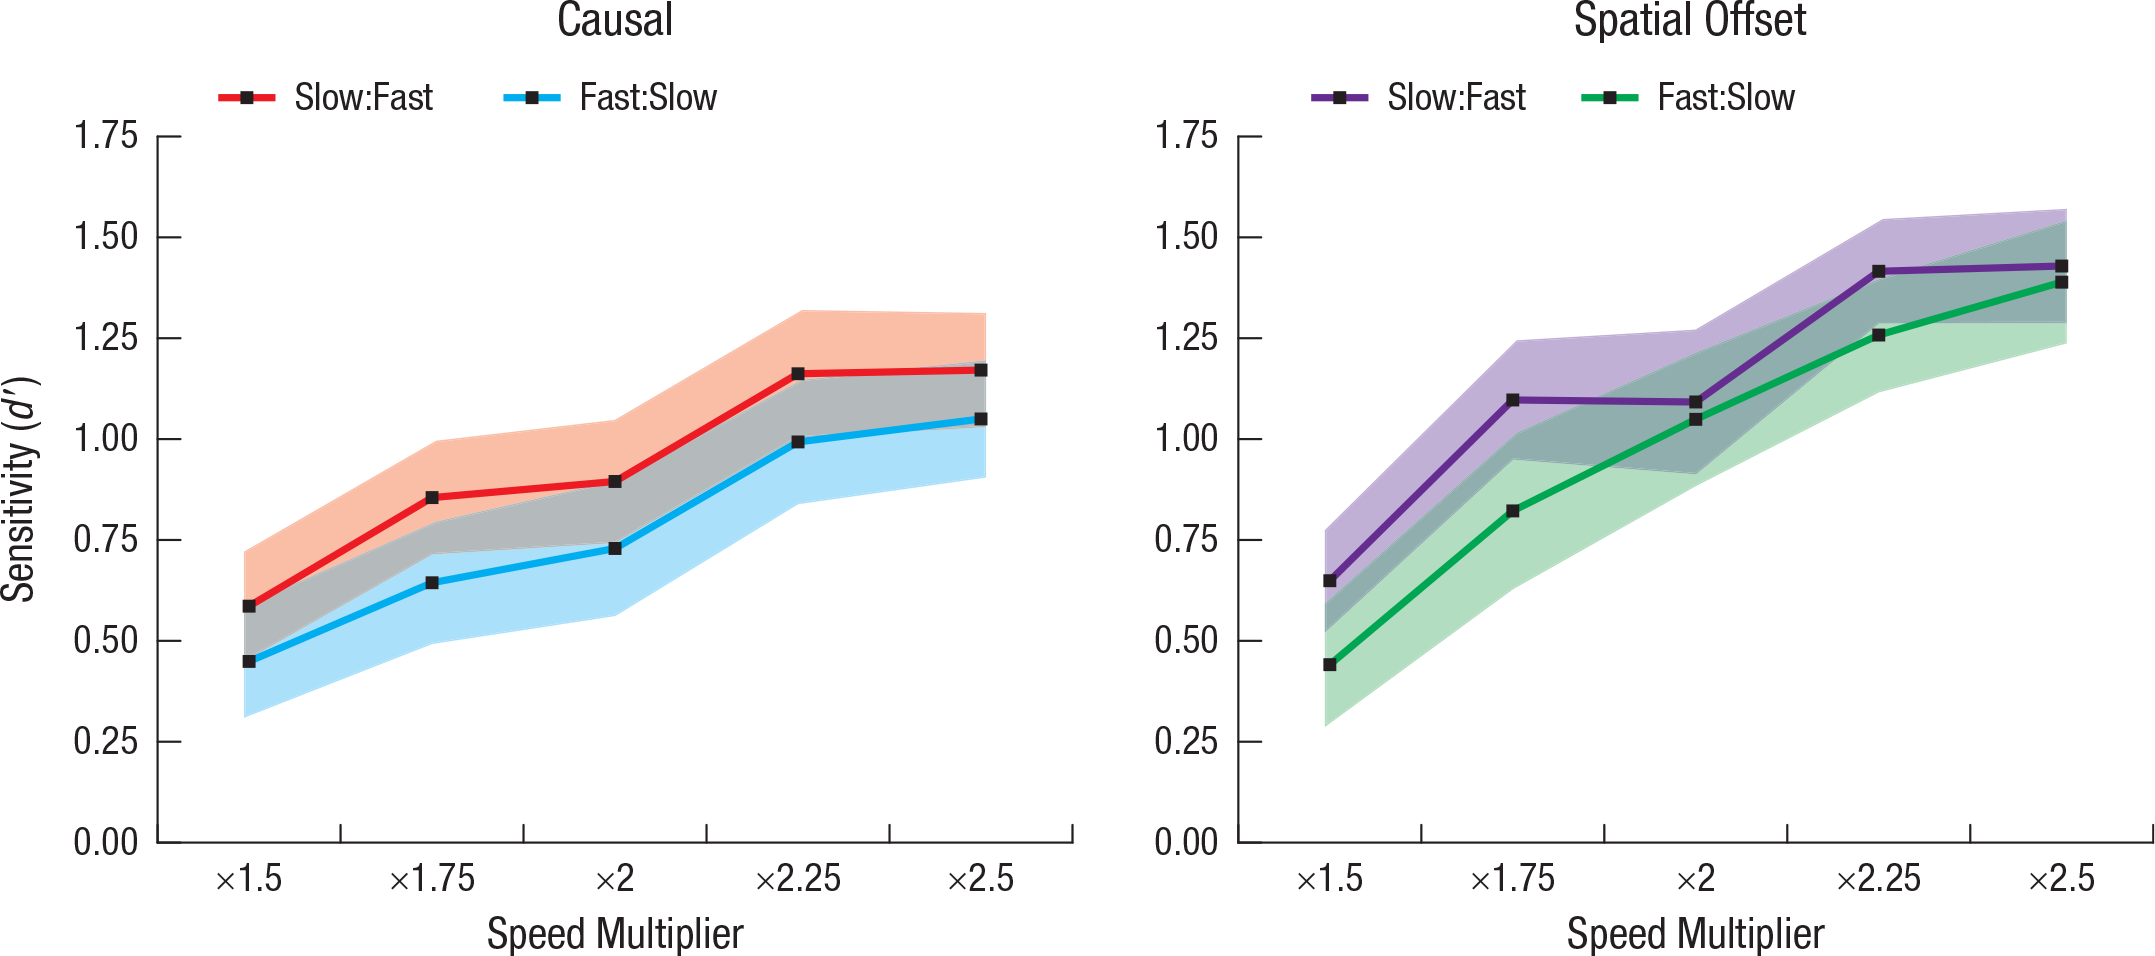
Results of Experiment 2: sensitivity to differences in speed as a function of speed multiplier and trial type (slow:fast, fast:slow), separately for causal events (left) and noncausal (spatial-offset) events (right). Shaded areas represent ±1 SEM.
Bonferroni-corrected pairwise comparisons revealed that subjects were significantly more sensitive to events with speed multipliers of 2.5 (M = 1.26, SD = 0.71) than to those with speed multipliers of 2 (M = 0.94, SD = 0.81), 1.75 (M = 0.85, SD = 0.78), or 1.5 (M = 0.53, SD = 0.67), ps < .001. However, sensitivity did not differ between events with speed multipliers of 2 and 2.25 (M = 1.21, SD = 0.71), p > .9, or between events with speed multipliers of 2 and 1.75, p > .9. All other differences between speed multipliers were significant, p ≤ .01.
So what counts as a noticeable difference in speed? Because d′ is a dimensionless statistic, it is a little difficult to tell. A d′ of 0 would indicate purely chance performance (equal false alarm and hit rates). One-sample t tests of the average d′ values revealed that all of them were significantly higher than 0, ps < .001. However, the drop-off below the speed multiplier of 2.25 indicates that people become significantly less consistent in their ability to detect speed differences at lower multipliers. Because this experiment included items at the speeds used in Experiment 1 (the 1:3 and 3:1 events used for the exclusion criterion), we computed d′ for these items as well and conducted an additional set of Bonferroni-corrected pairwise comparisons to test for differences in sensitivity between the speed multiplier of 3 and the other five speed multipliers. We found that sensitivity was high for the speed multiplier of 3 (M = 1.33, SD = 0.53), and significantly greater than sensitivity to speed multipliers of 2 and below (ps < .001), but not 2.5 or 2.25 (ps > .6). This suggests that causal events with speed multipliers of 2 and below are, most likely, perceptually categorized as triggering events significantly less often than those with speed multipliers of 2.25 and above, but that this is not a hard boundary. For some individuals, events with speed ratios of 1:2 and below may still be seen as triggering events some of the time.
Our results contrast with those of Natsoulas (1961), who found that reports of triggering were more than 3 times as frequent for speed ratios of 1:2 compared with those of 1:1. There are two possible explanations for this difference. The first possibility is purely methodological: Although we cannot directly compare our online stimuli with Natsoulas’s (because we did not have control over subjects’ viewing distance or the size of their monitors), compared with the stimuli we used in Experiment 1a, the objects in Natsoulas’s stimuli were roughly 3 times smaller and moved about 2.5 times faster. Thus, differences in speed may have been more consistently detectable to his subjects. The second possibility is that the mechanisms of speed discrimination and causal perception are surprisingly independent: Causal perception may be affected by differences in speed that are so subtle that they cannot be explicitly detected. In other words, a modular system of causal perception may have an internal threshold for detecting differences in speed that are below the threshold of explicit speed discrimination. This would be somewhat surprising, but the current evidence cannot rule out this possibility.
Ruling out low-level alternative accounts
If the results of Experiment 1 were due to low-level differences in speed perception between causal and noncausal events rather than due to causality per se, performance would differ between the causal and noncausal conditions in this experiment. By testing speed perception in individual events, we were able to examine whether there are differences in observers’ ability to detect speed differences that mirror differences in performance in the search task. For example, a low-level account of the results of Experiment 1 might predict better performance detecting speed differences in isolated causal events than in isolated noncausal events, or better performance detecting speed differences in slow:fast causal events than in fast:slow causal events, but no such performance difference for noncausal events.
The 2 × 2 × 5 ANOVA revealed that subjects were more sensitive to speed differences in noncausal, spatial-offset events (M = 1.06, SD = 0.80) than in causal events (M = 0.85, SD = 0.75), F(1, 23) = 6.43, p = .019, η p 2 = .218, and more sensitive to speed differences in slow:fast events (M = 1.04, SD = 0.75) than in fast:slow events (M = 0.88, SD = 0.81), F(1, 23) = 10.59, p = .003, η p 2 = .315, but there was no interaction between these factors, F(1, 23) = 0.05, p = .83. So, although subjects were more sensitive to speed differences in slow:fast than in fast:slow events overall, this advantage in sensitivity was equal for causal and noncausal events. Thus, this difference in sensitivity cannot explain the results of Experiment 1: If a difference in sensitivity alone had driven the RT advantage for 1:3 causal events in Experiment 1, we would have found the same advantage in the noncausal, spatial-offset condition of Experiment 1, but this was clearly not the case. Moreover, we cannot explain the difference in performance between causal and noncausal events in Experiment 1 by postulating that speed differences in causal events were simply easier to process, because the results of Experiment 2 show exactly the opposite.
Because sensitivity to speed differences differed overall between causal and noncausal events, we conducted two additional post hoc analyses to verify that this difference in sensitivity could not explain the results of Experiment 1. First, we tested whether there was an effect of trial type (slow:fast vs. fast:slow) separately in the causal and noncausal conditions. These 2 (trial type) × 5 (speed multiplier) repeated measure ANOVAs revealed a significant advantage for slow:fast events in both the causal condition, F(1, 23) = 9.15, p = .006, η p 2 = .285, and the noncausal condition, F(1, 23) = 4.91, p = .037, η p 2 = .176. Thus, sensitivity to speed differences was significantly greater for slow:fast events in each condition independently, not just overall.
Second, we computed sensitivity difference scores (slow:fast events – fast:slow events) in the causal and noncausal conditions for each subject and conducted a Bayesian paired-samples t test using the JASP implementation (JASP Team, 2016) of R’s ttestBF function from the BayesFactor package (Morey & Rouder, 2015). This allowed us to compute a Bayes factor for the null hypothesis that the difference scores for the causal and noncausal conditions were the same (BF0). This analysis yielded a BF0 of 4.56, indicating that the magnitude of the difference in the difference scores was 4.56 times more likely to occur if the null hypothesis (i.e., no significant difference between the conditions) were true than if it were not true.
Discussion
We found a relatively linear drop-off in sensitivity to differences in speed at speed multipliers below 2.25. Although a minority of subjects had some ability to detect speed differences below the Newtonian limit of a 1:2 ratio, their sensitivity at these lower ratios was significantly reduced. Assuming that the ability to perceive a speed distinction is a prerequisite for perceiving triggering, this reduction in sensitivity would make it difficult to conduct a version of Experiment 1 with speed ratios at or below 1:2 (but see Natsoulas, 1961). Greater difficulty detecting either slow:fast or fast:slow target events would severely decrease accuracy and add variability to RTs. Therefore, we conclude that the category boundary between launching and triggering is more likely to emerge from constraints on perceptual discrimination than from the specific 1:2 Newtonian constraint on real-world causal events. However, Newtonian constraints may explain why slow:fast causal events were relevant in the environment in which the human visual system evolved, as triggering events can (and do) occur when the causal patient is self-propelled (i.e., animate). Thus, a detectable slow:fast event could indicate the presence of potential predators or prey on the basis of motion characteristics alone.
We also found that the performance differences between causal and noncausal events in Experiment 1 cannot be attributed to low-level differences in sensitivity to differences in speed. Observers in Experiment 2 were overall more sensitive to speed differences in noncausal events than in causal events, which rules out the possibility that the results of Experiment 1 were due to causal events being generally easier to process. Observers in Experiment 2 were also more sensitive to speed differences in slow:fast events than in fast:slow events, but this asymmetry did not differ significantly between causal and noncausal events. This suggests that the results of Experiment 1 were due to a categorical distinction between 1:3 and symmetric causal collision events that does not exist between 3:1 and symmetric causal collision events, and that noncausal events have no such categorical asymmetry.
Experiment 3
In this experiment, we used a classic dishabituation paradigm (e.g., Colombo & Mitchell, 2009) to examine whether sensitivity to this categorical boundary is a reliably early-developing component of human cognitive architecture. If so, infants habituated to 1:1 causal collision events should dishabituate strongly to 1:3 causal collision events, but not to 3:1 causal collision events, and there should be no such difference for noncausal events.
Method
Subjects
Considering the sample sizes of earlier causal-perception research with infants (e.g., Leslie & Keeble, 1987), but not knowing the magnitude of the effect we wanted to detect, we conservatively aimed to recruit 34 subjects in each of four conditions. A total of 136 infants (67 female) ages 6 months 15 days to 10 months 0 days were recruited from the greater New Haven, Connecticut, and Berlin, Germany, areas. Preliminary ANOVAs found no significant effects of age or data-collection site, and only a marginally significant effect of gender (male infants tended to look at the display longer than the female infants did in all conditions). Therefore, we report analyses that collapsed across these factors. An additional 25 babies were tested but excluded because of fussiness or distraction (n = 6), procedural error (n = 13), parental interference (n = 1), or test-trial looking times more than 3 SD from the mean looking time in their condition (n = 5). An additional 28 babies were excluded because of errors in coding looking times during the experiment such that the habituation criterion was set incorrectly, which resulted in the test event being presented when the infants were either underhabituated or overhabituated according to the subsequent recoding based on video (see the next section); however, including these babies in the analyses did not substantially change the pattern of results (see the Supplemental Material).
Stimuli and procedure
The infants sat on their parents’ laps, and the parents were instructed not to direct their infants’ attention during the experiment. Additionally, the parents closed their eyes during the test trial so that they would not know what event their infants were seeing. This ensured that the infants could not be influenced by their parents’ reactions to the stimuli. During the testing session, the infants were shown animated videos of two identical red squares involved in causal and noncausal interactions (stimuli modeled closely on those used by Leslie and Keeble, 1987). Each video was 2 s long and presented in a continuous loop on a large flat-screen monitor at 30 frames per second.
Each trial began with a short attention-getting noise. When the infant looked at the screen, the trial began, and the animation started to play. The trial ended when the infant looked away for 2 continuous seconds, or when 60 s had passed since the start of the trial, whichever came first. The habituation criterion for each infant was calculated as the sum of that infant’s looking time over the first three trials divided by 2, and infants were considered habituated when their total looking time over three consecutive trials (starting with Trials 4, 5, and 6) was less than their individual criterion. A trained coder, who was blind to condition, used jHab (Casstevens, 2007) to record the infants’ looking times; a second, independent coder subsequently evaluated all looking times from videos. The two coders’ looking times were highly correlated (r = .97). Disagreement sufficiently large to result in a difference in the computed habituation criterion led to replacement of that subject. For the analyses reported here, the first coder’s data were used, except in cases in which the recoding process uncovered an error by that coder that did not affect the habituation criterion, in which case the second coder’s data were used.
In the causal condition, infants (n = 68; 35 female) were shown a launching event at a 1:1 speed ratio until they habituated to the presentation. After this habituation phase, the infants were shown a single test trial. Half of the infants (n = 34) were shown a causal event with a 1:3 speed ratio, whereas the other half (n = 34) were shown a causal event with a 3:1 speed ratio. The stimuli and procedure in the noncausal condition (n = 68; 32 female, divided evenly between 1:3 and 3:1 test events) were identical, except that the animations in both the habituation and the test phases included a 0.5-s pause when the two squares came into contact. This manipulation was previously shown to disrupt preverbal infants’ perception of causality in such events (Leslie & Keeble, 1987).
Results
Figure 5 shows the average looking times on test trials. A 2 (condition: causal vs. noncausal) × 2 (speed ratio: 1:3 vs. 3:1) ANOVA revealed a significant Condition × Speed Ratio interaction, F(1, 132) = 5.56, p = .02, η p 2 = 04. As predicted, the infants in the causal condition looked longer at the 1:3 events than at the 3:1 events during the test trial, t(66) = 2.29, p = .025, d = 0.55, 95% CI = [0.064, 1.033], whereas the infants in the noncausal condition showed no significant difference in looking times between 1:3 and 3:1 test events, t(66) = −0.88, p = .38. Analyses using log-transformed looking times yielded similar results (see the Supplemental Material). These results suggest that preverbal infants are sensitive to a categorical boundary between launching (1:1 and 3:1 events) and triggering (1:3 events).
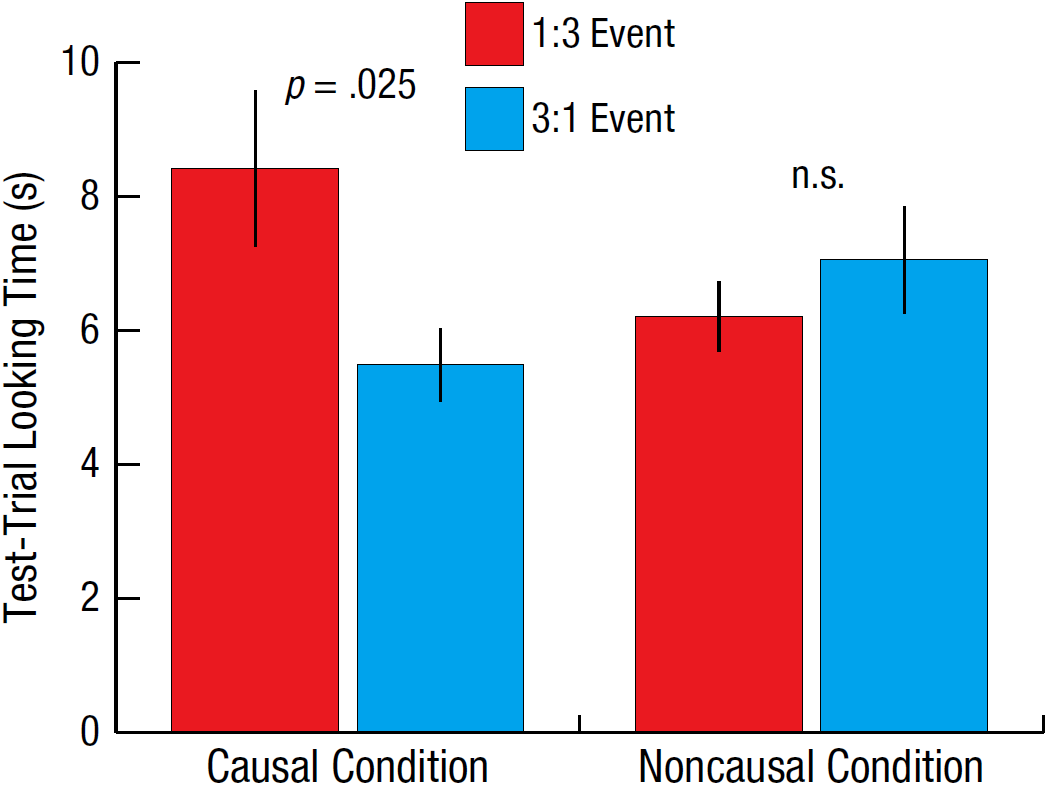
Results of Experiment 3: infants’ total looking time on the test trial as a function of condition (causal, noncausal) and speed ratio (1:3, 3:1). Error bars represent ±1 SEM.
General Discussion
Our three experiments reveal categorical boundaries within causal perception—boundaries that are defined by an interplay of physical and perceptual constraints. In Experiment 1, adults’ performance on a search task indicated that causal events with speed ratios of 1:3 are categorically different from symmetrical launching events, but causal events with speed ratios of 3:1 are not. In Experiment 2, we found that adult observers have difficulty detecting a difference in speed when the ratio of two speeds is low (particularly when the speed multiplier is 2 or less) and obtained further evidence that the categorical distinction observed in Experiment 1 cannot be attributed to low-level differences between causal and noncausal events. Finally, Experiment 3 provided evidence that this categorical distinction is present in 7- to 9-month-old infants, raising the possibility that it is a reliably early-developing feature of causal perception and perhaps core knowledge (Carey, 2009).
Although real-world collisions are constrained by Newtonian mechanics, our results suggest that this categorical boundary is more directly determined by constraints on perception. Those perceptual constraints are in the vicinity of the Newtonian limit on collision events, but seem to be rough approximations rather than a precise reflection of Newtonian physics. It makes sense that causal perception should define this boundary flexibly, given that there are many features of both objects and the environment that could drop the limit below 1:2. Thus, any noticeable increase in B’s speed relative to A’s speed could indicate that something beyond the impact with A generated B’s movement. Therefore, our results with both adults and infants strongly suggest that causal perception distinguishes causal events that likely indicate some hidden force acting on B (internal or external) from those that do not.
Footnotes
Action Editor
Marc J. Buehner served as action editor for this article.
Declaration of Conflicting Interests
The authors declared that they had no conflicts of interest with respect to their authorship or the publication of this article.
Open Practices
All data and materials have been made publicly available via the Open Science Framework and can be accessed at https://osf.io/k8t4b/. The complete Open Practices Disclosure for this article can be found at http://journals.sagepub.com/doi/suppl/10.1177/0956797617719930. This article has received badges for Open Data and Open Materials. More information about the Open Practices badges can be found at  .
.
References
Supplementary Material
Please find the following supplemental material available below.
For Open Access articles published under a Creative Commons License, all supplemental material carries the same license as the article it is associated with.
For non-Open Access articles published, all supplemental material carries a non-exclusive license, and permission requests for re-use of supplemental material or any part of supplemental material shall be sent directly to the copyright owner as specified in the copyright notice associated with the article.
