



Abstract
This study evaluated the claim that auditory processing deficits are a cause of reading and language difficulties. We report a longitudinal study of 245 children at family risk of dyslexia, children with preschool language impairments, and control children. Children with language impairments had poorer frequency-discrimination thresholds than controls at 5.5 years, but children at family risk of dyslexia did not. A model assessing longitudinal relationships among frequency discrimination, reading, language, and executive function skills showed that frequency discrimination was predicted by executive skills but was not a longitudinal predictor of reading or language skills. Our findings contradict the hypothesis that frequency discrimination is causally related to dyslexia or language impairment and suggest that individuals at risk for dyslexia or who have language impairments may perform poorly on auditory processing tasks because of comorbid attentional difficulties.
Developmental dyslexia is a learning disorder primarily affecting the ability to learn to read and spell. The predominant causal explanation for dyslexia is that it reflects a phonological deficit (Melby-Lervåg, Lyster, & Hulme, 2012; Vellutino, Fletcher, Snowling, & Scanlon, 2004). It has been suggested (e.g., Tallal, 1980) that this phonological deficit arises from low-level auditory impairments (auditory problems → speech-perception problems → phonological problems → reading and language problems; see Goswami, 2015; Schulte-Körne & Bruder, 2010, for reviews). Support for this auditory-processing-deficit theory comes from studies that have compared children with dyslexia with control children on nonverbal auditory tasks, in particular, tasks that tap parameters that are critical for speech perception, such as frequency (pitch) discrimination and sensitivity to syllable duration and amplitude rise time. Hämäläinen, Salminen, and Leppanen (2012) calculated effect sizes for group differences between dyslexic and control children on auditory tasks assessing frequency discrimination, frequency modulation, intensity discrimination, amplitude modulation, rise time, stimulus duration, and gap detection. The largest differences between control and dyslexic children were for the perception of stimulus duration (d = 0.9), rise time (d = 0.8), and frequency discrimination (d = 0.7), and each of these measures correlated with reading skills.
A critical limitation of most studies that have tested the auditory-processing-deficit hypothesis is that they are concurrent studies employing extreme groups. That is, they simply compare auditory processing in a group of children or adults who have dyslexia with a control group matched in age or reading ability. Such studies can demonstrate that poor auditory processing is associated with dyslexia, but they cannot provide any convincing support for the theory that poor auditory processing causes dyslexia. In contrast, longitudinal studies of children that start prior to reading instruction provide much stronger tests of such a causal theory because they allow us to assess whether early deficits in auditory skills predict later reading and language difficulties before learning to read has exerted reciprocal effects on auditory processing (Bishop, Hardiman, & Barry, 2012).
Two longitudinal studies assessing auditory processing very early in development in children at family risk of dyslexia are particularly relevant here (for reviews, see Leppänen et al., 2012; van der Leij et al., 2013). Both used neurophysiological methods. Leppänen et al. (2010) compared the mismatch negativity (MMN) event-related potential responses of 22 newborn children at family risk of dyslexia and 25 controls in a task assessing sensitivity to changes in the frequency of sounds. The MMN response in newborns correlated with preschool phonological skills and letter knowledge and with Grade 2 measures of speech perception, reading, and spelling (rs = .3–.4). However, while there were group differences between the at-risk children and controls in the size of the MMN response in the newborn period, these did not predict which of the at-risk children would later become dyslexic.
In a similar vein, van Zuijen et al. (2012) investigated temporal processing in 17-month-old at-risk (n = 12) children and control families (n = 12) using the MMN response to changes in intertone intervals. At 17 months, only the controls but not the at-risk children showed an MMN response. In this study, the amplitude of the MMN response predicted later word-reading fluency (r = .52) but, surprisingly, not phonological awareness. Using children from the same longitudinal cohort, Plakas, van Zuijen, van Leeuwen, Thomson, and van der Leij (2013) assessed frequency discrimination and sensitivity to onset rise time in children 41 months old. Correlations between MMN measures of sensitivity to rise time and frequency discrimination and later reading were weak (rs = ~.2–.4). Again, the correlation with phonological awareness was not significant. Combined with the findings of Leppänen et al. (2010), these results suggest that there are differences in neural responses to auditory stimuli between preschool children at family risk of dyslexia and controls. However, the sample sizes were typically small (at-risk: ns = 8–34; control: ns = 11–39; Leppänen et al., 2010; Plakas et al., 2013), and evidence for associations with later reading skills is inconsistent.
A similarly mixed picture comes from studies investigating auditory processing in at-risk samples at around school entry. Maurer, Bucher, Brem, and Brandeis (2003) found an attenuated MMN response to frequency differences of 30 to 60 Hz in 6-year-olds at family risk of dyslexia, but they did not follow the children’s reading at a later stage. Boets and colleagues (Boets, Ghesquière, van Wieringen, & Wouters, 2007; Boets, Wouters, van Wieringen, & Ghesquière, 2006) measured thresholds for gap detection, frequency modulation, and tone-in-noise detection in 5-year-olds at family risk of dyslexia. They found no statistically significant group differences on any measure (ds = 0.20–0.36), though a higher proportion of at-risk children scored more poorly than controls. When assessed in Grade 1, the children from this sample who were literacy impaired (n = 9) had shown poorer frequency modulation at age 5 years but did not differ from controls in gap detection or tone-in-noise detection (Boets et al., 2007).
In summary, few longitudinal studies have assessed the causal hypothesis that early problems in auditory processing are related to later reading and language difficulties. Most suffer from small sample sizes and provide little detail of the characteristics of the children studied. This is important because dyslexia commonly co-occurs with a range of other disorders, such as language impairment and attention deficits. There is evidence that children with language impairment score poorly on the same indices of auditory processing as children with dyslexia (e.g., McArthur & Bishop, 2004; Sharma, Purdy, & Kelly, 2009). There is also evidence that auditory processing deficits may be a consequence of attentional (executive) deficits that are comorbid with dyslexia, language disorder, or, conceivably, both (e.g., Gooch, Hulme, Nash, & Snowling, 2014; Henry, Messer, & Nash, 2012). Longitudinal studies with adequate sample sizes are needed to tease apart the predictive associations between auditory processing and later reading, spoken language, and attentional skills.
In the current study, we used data from a large longitudinal study of children at family risk of dyslexia, children with a preschool language disorder, and typically developing controls. We assessed auditory processing, reading, oral language, and attention when they were 4.5, 5.5, and 8 years old. We chose a frequency-discrimination task to measure auditory processing because the ability to resolve rapidly changing frequency information is critical to speech and phonological processing, and deficits on such measures have been strongly associated with dyslexia in previous studies. We measured frequency discrimination in the early stages of reading development (ages 4.5 and 5.5 years) because if auditory processing plays a causal role in reading acquisition (and hence dyslexia), its impact should be seen shortly after a child begins to receive formal reading instruction. We also measured executive skills because auditory tasks are attention demanding, and children with dyslexia might perform poorly on such tasks because of co-occurring attentional deficits rather than specific auditory problems (Breier, Fletcher, Foorman, Klaas, & Gray, 2003; Halliday, Taylor, Edmondson-Jones, & Moore, 2008; Sutcliffe, Bishop, Houghton, & Taylor, 2006).
The study had four aims. The first was to assess whether poor frequency discrimination is associated with familial risk of dyslexia, language impairment, or both. We chose a task typical of those used to measure frequency discrimination in studies of dyslexic readers (23 studies consisting of 554 control and 582 reading-disabled participants; mean effect size: Cohen’s d = 0.7; Hämäläinen et al., 2012). The samples of children with dyslexia, language impairment, and typically developing controls were large enough (at least 64) to detect an effect of this size with a power of 0.8.
The second aim of the study was to assess the longitudinal relationships among frequency discrimination, executive function, language, and reading. We examined these relationships using latent variable models to control for measurement error. The frequency-discrimination task has been shown to be particularly sensitive to auditory processing impairment in children with poor reading or spoken language (McArthur & Hogben, 2012). We included measures of oral language because it is plausible that any effect of auditory processing on reading is mediated by effects on oral language skills.
To investigate the possibility that top-down processes on auditory processing play a role in predicting performance in the frequency-discrimination task (Schulte-Körne & Bruder, 2010), we included measures of executive function at 4.5 years (Time 2) as possible predictors of performance at 5.5 years (Time 3). We did not, however, expect executive skills to predict language or reading (e.g., Gooch, Thompson, Nash, Snowling & Hulme, 2016).
Finally, we predicted that children at family risk of dyslexia and children with language impairment would show poorer frequency discrimination than controls. Most critically, however, if variations in frequency discrimination are causally related to language or reading, frequency discrimination at age 4.5 years should be a longitudinal predictor of language or reading skills.
Method
Ethical permission for the study was obtained from the University of York, Department of Psychology’s Ethics Committee, and the NHS Research Ethics Committee. Informed consent was given by parents for their child’s participation in the study.
Participants
The project recruited children at family risk of dyslexia, children with preschool language impairment, and typically developing controls and assessed them at approximately yearly intervals: Time 1 (~3.5 years), Time 2 (~4.5 years), Time 3 (~5.5 years), Time 4 (~6.5 years), and Time 5 (~8 years). At Time 1, 245 children entered the study; between Time 1 and Time 2, 15 children withdrew, and an additional 15 children were recruited (1 of whom did not fulfill criteria for family risk or language impairment and was excluded from group comparisons). At Time 2 (4.5 years), the total sample comprised 245 children (241 at Time 3; Fig. 1; also see the Supplemental Material available online). The sample size was determined by the practicalities of participant recruitment and is substantially larger than in most earlier studies, which have reported medium to large effect sizes for group differences. The subset of data used in the current study focused on three time points: Time 2 (4.5 years), Time 3 (5.5 years), and Time 5 (8 years).

Structural equation model showing relationships among latent factors describing frequency discrimination (FD), reading, language, and executive function (EF) skills. All parameter estimates are standardized. Double-headed arrows represent correlations, and single-headed arrows represent factor loadings or regression coefficients. Rectangles represent observed variables, and ovals represent latent variables. Parameter estimates in parentheses for the model excluded the group with language impairment. HTKS = head, toes, knees, and shoulders test; REV = reversal; SWR = single-word reading. The following covariances are not shown in the model: FDRev3T2 – FDRev1T2 = .46 (.55); FDRev4T2 – FDRev1T2 = −.82 (−.59); FDRev3T3 – FDRev1T3= −.50 (−.25); SRep2 – SRep3 = .64 (.64); SenSt2 – SenSt3 = .20 (.32); Reg2 – Reg3 = .25 (.18); Irreg2 – Irreg3 = −.39 (−.31); Vocab2 – Vocab3 = .16 (.14).
None of the children met exclusionary criteria (monozygotic twinning, chronic illness, deafness, English as an additional language, care provision by local authority, and known neurological disorder such as cerebral palsy, epilepsy, or autism spectrum disorder). The children were classified into groups using a two-stage process, first determining whether they were at family risk of dyslexia because they had an affected parent or sibling, and then using diagnostic criteria to determine whether they had a language impairment. A child was regarded as language impaired if he or she obtained a below-average score on two out of four tests, namely language comprehension, vocabulary, grammar, and morphological inflection (see Nash, Hulme, Gooch, & Snowling, 2013, for details).
This procedure yielded four groups: family risk only (n = 86), language impairment only (n = 36), family risk and language impairment (n = 37), and typically developing (n = 71). Here, we pooled data from the family-risk-and-language-impaired and language-impaired-only groups because there were no significant differences between the two subgroups on preschool measures of language. This resulted in the following groups: typically developing (n = 74), family risk (n = 91; 3 withdrew at Time 3), and language impairment (n = 64). We used these three groups to assess whether poor frequency discrimination is associated with familial risk of dyslexia, preschool language impairment, or both. To investigate longitudinal relationships among frequency discrimination, reading, language, and executive function, we included data from an additional 15 children who had been referred to the study by parents or therapists with concerns regarding speech and language development but who did not meet strict inclusionary criteria for language impairment at Time 1 (these 15 children had weak language skills for their age; they were similar to the family-risk group in nonverbal IQ and on measures of receptive grammar and vocabulary but weaker than that group in sentence repetition and morphological inflection). The inclusion of data from these children is justified because language skill was a continuous measure in the latent variable models.
Procedure
At age 4.5 (Time 2), assessments were conducted at home during two 1-hr sessions with breaks as necessary. Assessments at age 5.5 (Time 3) and age 8 (Time 5) were conducted at school. Testers were postdoctoral and doctoral assistants who were employed throughout the study and had substantial experience from initial assessments of the children (usually the same child) a year earlier, as well as in clinical child assessment. Training to deliver the test battery was under the supervision of the lab manager. Written protocols were prepared for each test, and the lab manager then ran through the battery. Once the testers had familiarized themselves with the test protocols, they were given individual feedback on test administration. Training for the computer-generated frequency-discrimination task was intensive to ensure all testers could oversee the running of the experimental program.
Language measures
Grammar
At age 4.5 (Time 2) and 5.5 (Time 3) years, we measured receptive and expressive grammatical skills. In Sentence Structure (Clinical Evaluation of Language Fundamentals – Preschool UK; Semel, Wigg, & Secord, 2006a, at Time 2; Clinical Evaluation of Language Fundamentals – Fourth Edition UK; Semel, Wigg, & Secord, 2006b, at Time 3), the child heard sentences of different syntactic structures and had to select, from a choice of four, the picture that conveyed its meaning. In a sentence-repetition test designed for the project, the child had to repeat 20 sentences varying in length (short vs. long) and complexity (transitive vs. ditransitive; e.g., “a lady pushed the bike to work,” and “the busy teacher promised the clever boy a sticker”). The total number of sentences repeated correctly was recorded.
Vocabulary
At 4.5 years (Time 2), children completed the Receptive One-Word Picture Vocabulary Test (Brownell, 2000). The child heard a word and was asked to select the corresponding picture from a choice of four. At 5.5 years (Time 3), children completed an Expressive Vocabulary measure (Clinical Evaluation of Language Fundamentals – Fourth Edition UK; Semel et al., 2006b), in which the child was asked to name objects or to describe what a person is doing.
Reading measures
Regular and irregular word reading
At age 4.5 (Time 2) and 5.5 (Time 3), children completed the Early Word Reading subtest from the York Assessment of Reading for Comprehension (YARC; Hulme et al., 2009). The child read aloud 30 single words, graded in difficulty. Half of the words were phonemically regular (decodable), and the other half were irregular. Each correct response scored 1 point; testing was discontinued if the child made 10 consecutive reading errors.
Single-word reading
At age 5.5 (Time 3) and 8 (Time 5), children completed the YARC Single Word Reading test (Hulme et al., 2009), which involved reading a list of 60 words of increasing difficulty. Testing was discontinued after five consecutive errors or refusals. At age 8 (Time 5), they completed the Exception Word subtest from the Diagnostic Test of Word Reading Processes (Forum for Research in Literacy and Language, 2012).
Nonword reading
At age 8 (Time 5), children completed the Graded Nonword Reading Test (Snowling, Stothard & McLean, 1996), which involved reading 20 nonwords (10 one- and 10 two-syllable words).
Executive function measures
Visual search
At age 4.5 (Time 2), children completed the apples task (Breckenridge, 2008). The child was given 1 min to search an array to identify targets (18 red apples) while ignoring distractors (81 red strawberries and 81 white apples). The number of targets identified and the number of commission errors made (pointing to a distractor; false alarms) were recorded. A visual search efficiency score (total targets correctly identified – commission errors)/60 s) was calculated; a high score reflects better selective attention.
Self-regulation
At age 4.5 (Time 2), children completed the head, toes, knees, and shoulders test (Burrage et al., 2008). In this measure of behavioral inhibition, children had to do the opposite of what the examiner said (e.g., touch their toes if asked to touch their head and vice versa). If children were able to inhibit on 5 out of 10 trials, they went on to complete a further block of 10 harder trials with additional commands (e.g., touch their shoulders if asked to touch their knees and vice versa). Each correct response received 2 points. Self-corrected responses (partial inhibitions, whereby the child moved toward the incorrect, intuitive response but demonstrated the correct final response) received 1 point (maximum score = 40).
Visuospatial memory
At age 4.5 (Time 2), children completed Block Recall (Working Memory Test Battery for Children, Pickering & Gathercole, 2001), a measure of visuospatial memory. The child saw the examiner tap a sequence of blocks on a board and then recalled the sequence by tapping the blocks in the same order. The task was discontinued after two consecutive failures for sequences of the same length (maximum score = 52).
Frequency-discrimination measure
Frequency discrimination was measured at age 4.5 (Time 2) and 5.5 (Time 3) years using a task based on one shown by McArthur, Ellis, Atkinson, and Coltheart (2008) to be highly sensitive to deficits in dyslexic children. This task has good reliability across time and correlates well with other measures of frequency discrimination (McArthur & Bishop, 2004). The task is an adaptive three-interval, two-alternative forced-choice AXB procedure (see below) with a maximum of 60 trials. Each trial comprised three 100-ms pure tones (including 10-ms offset ramps) presented at 83 dB sound pressure level (SPL) and separated by an interstimulus interval (ISI) of 300 ms. The standard tone (X) set at 1000 Hz was always presented as the second tone. In each trial, either the first tone (A) or the third tone (B) was randomly allocated to match the frequency of the standard tone. The remaining tone became the target tone, which was set at a higher frequency than the standard tone using a modified parametric estimation by sequential testing (PEST) procedure (Taylor & Creelman, 1967). There were 100 different possible target tones ranging from 1005 to 1500 Hz in 5-Hz steps. This range is commonly used in discrimination tasks because it represents the approximate range of the first two formants of many speech sounds (the most important formants for speech recognition). In early trials, the PEST procedure ensured that trials were relatively easy by allocating a large frequency difference between the standard and target tones (i.e., the target tone was set at 1500 Hz). After two consecutive correct responses, the algorithm reduced the frequency difference in large step sizes (200 Hz) until an error was made. At this point—called a “reversal”—the algorithm decreased the step size (e.g., to 100 Hz) and made the discrimination easier by increasing the frequency of the target tone relative to the standard tone. The step size was halved progressively with each reversal. The smallest step size was 5 Hz. This final step size was chosen instead of a more typical final step size of 0.1 Hz because our sample was much younger (4.5 years) than those in previous studies (9+ years) and hence had less fine-grained frequency discrimination.
Children were given the following instructions for completing the task. “Here are two baby snails [experimenter points to the two small snail pictures displayed on the screen] and a mummy snail [the experimenter points to the large snail picture displayed in the center of the screen above the two smaller snails]. One of the baby snails sounds different [the target] from the mummy snail. Can you hear which one sounds different from the mummy?” Children were instructed to indicate their response by touching the target snail—this was demonstrated by the examiner. If children touched the mummy snail, they were prompted with “listen carefully—it is one of the baby snails which sounds different from the mummy.”
Children could have up to 20 practice trials to familiarize themselves with the task; however, once they obtained three consecutive correct responses, the test trials began. The PEST procedure continued until there had been eight reversals in the adjustment of the target tone or the child had completed 60 trials (whichever came first). The child’s threshold was calculated as the mean value (in hertz) of the last four reversals of the target tone. This represented the child’s threshold for discriminating between the frequency of the standard and target tones. A higher threshold score reflects poorer discrimination.
At the end of the task, the examiner rated both a judgment as to how well the child understood the task and the child’s attention during it, each on a 5-point scale (0, poor, to 5, excellent). A subsample of the cohort completed a second phase of testing a week later to calculate test-retest reliability (r = .57).
Results
Following data screening, we conducted a series of one-way analyses of variance (ANOVAs) comparing the typically-developing, family-risk, and language-impaired groups on cognitive skills (reading, language, executive function). Follow-up Bonferroni tests were used to test for statistically significant differences between groups. A similar set of analyses examined group differences in frequency discrimination. Finally, a structural equation model examined the longitudinal relationships between frequency discrimination at age 4.5 (Time 2) and 5.5 (Time 3) and between measures of language and reading at 5.5 and reading at age 8 (Time 5).
Group differences in cognitive skills
Table 1 shows the reliabilities and the means and standard deviations for the measures used at each time point, together with Cohen’s ds for the differences between the typically-developing and the family-risk and language-impaired groups, respectively. In general, measures were well distributed although there were floor effects for reading measures at age 4.5 (Time 2) and for the family-risk and language-impaired groups on sentence-repetition (n = 16) and self-regulation (n = 10) measures. There was a consistent stepwise pattern between the group means for most measures, with the typically-developing group having better scores than the family-risk group, who had better scores than the language-impaired group. As mentioned previously, there were no significant differences in language, reading, or executive skills between the language-impaired subgroups (family risk vs. no family risk; these data are therefore not given).
Results for Typically-Developing (TD), Family-Risk (FR), and Language-Impaired (LI) Groups Across Measures of Language, Reading, and Executive Skills at Time 2 (4.5 Years), Time 3 (5.5 Years), and Time 5 (8 Years)
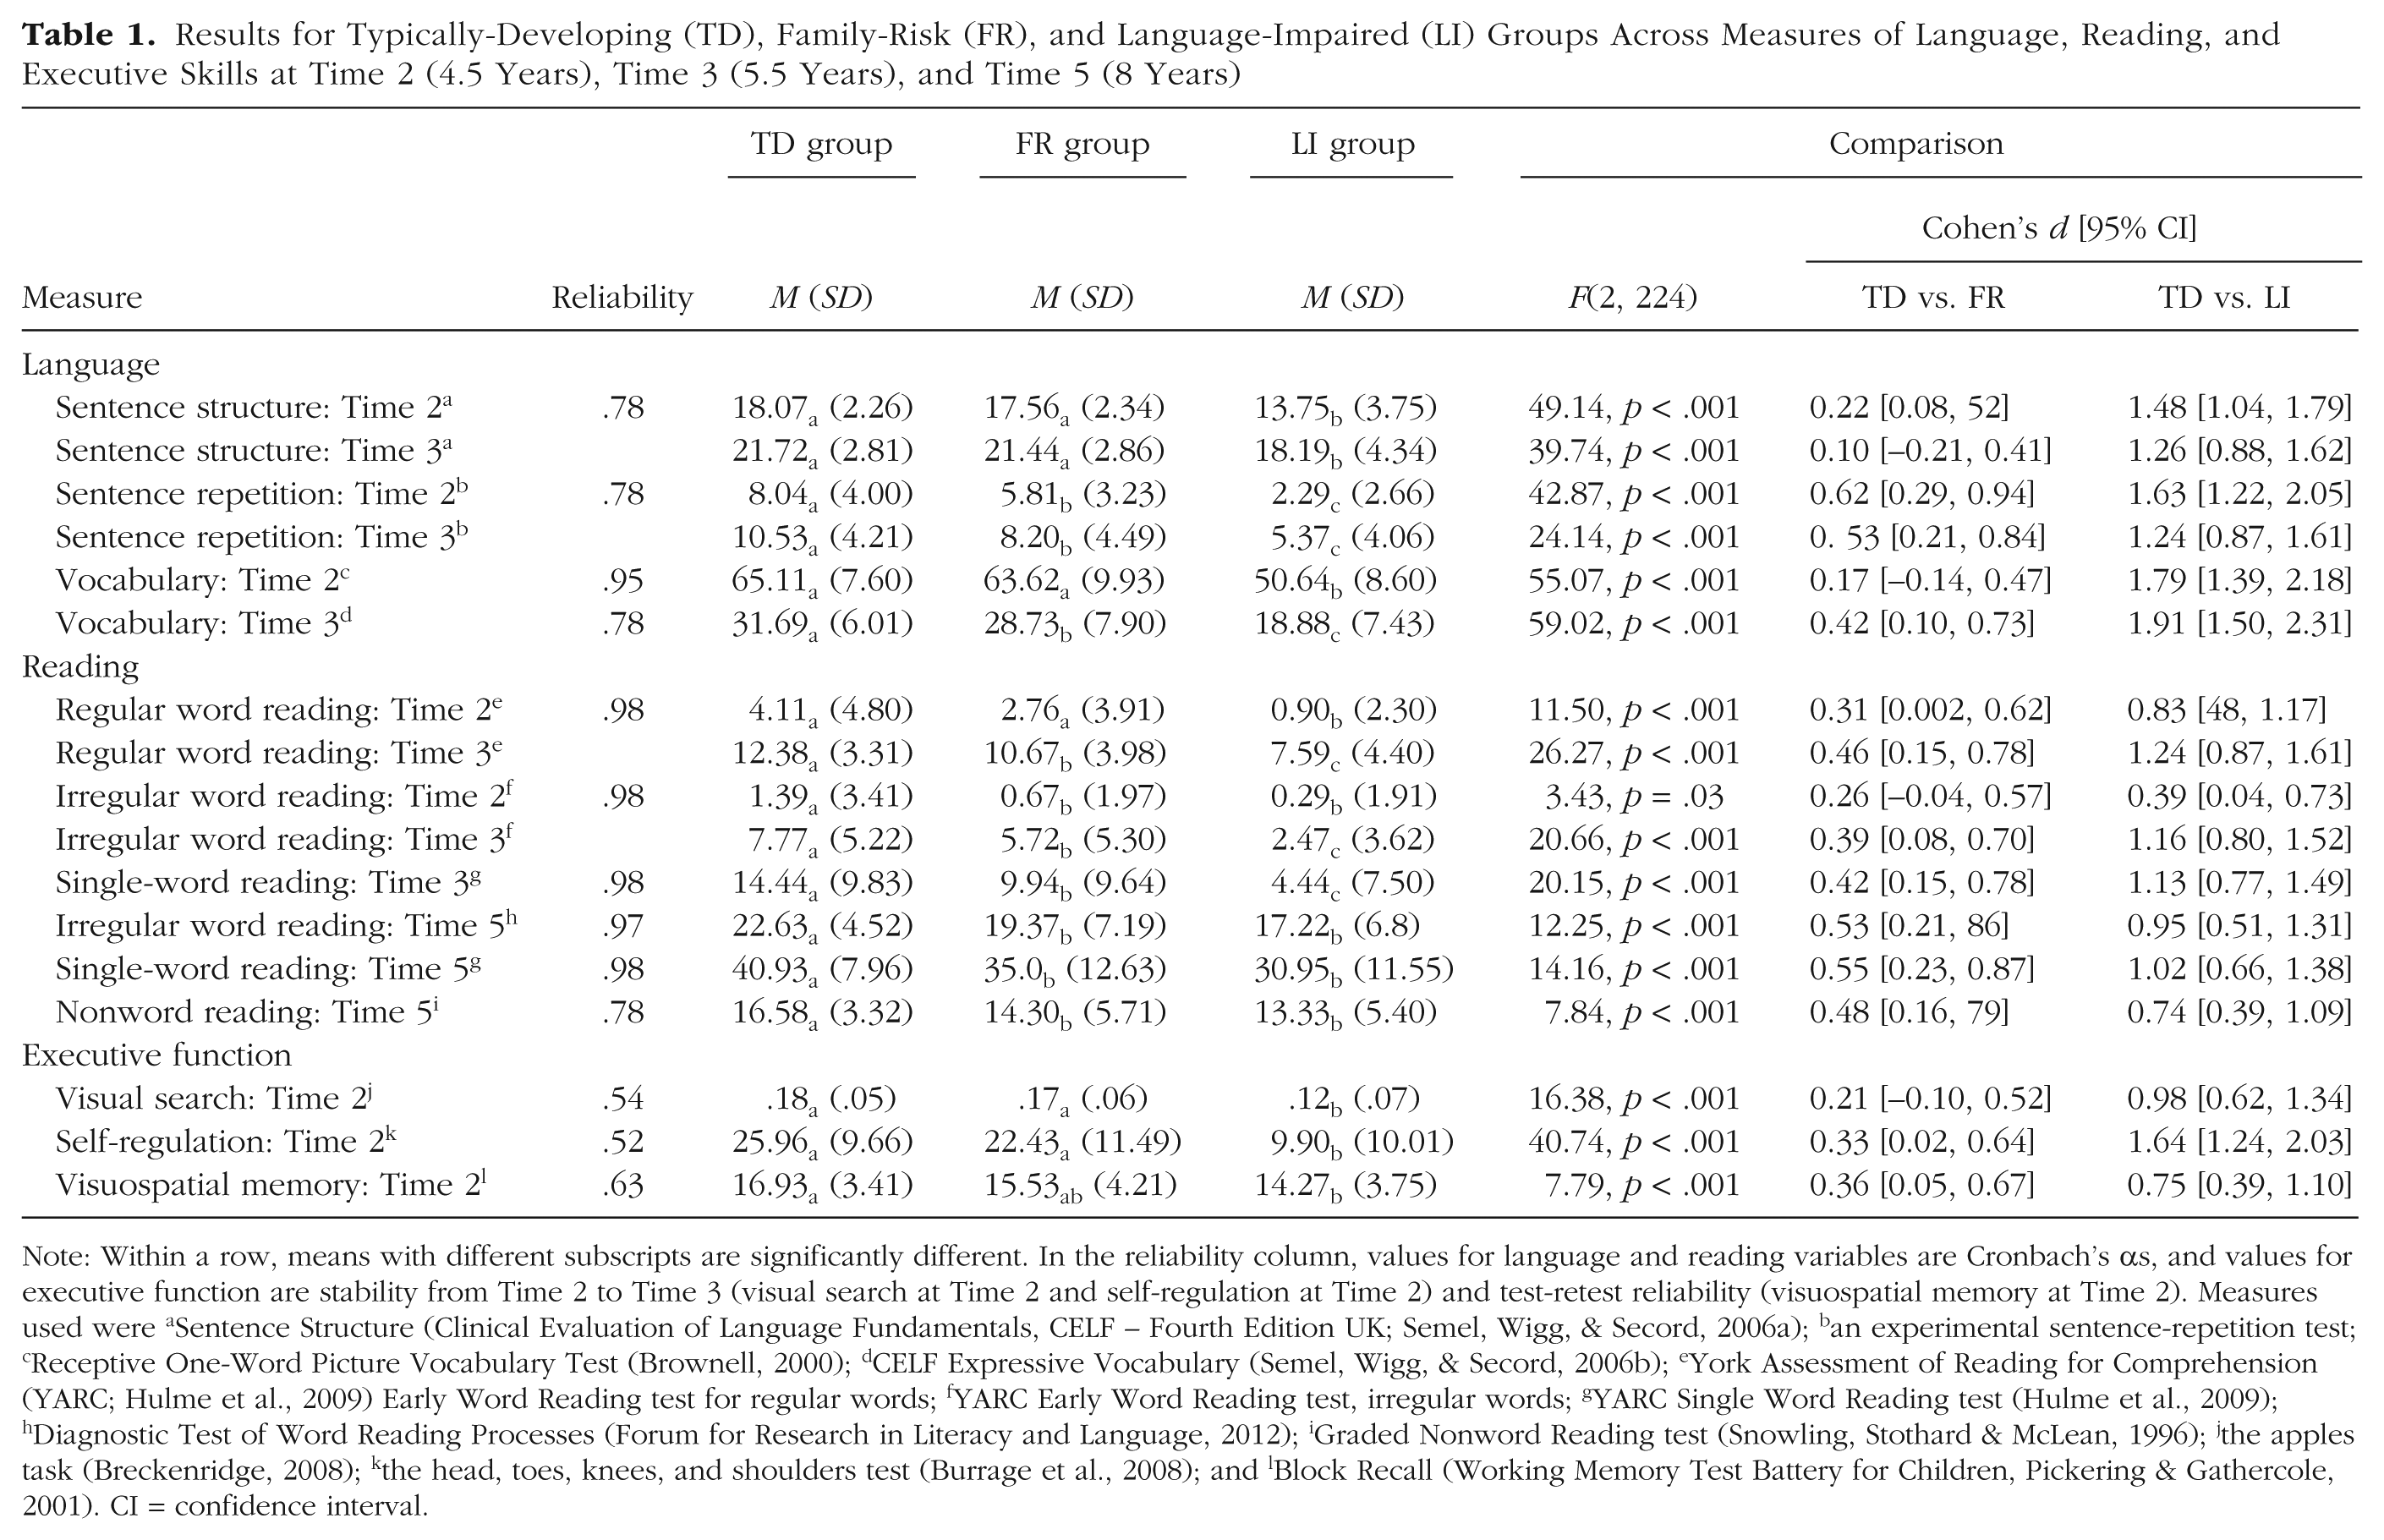
Note: Within a row, means with different subscripts are significantly different. In the reliability column, values for language and reading variables are Cronbach’s αs, and values for executive function are stability from Time 2 to Time 3 (visual search at Time 2 and self-regulation at Time 2) and test-retest reliability (visuospatial memory at Time 2). Measures used were aSentence Structure (Clinical Evaluation of Language Fundamentals, CELF – Fourth Edition UK; Semel, Wigg, & Secord, 2006a); ban experimental sentence-repetition test; cReceptive One-Word Picture Vocabulary Test (Brownell, 2000); dCELF Expressive Vocabulary (Semel, Wigg, & Secord, 2006b); eYork Assessment of Reading for Comprehension (YARC; Hulme et al., 2009) Early Word Reading test for regular words; fYARC Early Word Reading test, irregular words; gYARC Single Word Reading test (Hulme et al., 2009); hDiagnostic Test of Word Reading Processes (Forum for Research in Literacy and Language, 2012); iGraded Nonword Reading test (Snowling, Stothard & McLean, 1996); jthe apples task (Breckenridge, 2008); kthe head, toes, knees, and shoulders test (Burrage et al., 2008); and lBlock Recall (Working Memory Test Battery for Children, Pickering & Gathercole, 2001). CI = confidence interval.
Group differences in frequency discrimination
Table 2 shows the number of children from each group for whom a threshold for frequency discrimination was obtained at age 4.5 (Time 2) and age 5.5 (Time 3), as well as the mean frequency-discrimination thresholds and ratings of how well the children understood and attended to the task. Children who did not complete the task because they were unable to pass the practice criterion (3 consecutive correct responses out of 20), could not understand the instructions, or refused to cooperate were recorded as “missing.” In addition, a small number of children exited the task prematurely: 2 to 9 children across groups at age 4.5 (Time 2) and 1 to 2 at age 5.5 (Time 3).
Group Comparisons of Frequency-Discrimination (FD) Threshold for the Typically-Developing (TD), Family-Risk (FR), and Language-Impaired (LI) Groups
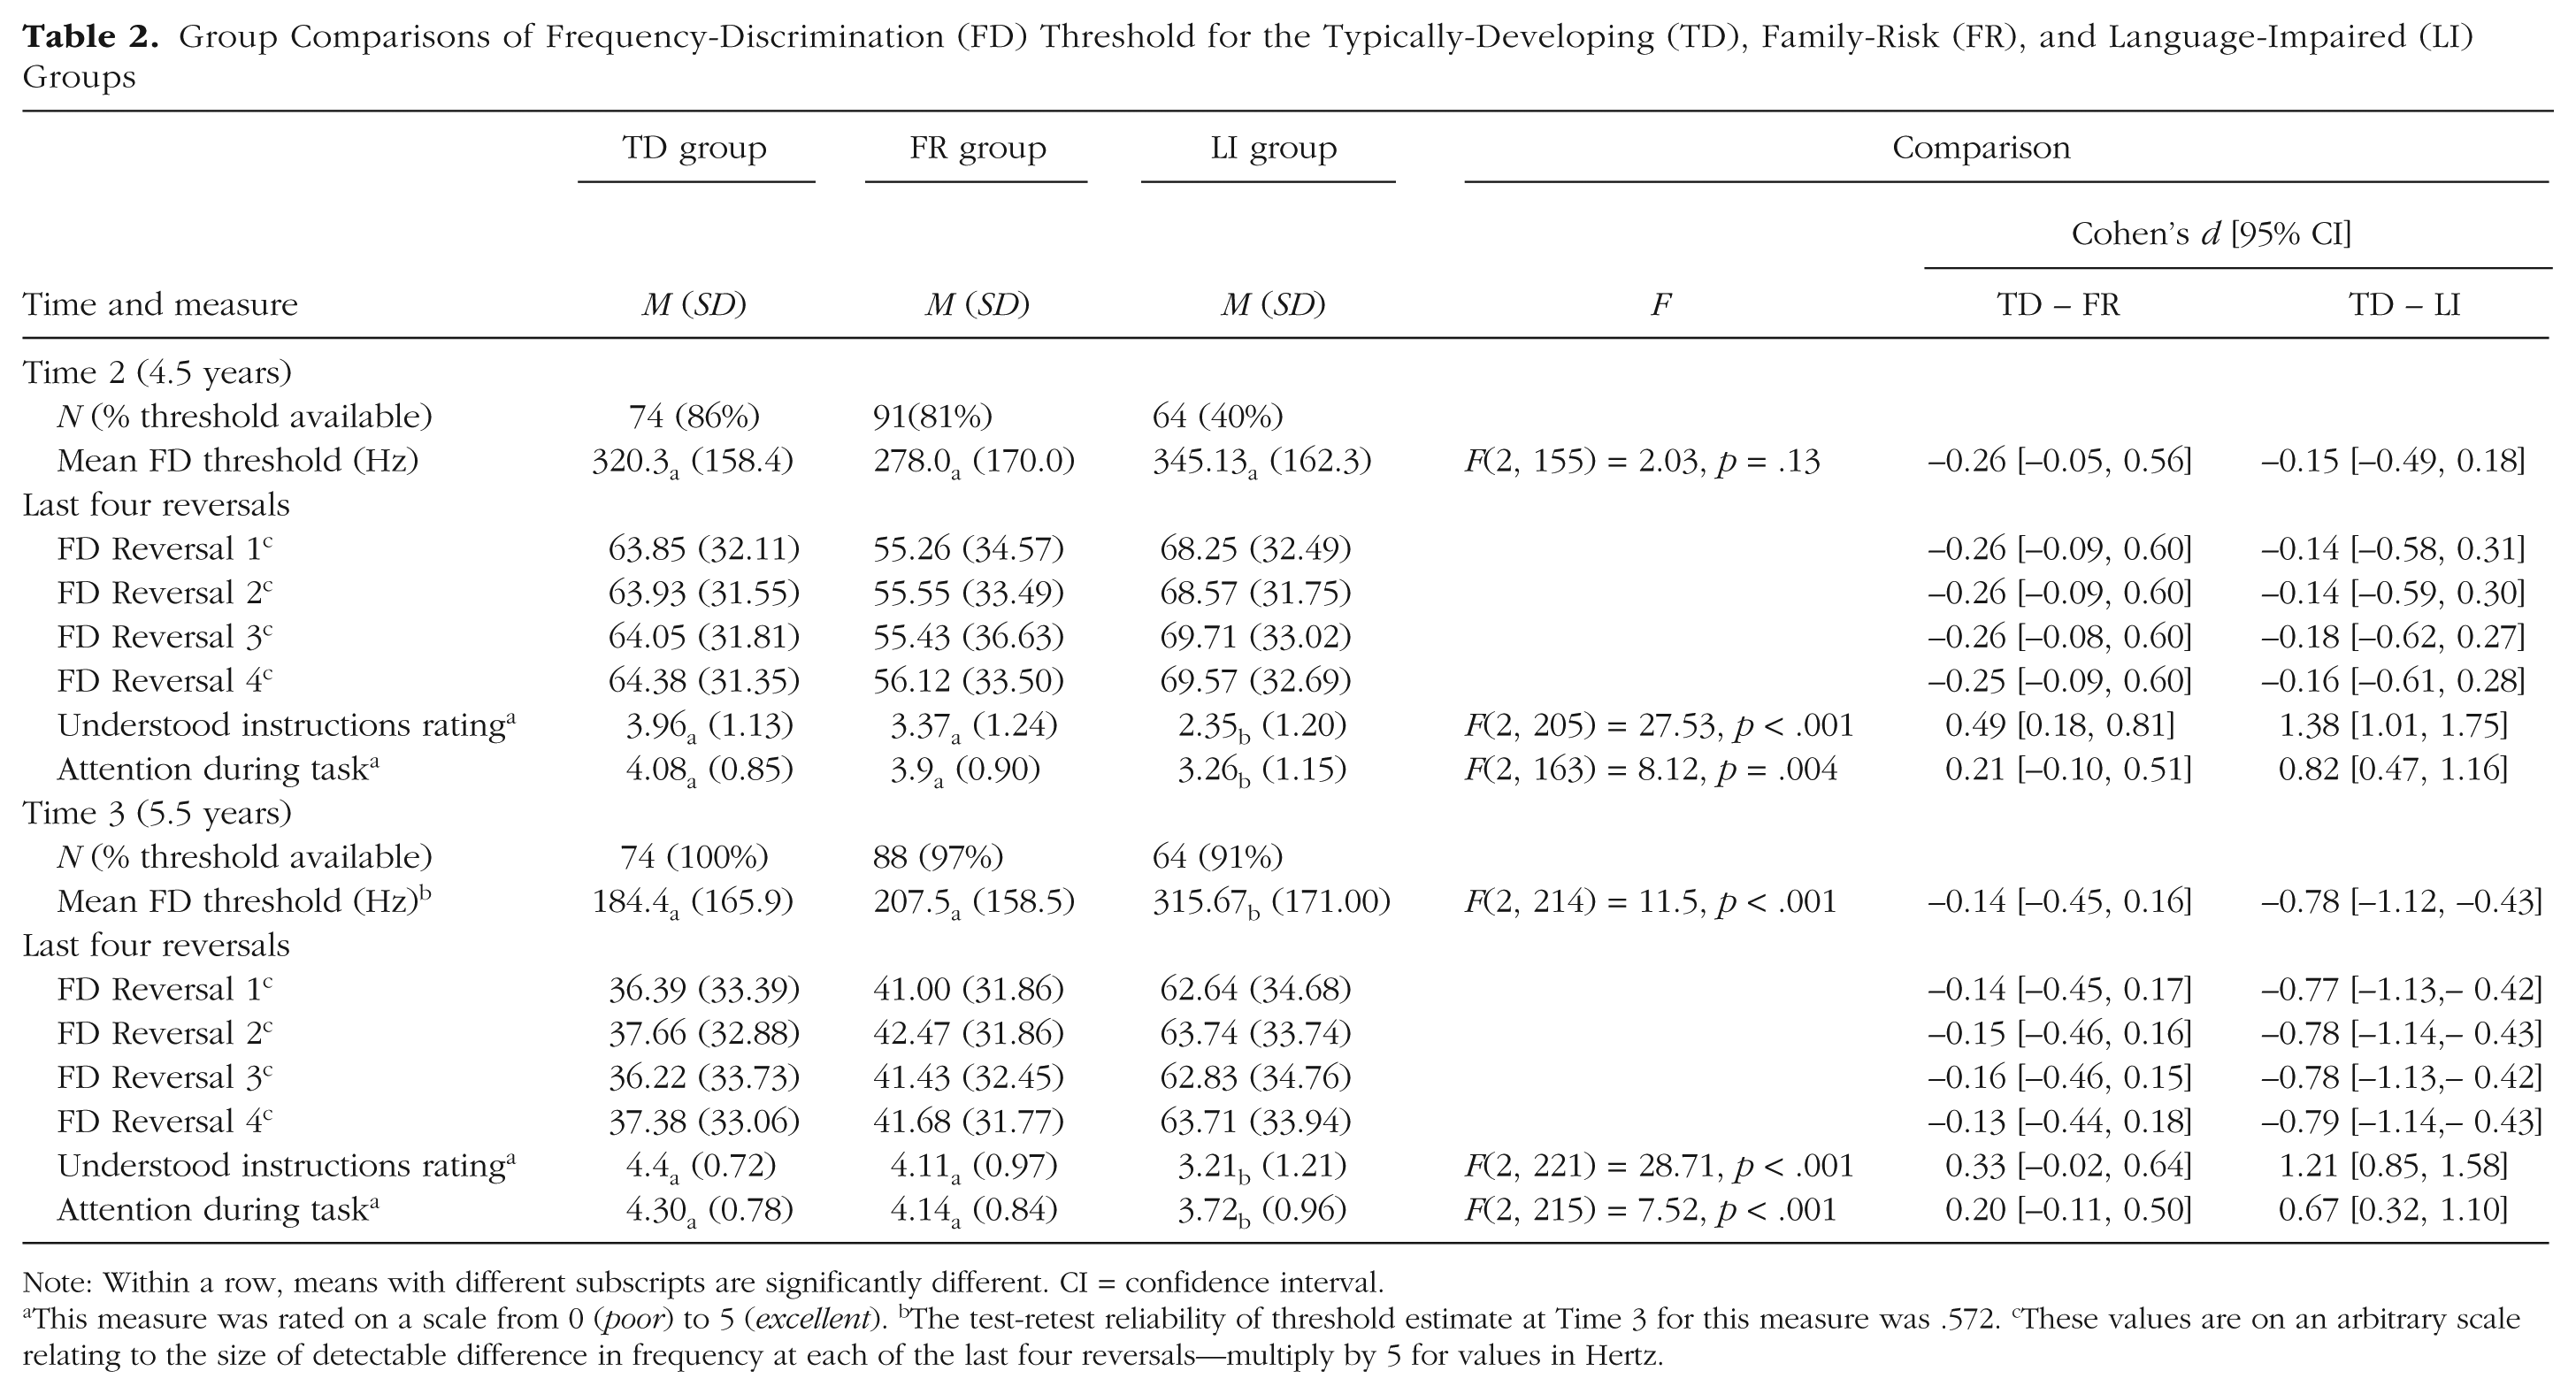
Note: Within a row, means with different subscripts are significantly different. CI = confidence interval.
This measure was rated on a scale from 0 (poor) to 5 (excellent). bThe test-retest reliability of threshold estimate at Time 3 for this measure was .572. cThese values are on an arbitrary scale relating to the size of detectable difference in frequency at each of the last four reversals—multiply by 5 for values in Hertz.
There was a larger percentage of missing data from the language-impaired than from the other groups, particularly at age 4.5 (Time 2). It seems likely that these missing data resulted from poor understanding of task instructions as rated by the assessors (concurrent correlations between measures of language and judgments regarding comprehension of instructions were .31–.49).
At age 4.5 (Time 2), more than 80% of the family-risk and the typically-developing children obtained a threshold, whereas only around 40% of the language-impaired children did so. For children contributing data, the group differences in frequency discrimination were not statistically significant at age 4.5 (Time 2), F(2, 157) = 2.03, p = .13. There were improvements in children’s thresholds from age 4.5 (Time 2) to age 5.5 (Time 3), and these improvements were largest in the typically-developing group, followed by the family-risk group, followed by the language-impaired group. At age 5.5 (Time 3), most children tested obtained a threshold, including those in the language-impaired group. At this age, there was a significant group difference in frequency discrimination, F(2, 216) = 11.5, p < .001, indicating that the language-impaired group had significantly poorer thresholds than either the typically-developing or family-risk groups, which did not differ significantly from each other. The finding that poor frequency discrimination appears to be associated with poor language rather than with family risk of dyslexia per se was tested further using an ANOVA to assess the effects of family risk, language impairment, and their interaction on frequency-discrimination threshold at age 5.5 (Time 3; see Table S1 in the Supplemental Material for data from the family risk-language-impaired and language-impaired subgroups separately). There was a significant effect of language impairment, F(1, 213) = 22.41, p < .001, but not of family risk, F(1, 213) = 0.75, p = .39, and the Language Impairment × Family Risk interaction was not significant, F(1, 213), p = .01.
Ratings of attention during the task for each group are also shown in Table 2. At both age 4.5 (Time 2) and 5.5 (Time 3), children with language impairment were rated as attending less well than those in the other two groups. Given that the language-impaired group had poorer scores on executive function tasks (Table 1) and also showed poorer attention in the frequency-discrimination task (Table 2), it seems likely that the poor thresholds obtained by these children in the frequency-discrimination task were due to difficulties in maintaining attention in the task.
Longitudinal relationships among frequency discrimination, reading, language, and executive function
The correlations between measures for the whole sample are shown in Table 3 (N = 241). Intercorrelations between language measures were moderate to strong across time. Intercorrelations between reading measures across time were strong. Executive measures correlated moderately with each other and with reading and language. The correlation between frequency discrimination at age 4.5 (Time 2) and 5.5 (Time 3) was moderate (r = .36). Correlations between frequency-discrimination and cognitive measures were low to moderate at age 4.5 (Time 2), though stronger at age 5.5 (Time 3).
Correlations Between Measures of Frequency Discrimination (FD), Reading, Language, and Executive Function Across Time Points
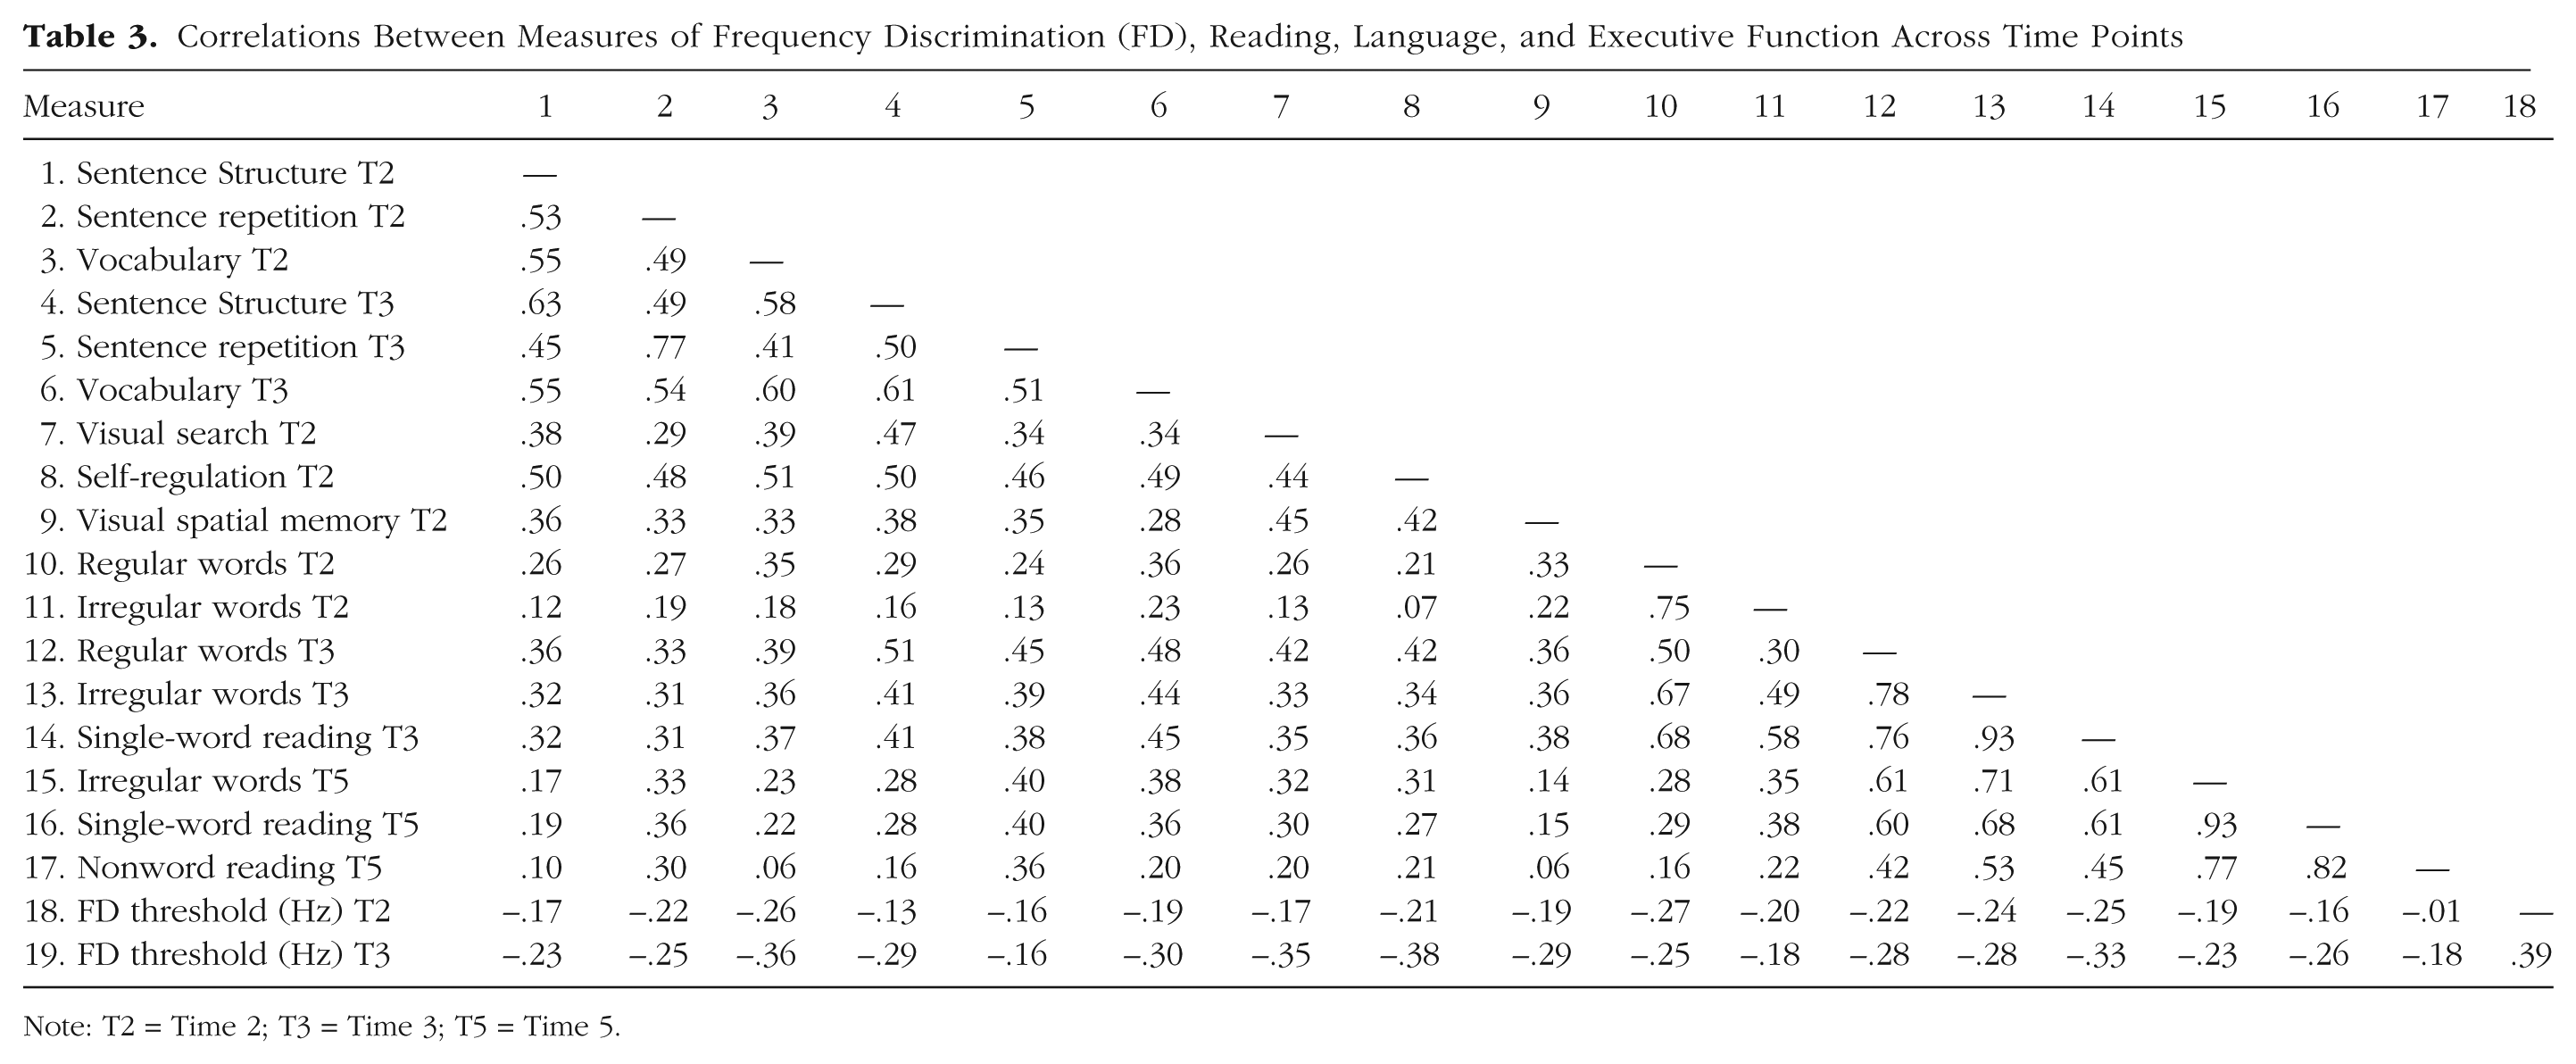
Note: T2 = Time 2; T3 = Time 3; T5 = Time 5.
To assess the possible causal relationships among frequency discrimination, reading, language, and executive function, we estimated the latent variable path model shown in Figure 1. The modeling was conducted in Mplus (Version 8.0; Muthén & Muthén, 2017), with missing values being handled by full information maximum likelihood estimation. We began with a saturated model in which each construct at Time 3 (frequency discrimination, language, and reading) was regressed on the same construct at Time 2, plus on executive function and the other two constructs measured at Time 2, and reading at Time 5 was regressed on all constructs at Time 3. The frequency-discrimination latent variable showed weak factorial invariance (corresponding unstandardized factor loadings are constrained to be equal). The final simplified model is shown in Figure 1 (values shown are standardized coefficients and correlations). The model was run on the whole sample and then excluding children with language impairment. The pattern was identical in both cases, and minor differences in parameter estimates for the whole sample, compared with the sample excluding children with language impairment, are shown in the figure in parentheses. A number of covariances between the latent and manifest variables in this model were significant but for simplicity are not shown in the path diagram (these covariances are listed in the figure legend).
In the final model, language showed high longitudinal stability, reading showed moderate stability, and frequency discrimination showed low stability. An important feature of this model is the pattern of cross-loadings between the Time 2 and Time 3 latent variables. If frequency discrimination at Time 2 had a causal influence on the development of language or reading skills, we would expect it to show significant cross-loadings to language and reading skills assessed at Time 3. In fact, both of those path weights were trivial in size, and dropping them from the model resulted in no appreciable change in fit to the model. Finding that frequency discrimination at Time 2 showed no significant longitudinal cross-loadings to language or reading at Time 3 suggests the absence of any causal relationship between frequency discrimination and the development of language and reading skills. The same pattern is true between Time 3 and Time 5 (when the children were aged 8 years) when the path weight from frequency discrimination to reading is again trivial, whereas reading at Time 5 is strongly predicted by reading and language skills at Time 3. It is interesting to note that executive function at Time 2 is a significant longitudinal predictor of frequency discrimination at Time 3, which is consistent with the theory that differences in attentional control and executive function determine children’s ability to perform the frequency-discrimination task.
Overall, the model for the whole sample provided a good fit to the data, χ2(254) = 426.126, p < .001, root-mean-square error of approximation (RMSEA) = 0.053, 90% confidence interval (CI) = [0.044, 0.061], comparative fit index (CFI) = 0.981, standardized root mean residuals (SRMR) = 0.054. Corresponding indices for the model excluding children with language disorder were similar, χ2(254) = 359.48, p < .001, RMSEA = 0.05; 90% CI = [0.038, 0.062], CFI = 0.98, SRMR = 0.056. For the Time 3 measures, the model for the whole sample accounted for 89% of the variance in language and 57% of the variance in reading (48% at Time 5) but only 33% of the variance in frequency discrimination (for the sample excluding children with language impairment, the amount of variance accounted for is comparable: 89%, 55%, and 24% of the variance in language, reading, and frequency discrimination, respectively, at Time 3).
Discussion
We assessed frequency discrimination, reading, language, and executive skills in a large sample of children with dyslexia and language impairment as well as typically developing control children. We found no evidence that children at family risk of dyslexia were impaired on a frequency-discrimination task, though only about 40% of the language-impaired group was able to complete this task at 4.5 years of age. Many of the children with language impairment who had failed to reach a threshold at 4.5 years of age did so at 5.5 years but performed poorly. This deficit reflected a lack of improvement in frequency-discrimination thresholds in the language-impaired group from age 4.5 to age 5.5 years—improvements that were clearly present in typically-developing children.
It has often been suggested that problems on auditory tasks might be related to problems of attention or executive control (e.g., Schulte-Körne & Bruder, 2010). It is therefore interesting that the language-impaired group scored more poorly than the other two groups on measures of these skills. Furthermore, in our longitudinal path model, we found clear evidence that performance on the frequency-discrimination task was predicted by variations in executive function. This suggests that previous findings of concurrent associations between behavioral measures of auditory processing and language or reading difficulties may reflect comorbid difficulties with executive control. While both executive function and language showed moderate correlations with frequency discrimination, it was executive function rather than language that was the better predictor of frequency-discrimination ability.
Our findings are consistent with those from several earlier concurrent studies showing that auditory processing difficulties are prevalent among children with language difficulties. However, like Boets and colleagues (2006, 2007), we found no evidence for a specific deficit in children at family risk of dyslexia who did not have concurrent language problems. The data are relevant to claims concerning low-level auditory processing deficits in dyslexia because many children in the family-risk and language-impaired groups are likely to develop reading problems (Snowling & Melby-Lervåg, 2016). However, in our longitudinal analyses, we found no evidence for a causal relationship between frequency discrimination and the development of reading or language skills. Training impaired frequency discrimination therefore cannot be recommended as an intervention for children with reading or language difficulties (McArthur et al., 2008).
To our knowledge, this is the first longitudinal study of young children with a sufficient sample size to assess the possible causal relationships between auditory deficits and the development of reading and language skills in an at-risk population. We found no support for the hypothesis that an auditory deficit (as assessed here by frequency discrimination) is predictive of later reading or language problems. However, we used only one measure of auditory processing, and therefore our conclusions must be limited. Moreover, our findings do not refute the possibility that auditory processing deficits measured early in development using neurophysiological methods that do not demand attention may be a useful biomarker of dyslexia risk (van der Leij et al., 2013; Volkmer & Schulte-Körne, 2018). Nevertheless, we would argue that the frequent co-occurrence of difficulties of executive control with both reading and language problems means that children with dyslexia or language impairment are likely to perform poorly on behavioral measures of auditory processing because of attentional difficulties.
Supplementary Material
Supplemental Material, HulmeSupplementalMaterial – Language Skills, but Not Frequency Discrimination, Predict Reading Skills in Children at Risk of Dyslexia
Supplemental Material, HulmeSupplementalMaterial for Language Skills, but Not Frequency Discrimination, Predict Reading Skills in Children at Risk of Dyslexia by Margaret J. Snowling, Debbie Gooch, Genevieve McArthur, and Charles Hulme in Psychological Science
Footnotes
Acknowledgements
We thank the team who collected the data, the families who participated, and Piers Dawes, Dea Nielsen, Elise de Bree, and Arne Lervåg for advice and assistance.
Action Editor
D. Stephen Lindsay served as action editor for this article.
Author Contributions
M. J. Snowling and C. Hulme conceived of the study and drafted the manuscript. C. Hulme performed the data modeling. D. Gooch developed the study materials and collected the data. G. McArthur developed the psychophysical tasks. All authors provided critical revisions to the final article.

Declaration of Conflicting Interests
The author(s) declared that there were no conflicts of interest with respect to the authorship or the publication of this article.
Funding
This study was funded by the Wellcome Trust Programme Grant 082036/B/07/Z.
References
Supplementary Material
Please find the following supplemental material available below.
For Open Access articles published under a Creative Commons License, all supplemental material carries the same license as the article it is associated with.
For non-Open Access articles published, all supplemental material carries a non-exclusive license, and permission requests for re-use of supplemental material or any part of supplemental material shall be sent directly to the copyright owner as specified in the copyright notice associated with the article.
