
Abstract
When estimating unknown quantities, people insufficiently adjust from values they have previously considered, a phenomenon known as anchoring. We suggest that anchoring is at least partially caused by a desire to avoid making extreme adjustments. In seven studies (N = 5,279), we found that transparently irrelevant cues of extremeness influenced people’s adjustments from anchors. In Studies 1–6, participants were less likely to adjust beyond a particular amount when that amount was closer to the maximum allowable adjustment. For example, in Study 5, participants were less likely to adjust by at least 6 units when they were allowed to adjust by a maximum of 6 units than by a maximum of 15 units. In Study 7, participants adjusted less after considering whether an outcome would be within a smaller distance of the anchor. These results suggest that anchoring effects may reflect a desire to avoid adjustments that feel too extreme.
When estimating unknown quantities, people insufficiently adjust from values they have previously considered, a phenomenon known as anchoring (Tversky & Kahneman, 1974). Although anchoring effects are among the most well-established phenomena in all of psychology, we still do not possess a complete understanding of why they occur. Consider two leading theories. 1 According to the theory of effortful adjustment (Epley & Gilovich, 2006), people sequentially adjust from anchor values, entertaining values that are increasingly distant from the anchor until they reach a value that is plausible enough to select. By this process, smaller anchors would cause estimates to settle at the lower end of the range of estimates that a person considers to be plausible, thereby producing an anchoring effect. According to the theory of scale distortion (Frederick & Mochon, 2012), considering a small anchor makes large values feel even larger by comparison, thus biasing estimates toward the anchor. For example, while 1,000 pounds might seem like a reasonable estimate of a giraffe’s weight in the absence of an anchor, the consideration of a small anchor (e.g., 15 pounds) may make 1,000 pounds seem unreasonably large.
In this article, we propose an additional explanation for why adjustments from anchors are often insufficient: extremeness aversion. Research suggests that when people are uncertain, they are averse to making extreme choices or judgments (e.g., Simonson, 1989; Simonson & Tversky, 1992; Teigen, 1983). 2 To our knowledge, no one has yet shown, or even suggested, that extremeness aversion may at least partially explain insufficient adjustment from anchor values. 3
In our research, we have found that the presence of an anchor makes estimates far from the anchor feel more extreme (see Study S1 in the Supplemental Material available online). This suggests that people may succumb to anchoring not because they effortfully adjust to the first plausible value they encounter, nor because considering a smaller anchor makes larger values seem even larger, but simply because people want to avoid providing an estimate that feels too extreme. If this hypothesis is true, then people’s estimates will be affected not only by the anchors themselves, but also by how extreme adjustments from these anchors are perceived to be. Thus, manipulations that change the perceived extremity of adjustments should also change how far people adjust their final estimates from anchors.
We report seven studies (N = 5,279) that examined whether increasing the perceived extremity of adjustments compels people to give estimates that are closer to the anchor. In Studies 1–6, we made adjustments feel more or less extreme by manipulating the maximum amount by which participants could adjust from an anchor when making their judgment. These experiments relied on the intuition that an estimate that is, say, 5 units away from an anchor is more likely to feel extreme when participants can adjust by a maximum of 5 units than when they can adjust by more than 5 units (e.g., 14 units). In Study 7 and Study S3 in the Supplemental Material, we manipulated the perceived extremity of adjustments by asking participants, right before they made their own estimate, to indicate whether the true answer would be within either a small or a large distance of the anchor. In all of our studies, our manipulations of perceived extremity were transparently random, using the last digit of participants’ mobile phone numbers. Our studies allowed us to examine whether people’s anchored estimates are influenced by an aversion to making extreme adjustments.
Studies 1–5
Because the methods and results of Studies 1–5 are similar, we describe them all at once. To enhance clarity, we report in our Method section only the critical features of each study. Additional details, such as the precise wording of comprehension checks and the inclusion of exploratory measures, are reported in the Supplemental Material (see the Appendix for a full table of contents of the Supplemental Material). We preregistered all of our studies (see the Open Practices section) and posted our materials and data here: https://osf.io/8rbvz/.
Method
Participants
We conducted each of these studies on Amazon’s Mechanical Turk (MTurk). In Studies 1 and 5, participants received $1 for completing the study, and in Studies 2–4, participants received $0.60. Participants in Studies 2–5 could earn additional money for accurate prediction performance. We decided in advance to collect data from 400 participants in Studies 1–3, 600 in Study 4, and 1,200 in Study 5. Across our studies, we preregistered different rules for excluding participants on the basis of past participation, duplicate responses, and performance on our comprehension check questions (see the Supplemental Material for details). We followed these rules exactly, except in Study 3, in which a programming error allowed 6 participants to incorrectly add 5 to the final digit of their mobile phone numbers. We excluded those participants, but including them does not change the statistical significance of our results. After these exclusions, our final sample sizes for Studies 1–5 were 345, 392, 369, 590, and 1,165 participants, respectively. The samples averaged 32–38 years of age, and were 28%–50% female.
Procedures
In all five studies, participants were asked to provide an estimate after considering an informative anchor value. In Study 1, participants were shown a series of products and their prices. For each one, they indicated how much a different version of that product would have to cost to make them indifferent between the two versions. For example, on one trial, participants were shown a pair of running shoes priced at $75 and were told that they could be delivered to them in 1 day. They were then asked how much they would be willing to pay for the same running shoes if they were delivered in 2 weeks instead of 1 day. On this trial, $75 served as the anchor. In Study 2, participants forecasted what a company’s stock price would be in a week, after considering the anchor of its current stock price. Finally, in Studies 3–5, participants estimated the total points scored in upcoming National Basketball Association (NBA) games, after considering the anchor of an expert prediction (obtained from historically wise sports betting markets). In all studies, participants made judgments of many different stimuli, and each one was presented on the screen one at a time, in a random order. Table 1 provides examples of each prediction task, as well as additional details about each study.
Judgment Domains, Example Questions, and Maximum Allowable Adjustments in Studies 1–5
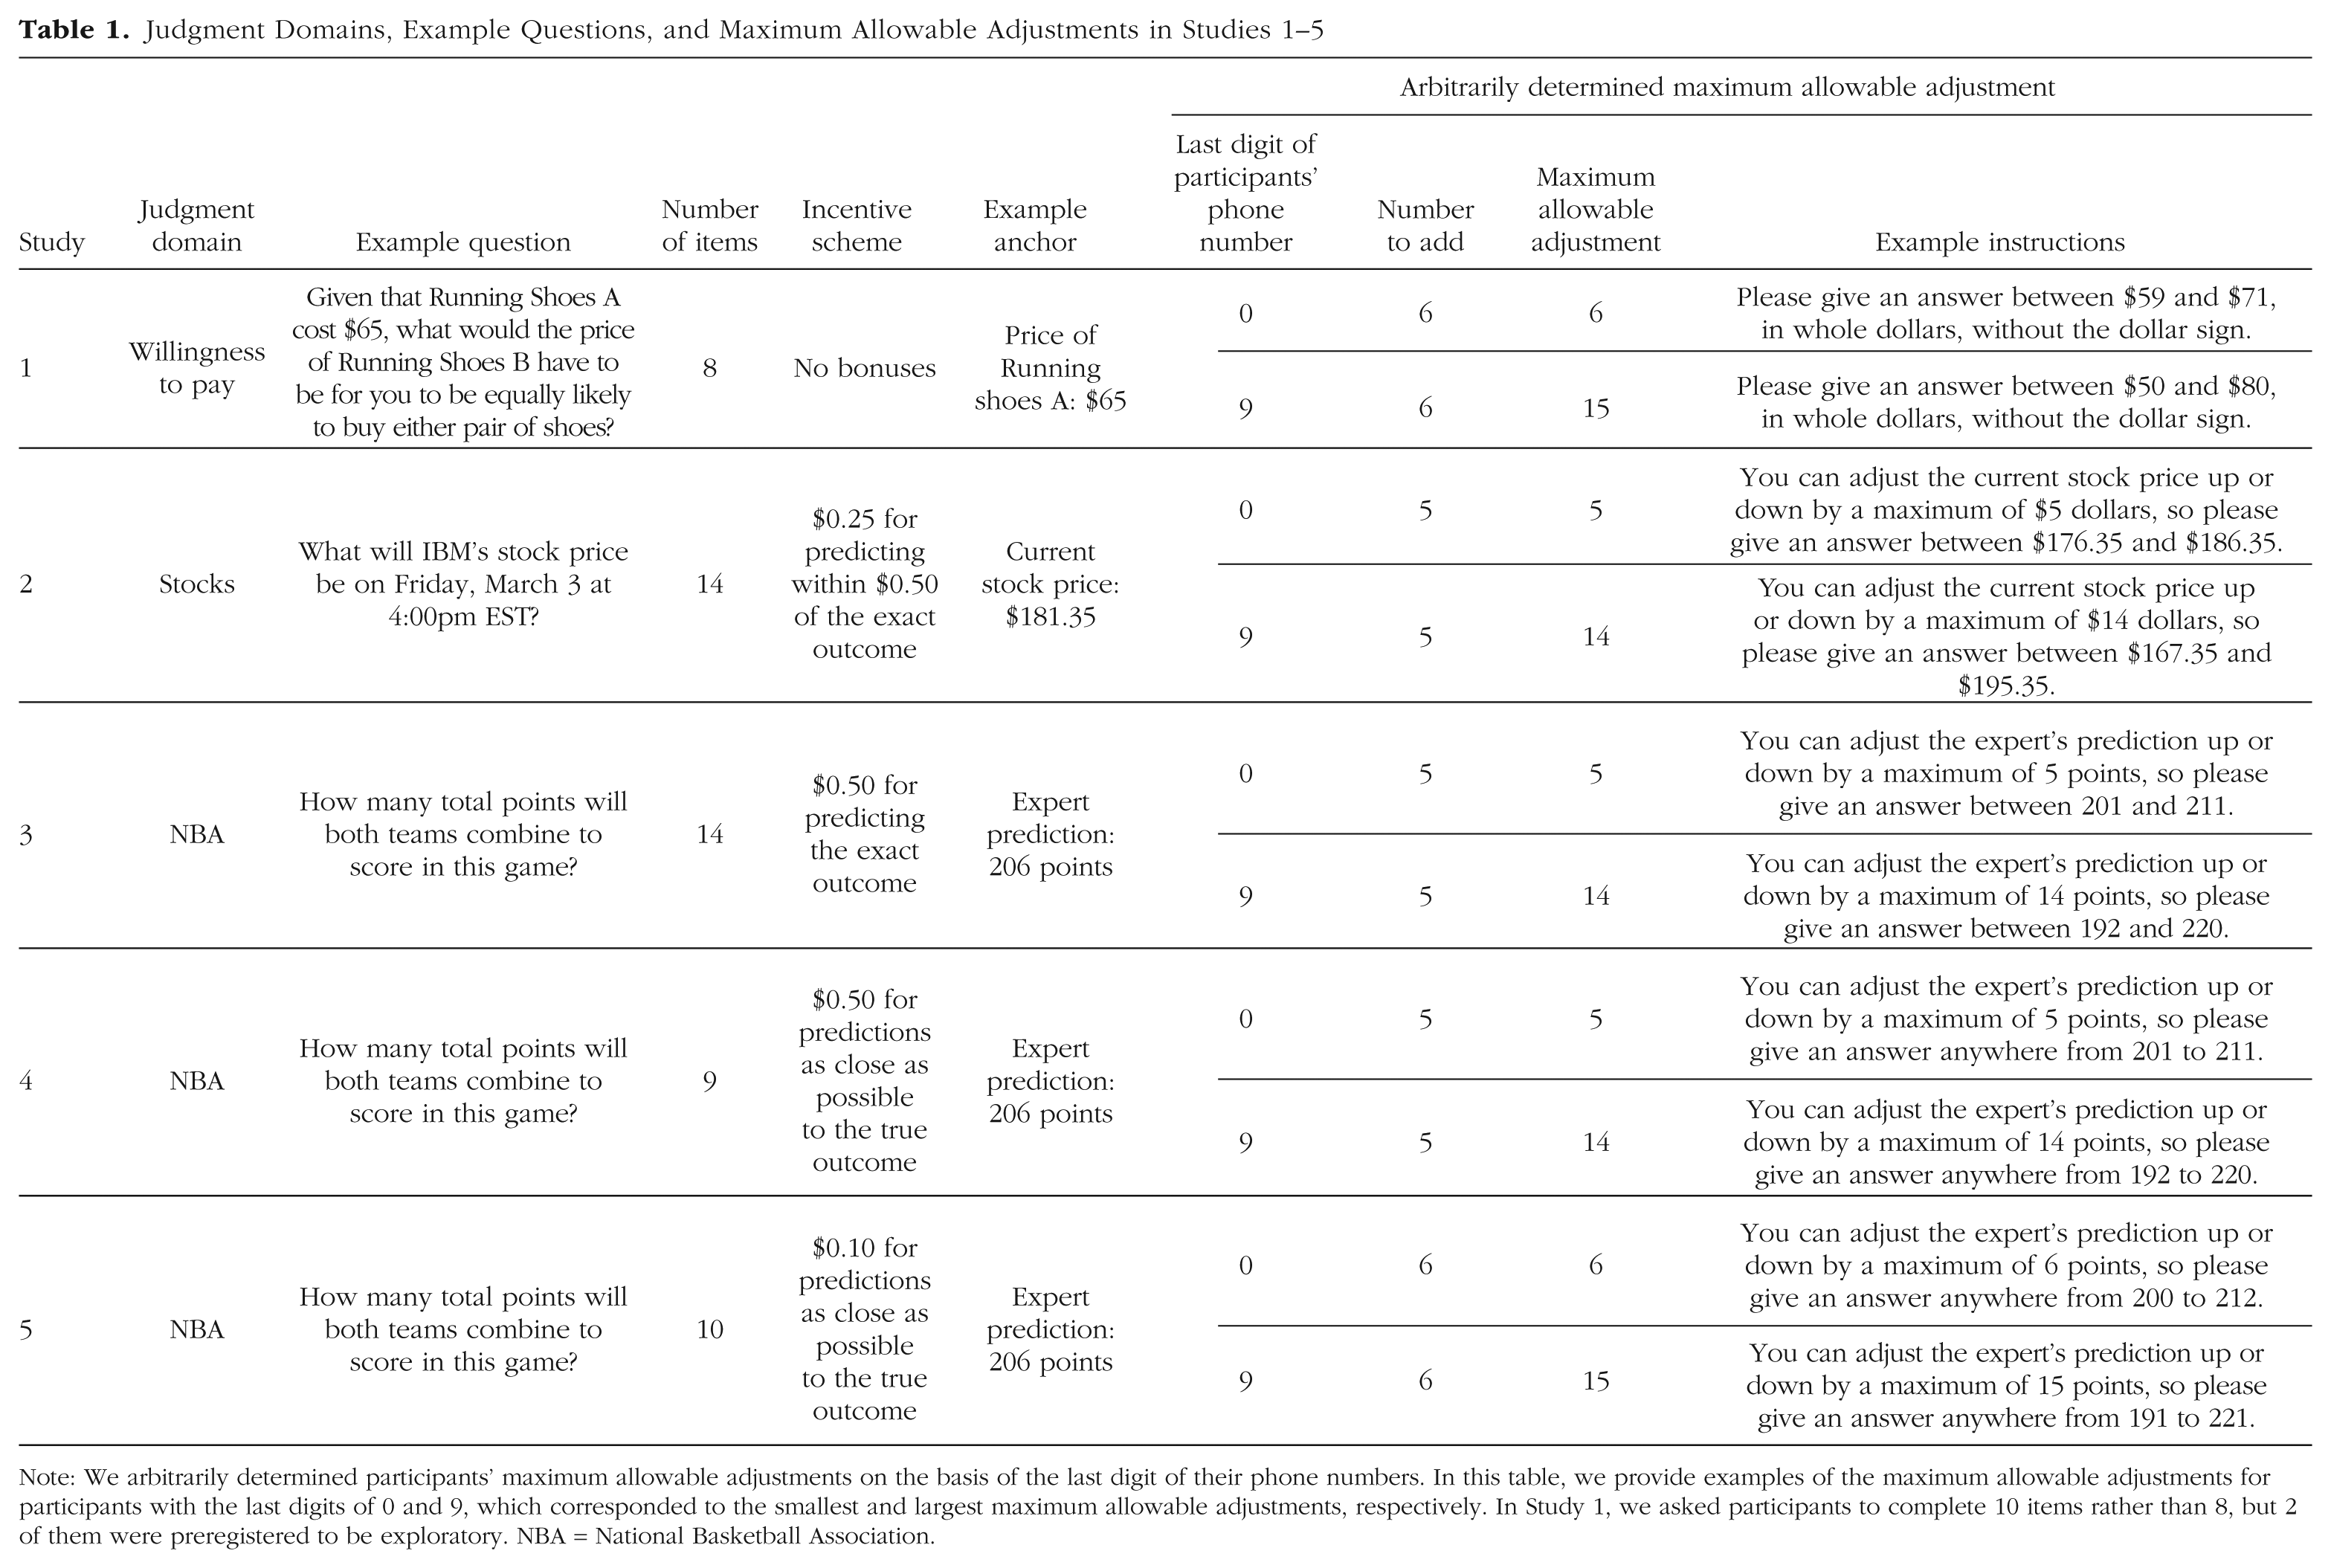
Note: We arbitrarily determined participants’ maximum allowable adjustments on the basis of the last digit of their phone numbers. In this table, we provide examples of the maximum allowable adjustments for participants with the last digits of 0 and 9, which corresponded to the smallest and largest maximum allowable adjustments, respectively. In Study 1, we asked participants to complete 10 items rather than 8, but 2 of them were preregistered to be exploratory. NBA = National Basketball Association.
In each study, we manipulated how far participants were allowed to adjust their estimates from the anchor values, and we did so in a way that was transparently random. At the beginning of each survey, we asked participants to input the last digit of their mobile phone number and then, depending on the study, to add 5 (Studies 2–4) or 6 (Studies 1 and 5) to it. For example, a participant in Study 5 with a last digit of 9 would compute the sum of 9 and 6 and enter the number 15. After reading about the judgment task, participants were informed that this number would determine the maximum amount by which they would be allowed to adjust from the anchor values, hereafter referred to as the maximum allowable adjustment. For example, a participant in Study 5 with a last digit of 0 and facing an anchor (expert prediction) of 200 points scored would have to forecast the total points scored in that NBA game to be between 200 – (0 + 6) = 194 and 200 + (0 + 6) = 206, whereas a participant with a last digit of 9 would have to forecast the total points scored to be between 200 – (9 + 6) = 185 and 200 + (9 + 6) = 215. To ensure that participants understood both how their maximum allowable adjustment was determined and that all participants’ maximum allowable adjustments were determined by the same method, we asked them to complete comprehension checks (see the Supplemental Material for details). This method of manipulating maximum allowable adjustments ensured that participants would not draw different inferences about the correct answer from the amounts they were given (Grice, 1975; see Ariely, Loewenstein, & Prelec, 2003, and Hoeffler, Ariely, & West, 2006, for use of a similar manipulation).
The studies offered varying incentives to participants for correct responses. Study 1 offered no incentive, Study 2 offered participants a bonus of $0.25 for each stock price prediction that was within $0.50 of the actual price, Study 3 offered participants a bonus of $0.50 for each total points prediction that was exactly correct, and Studies 4 and 5 offered participants a bonus of $0.50 and $0.10, respectively, for each estimate that was as close as possible to the truth given how much the participant was allowed to adjust. This “close-as-possible” incentive scheme was extremely conservative, incentivizing profit-maximizing participants to disconfirm our hypothesis, because adjusting the anchor by 6 points or more offered participants a higher probability of winning the bonus if the maximum allowable adjustment were 6 than if it were 15. To make this concrete, imagine you are a participant facing an anchor of 200, and you believe that the teams are most likely to score a total of 205 points. If you were allowed to adjust by only 6, up to 206, then an answer of 206 would pay out if the teams scored at least 206 points. Even though you believe that 205 is the most likely outcome, you should choose 206 if the teams’ probability of scoring more than 205 is greater than their probability of scoring exactly 205, as would almost certainly be the case. If, however, you were allowed to adjust by 15 points, then any answer between 206 and 214 would pay out only if your prediction were exactly correct. In this case, you may as well stay with your best guess of 205 (unless you want to try your luck with a faraway guess of 215 or larger). We attempted to make this incentive scheme extremely clear to participants, particularly in Study 5, when we included detailed comprehension checks pertaining to the incentive scheme before participants made their estimates (see the Supplemental Material for details).
In all studies, the survey ended by asking participants to report their gender and age.
Results
Analysis plan
These analyses tested whether participants were more reluctant to make large adjustments when their maximum allowable adjustment was smaller.
In all studies, we regressed the dependent measures on the last digit of participants’ mobile phone numbers, using ordinary least squares (OLS). In Study 1, we also included a covariate indicating which of the two product versions they judged, in accord with our preregistration. Each participant who fully completed the study contributed many observations to the data set, one for each of the judgments that they made. In all regression analyses, we included fixed effects for each prediction question, and we clustered standard errors by participant to account for the nonindependence of observations within participant.
Main analyses
Following our preregistrations, we constructed two dependent measures to assess the magnitude of participants’ adjustments. One is a binary variable indicating whether or not participants adjusted by at least the maximum amount allowed for those with the smallest allowable adjustments (i.e., those whose mobile phone numbers ended in 0). Thus, in Studies 1 and 5, this variable indicated whether or not participants adjusted by at least 6 units, and in Studies 2–4, this variable indicated whether or not participants adjusted by at least 5 units. The other dependent measure assessed participants’ absolute adjustments from the anchor value, winsorized at the maximum amount by which those with the smallest allowable adjustments (i.e., those whose mobile phone numbers ended in 0) were allowed to adjust. Thus, in Studies 1 and 5, any adjustment greater than 6 was set equal to 6, and in Studies 2–4, any adjustment greater than 5 was set equal to 5.
Extremeness aversion predicts that people would be less likely to adjust by at least 6 units when they were allowed to adjust by a maximum of 6 units than when they were allowed to adjust by a maximum of 15 units. More formally, this hypothesis predicts that participants who were allowed to adjust by a smaller amount (i.e., those with smaller mobile phone digits) would be less likely to adjust by at least 6 units than those who were allowed to adjust by a larger amount (i.e., those with larger mobile phone digits). Figure 1 shows that this hypothesis was supported in all five studies and on both measures of adjustment. For example, in Study 5, participants were less likely to adjust by at least 6 points when they were allowed to adjust by up to 6 points (44%) than when they were allowed to adjust by up to 15 points (57%). Using the winsorized adjustment measure, we found that Study 5 participants adjusted less when they could adjust by up to 6 points (M = 3.90) than when they could adjust by up to 15 points (M = 4.36).

Results of Studies 1–5: percentage of participants who adjusted their estimate by at least the maximum amount allowed for those with the smallest allowable adjustments (left column) and the winsorized average amount of adjustment (right column) as a function of the maximum allowable adjustment. Each error bar represents ±1 clustered standard error. The lines of best fit were calculated by regressing the dependent variable on the maximum allowable adjustment. The results for the binary dependent variable (in the left column) are robust to the use of logit regressions. Data and R code for this figure are available at https://osf.io/8rbvz/.
Study 6
The results of Studies 1–5 support our extremeness aversion account of anchoring, which predicts that people will be reluctant to make adjustments that feel extreme. The results are inconsistent with the effortful-adjustment account, which posits that people will stop effortfully adjusting from the anchor once they reach a plausible value, and thus does not predict that people’s estimates will be affected by the maximum amount by which they are allowed to adjust. However, unlike the effortful-adjustment account, the scale-distortion account could potentially explain these findings if participants were anchored to the end points of the range of allowable estimates. For example, if a participant in Studies 1–5 decided to adjust upward from the provided anchor and then also became anchored to the maximum allowable estimate, then a larger maximum allowable estimate may lead the participant to make a larger estimate, resulting in a larger adjustment from the anchor. To eliminate this possibility, we conducted Study 6, in which we elicited estimates on a multiple-choice scale that displayed the same range of estimates to all participants, manipulating only the availability of radio buttons underneath the scale.
Method
Participants
We conducted Study 6 on MTurk. Participants received $0.80 for completing the study and could earn additional money (between $0 and $1.10) for accurate prediction performance. We decided in advance to collect data from 1,200 participants, and we followed our preregistered rules for excluding participants on the basis of past participation, duplicate responses, and performance on our comprehension check questions (see the Supplemental Material for details). After these exclusions, our final sample size was 1,186. The sample averaged 34 years of age and was 39% female.
Procedure
As in Studies 3–5, participants estimated the total points scored in upcoming NBA basketball games, after considering the anchor of an expert prediction (obtained from historically wise sports betting markets). Participants made 11 judgments, and each one was presented on the screen one at a time, in a random order (see Fig. 2 for examples).
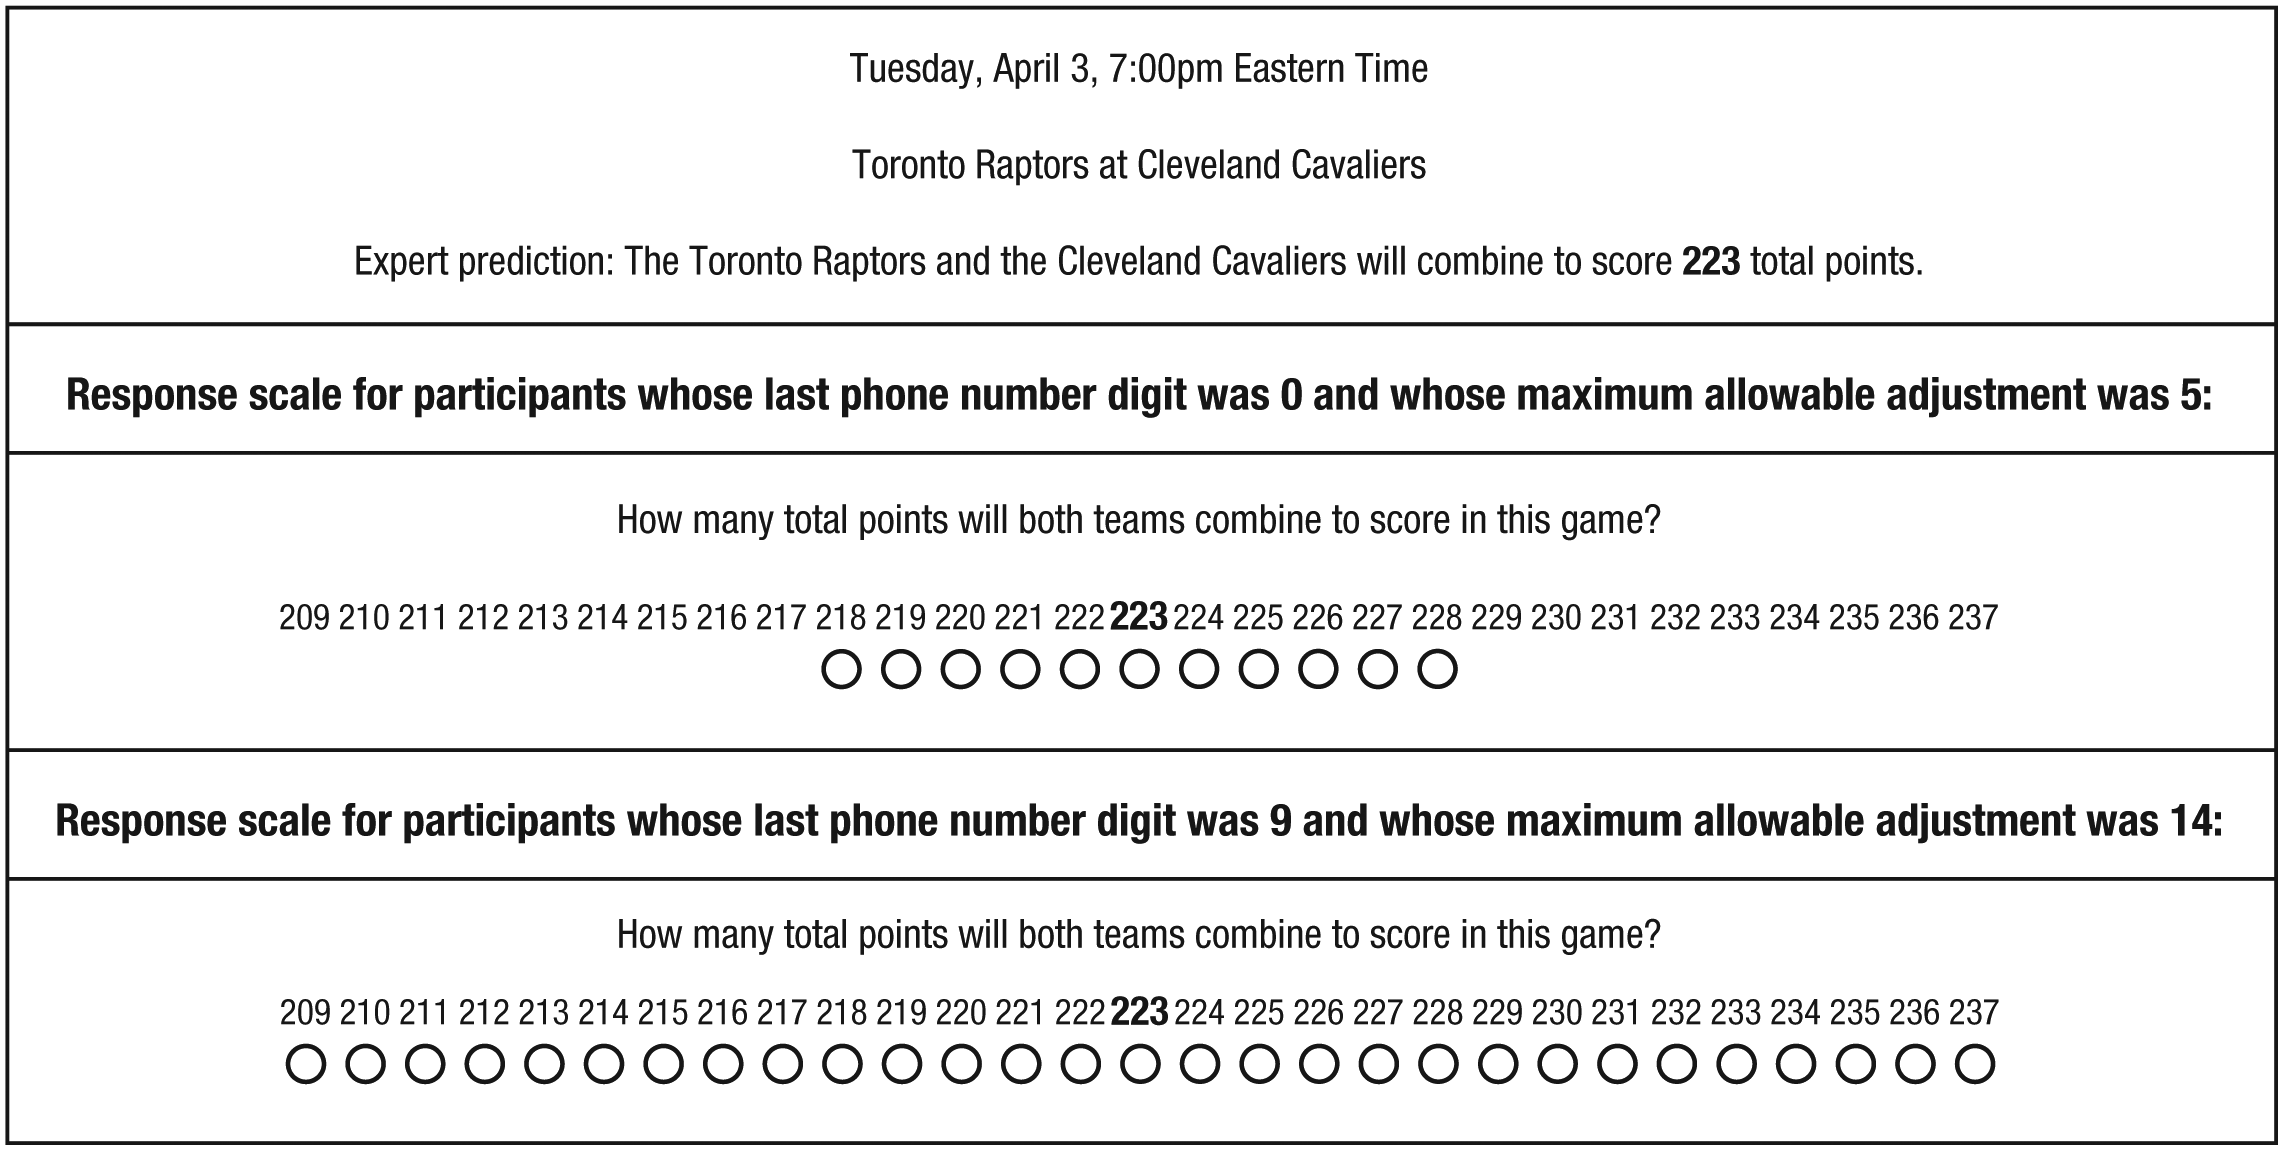
Example of the extremeness manipulation in Study 6, when the last digit of a participant’s phone number was 0 (top) or 9 (bottom). The numbers displayed on the response scale were held constant across conditions, and so only the availability of radio buttons differed between conditions.
As in our previous studies, we manipulated how far participants were allowed to adjust from the expert prediction, and we did so in a way that was transparently random. At the beginning of the survey, we asked participants to provide the last digit of their mobile phone numbers and to then add 5 to it. For example, a participant with a last digit of 9 would compute the sum of 9 and 5 and enter the number 14. After reading about the judgment task, participants were informed that this number would determine the maximum amount by which they would be allowed to adjust from the expert prediction.
In Study 6, we wanted to ensure that the bounds of the response scale would not differ across conditions. So, in contrast to Studies 1–5, all participants in Study 6 made their estimates on a multiple-choice scale that displayed all of the possible estimate values that were available to participants who had the largest maximum allowable adjustment (i.e., all estimate values that were within 14 points of the expert prediction; see Fig. 2). However, whereas all of these estimate values were visible to all participants, the availability of the radio buttons underneath those estimate values depended on each participant’s maximum allowable adjustment. Specifically, a radio button was displayed under each available estimate value but not under the unavailable estimate values. For example, a participant facing an expert prediction of 223 with a last digit of 9 (and hence, a maximum allowable adjustment of 14) would have radio buttons available and visible for the full range of estimates, between 223 – (9 + 5) = 209 and 223 + (9 + 5) = 237. In contrast, a participant with a last digit of 0 (and hence, a maximum allowable adjustment of 5) would see estimate values for the same range of estimates as the participant with a last digit of 9 (i.e., from 209 to 237), but the radio buttons would be visible and available only for estimates between 223 – (0 + 5) = 218 and 223 + (0 + 5) = 228 (see Fig. 2; Study S2 in the Supplemental Material shows that this manipulation was successful in altering the perceived extremity of various estimates). Because all participants saw the same range of estimate values regardless of their maximum allowable adjustment, any effect of our manipulation could not be due to participants being anchored to different scale end points.
As in Studies 1–5, to ensure that participants understood both how their maximum allowable adjustment was determined and that all participants’ maximum allowable adjustments were determined by the same method, we asked them to complete a comprehension check. Specifically, we asked them, “How do we determine by how much participants can adjust the expert predictions?” and they had to select the correct answer—“All participants can adjust the expert prediction up or down by a maximum of 5 points plus the last digit of their phone number”—from a set of four choices. If they answered correctly, they could move on with the survey. If they answered incorrectly on their first or second attempt, we reminded them of the instructions and gave them another opportunity to answer correctly. If participants answered the question incorrectly a third time, they were prevented from continuing with the study.
To ensure that participants would still be motivated to provide an estimate as close as possible to their preferred estimate, even when their preferred estimate was beyond their maximum allowable adjustment, we paid participants according to how close their estimate was to the true total points scored. Specifically, we paid a bonus of $0.01 for estimates that were 10 points from the true total point scored, $0.02 for estimates that were 9 points from the true total points scored, and so on. Thus, participants earned $0.10 for estimates that were exactly correct.
The survey ended by asking participants to report their gender and age.
Results
Following our preregistration, we constructed two dependent measures to assess the magnitude of participants’ adjustments. One was a binary variable indicating whether or not participants adjusted by at least 5 points (the maximum allowable adjustment for those whose mobile phone numbers ended in 0). The other dependent measure assessed participants’ absolute adjustments from the anchor value, winsorized at 5 points.
Extremeness aversion predicts that participants who were allowed to adjust by a smaller amount (i.e., those with smaller mobile phone digits) would be less likely to adjust by at least 5 points than those who were allowed to adjust by a larger amount (i.e., those with larger mobile phone digits). This hypothesis was supported for both measures of adjustment (ps < .001; see Fig. 3 for a depiction of the results). For example, participants were less likely to adjust by at least 5 points when they were allowed to adjust by up to 5 points (19%) than when they were allowed to adjust by up to 14 points (39%). Using the winsorized adjustment measure, participants adjusted less when they could adjust by up to 5 points (M = 2.49) than when they could adjust by up to 14 points (M = 3.01). These results follow perfectly from the extremeness aversion theory of anchoring and, because all participants were exposed to the same range of estimate values, are not easily explained by the scale-distortion theory of anchoring.
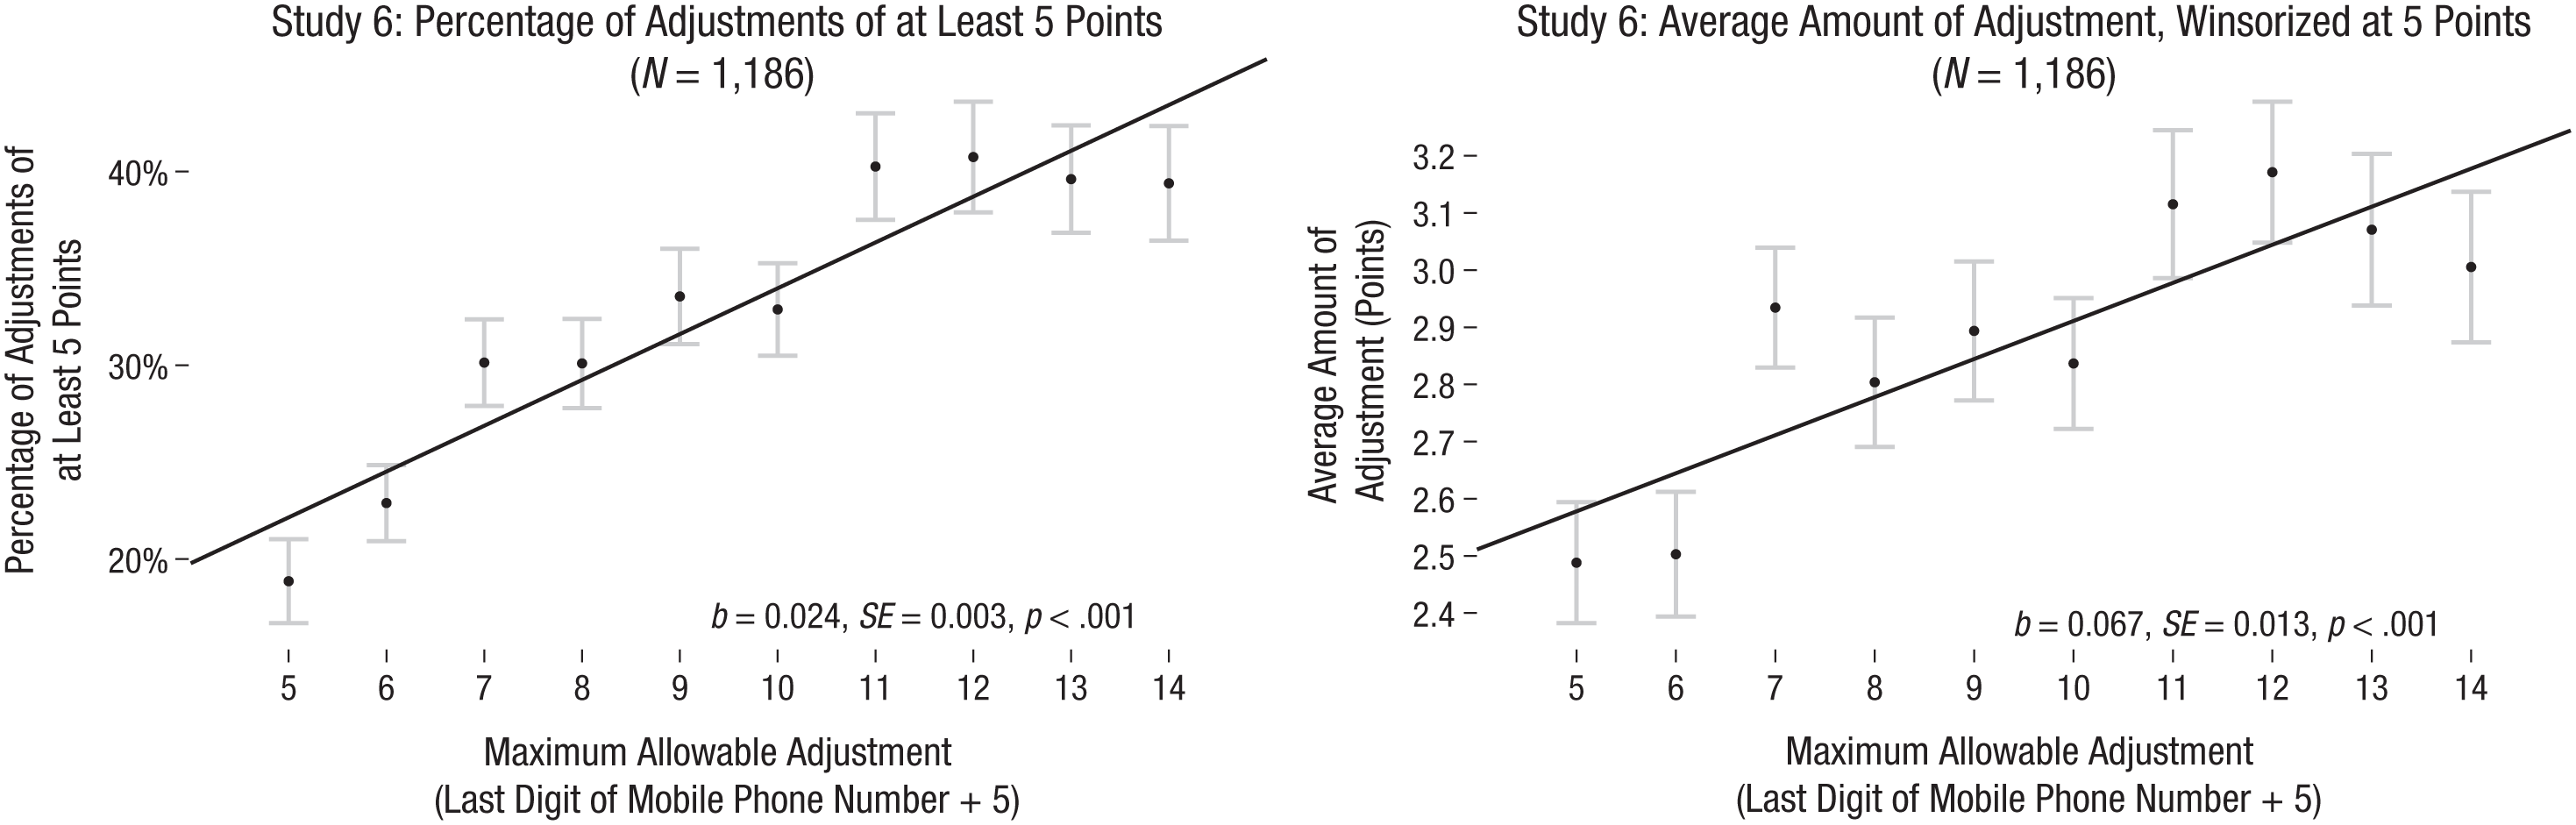
Results of Study 6: percentage of participants who adjusted their estimate by at least 5 points (left) and the winsorized average amount of adjustment (right) as a function of the maximum allowable adjustment. Each error bar represents ±1 clustered standard error. The lines of best fit were calculated by regressing the dependent variable on the maximum allowable adjustment. The results for the binary dependent variable (in the left panel) are robust to the use of logit regressions. Data and R code for this figure are available at https://osf.io/8rbvz/.
Study 7
In Study 7, we wanted to further ensure that our results could not be caused by participants being anchored to different minimum or maximum allowable estimates, and we also wanted to examine whether our findings generalize to circumstances in which we do not impose limits on participants’ response options. To accomplish this, we manipulated the perceived extremity of adjustments without altering participants’ maximum allowable adjustments. Before participants estimated the number of hits in an upcoming baseball game, we asked them whether the correct answer would be within a certain distance of an anchor, and we manipulated this distance to be small or large using the last digits of participants’ mobile phone numbers. We predicted that participants would adjust by a smaller amount when they were asked, before making their estimate, whether the correct answer was within a smaller distance from the anchor.
Method
Participants
We conducted Study 7 on MTurk. Participants received $0.80 for completing the study and could earn additional money (between $0 and $0.90) for accurate prediction performance. We decided in advance to collect data from 1,500 participants, and we followed our preregistered rules for excluding participants on the basis of past participation, duplicate responses, performance on our comprehension check questions, and the time at which they started the survey (see the Supplemental Material for details). Also, following our preregistration, we excluded participants whose final phone number digit was equal to 0, because we thought it might be confusing for participants to be asked whether the correct answer was within 0 of the anchor value. (It turned out that including these participants would have increased the significance of our results.) After these exclusions, our final sample size was 1,232. The sample averaged 37 years of age and was 42% female.
Procedure
Participants estimated how many hits would be accumulated in upcoming Major League Baseball games after considering an expert prediction as an anchor (obtained from a statistical model based on historically wise sports betting markets). Participants made 9 judgments, and each one was presented on the screen one at a time, in a random order (see Fig. 4 for examples).
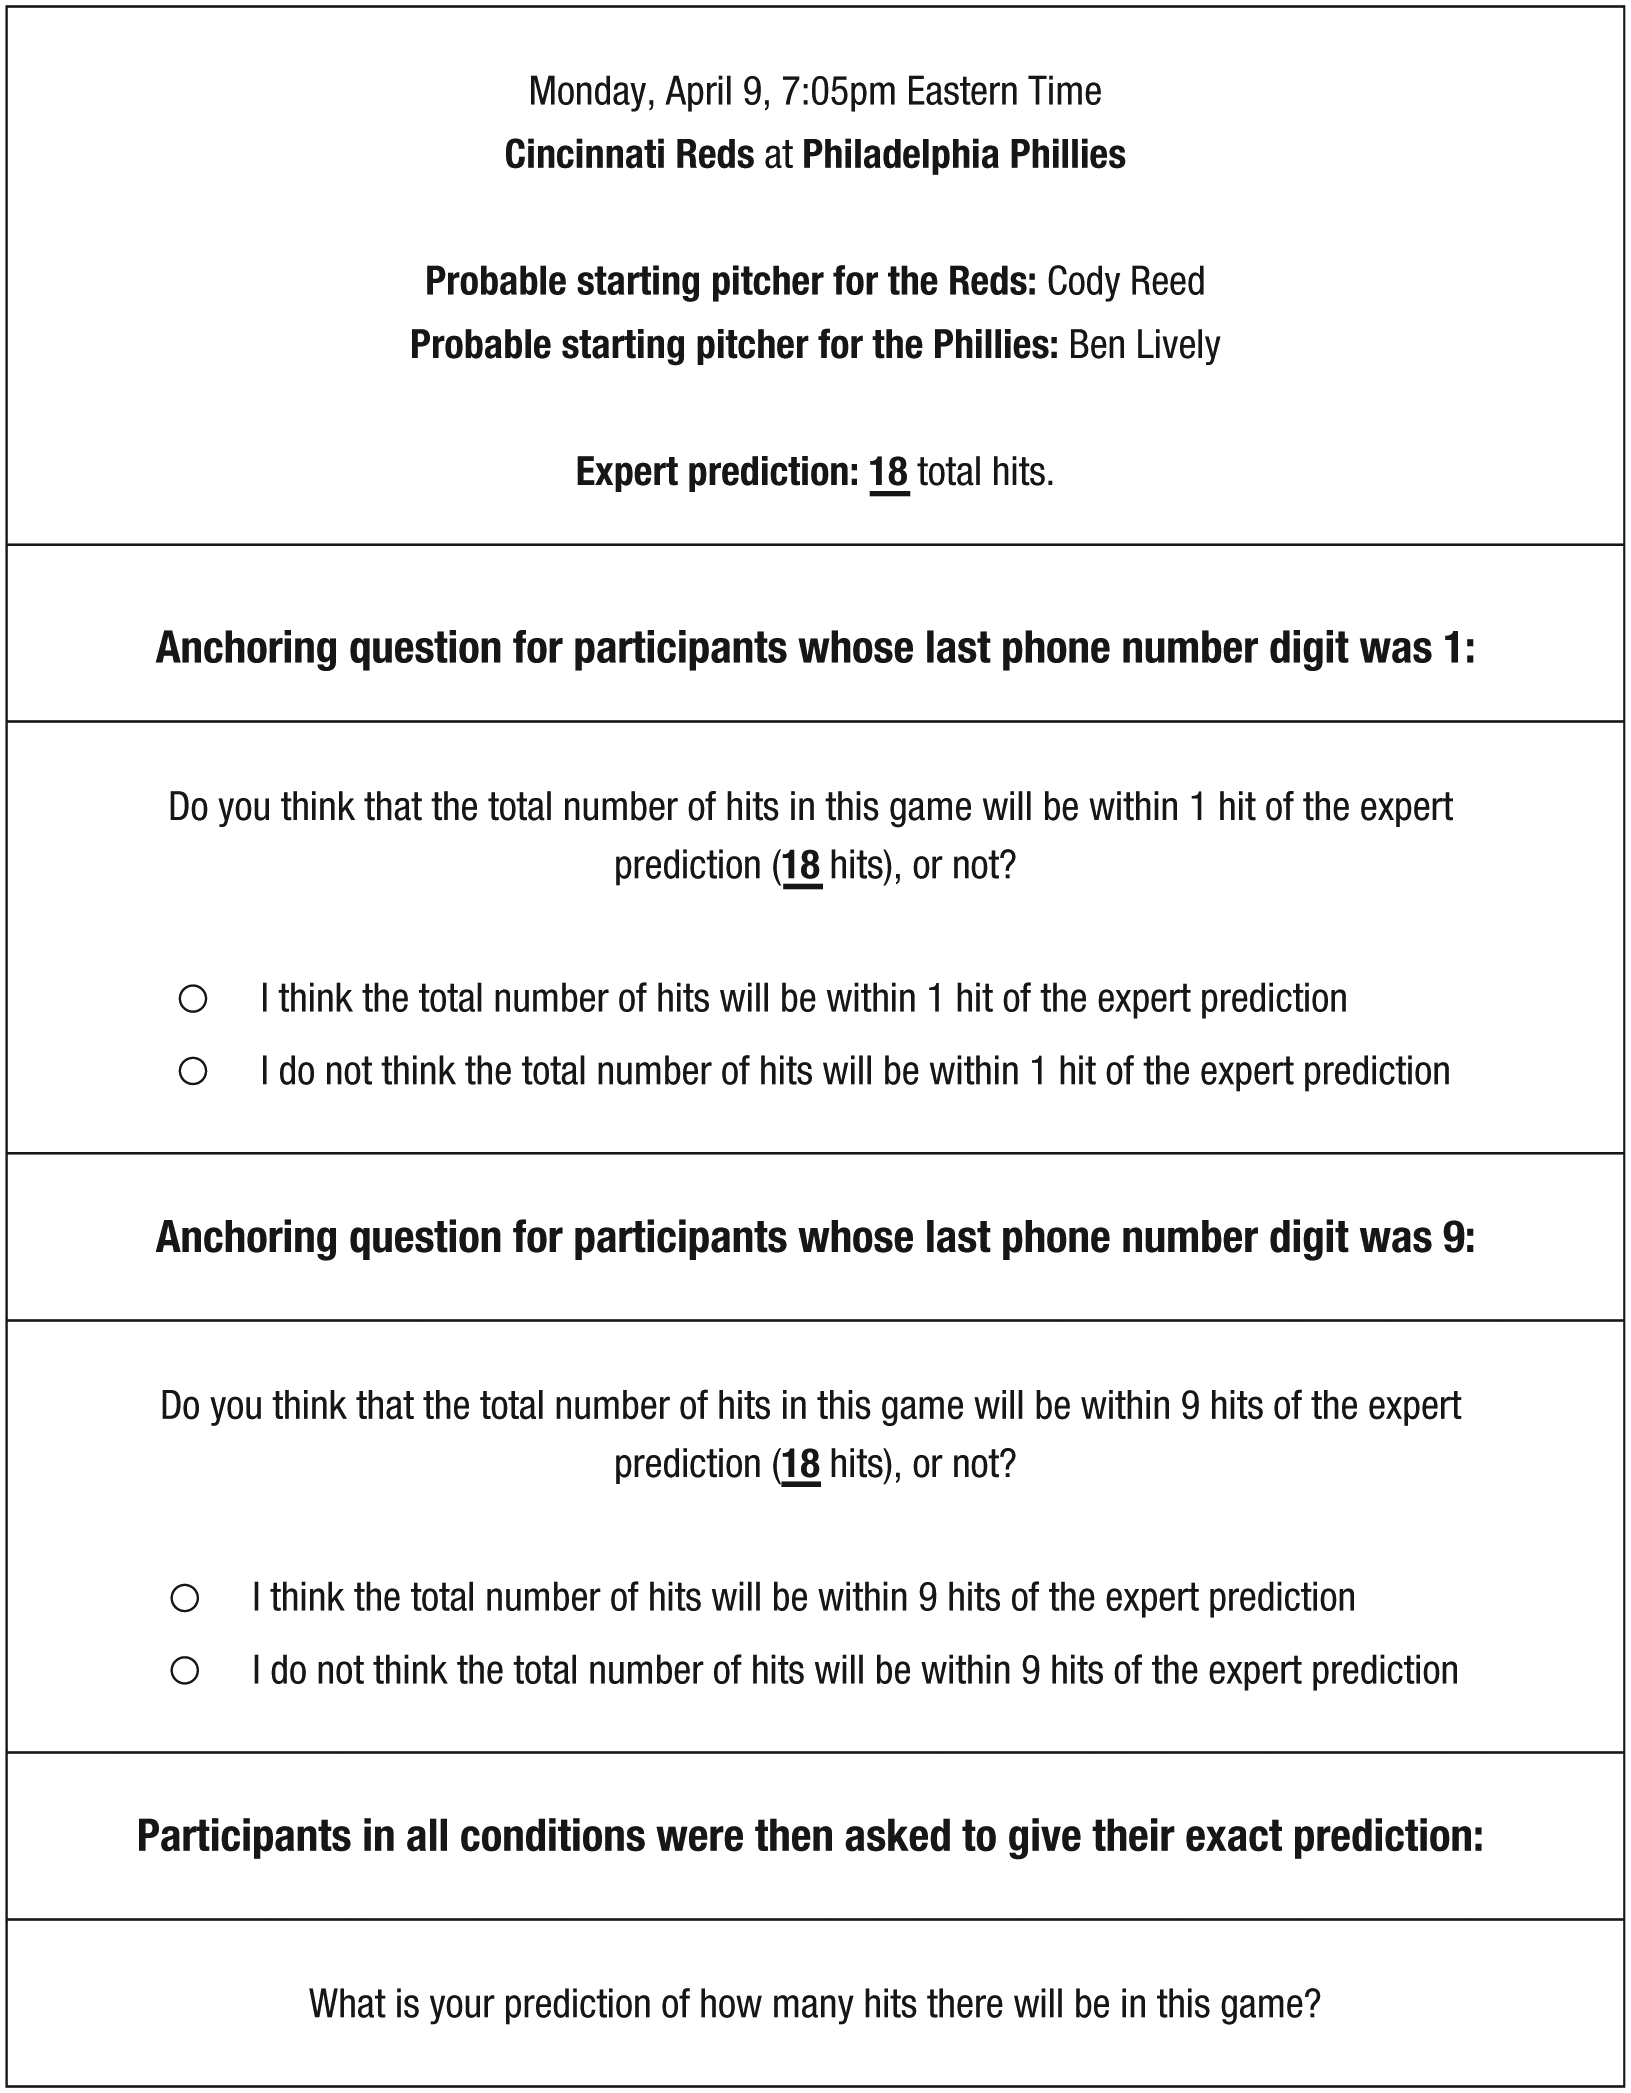
Example of the extremeness manipulation in Study 7, when the last digit of a participant’s phone number was 1 (top) or 9 (bottom).
Instead of manipulating how far participants were allowed to adjust their estimates from the expert prediction, we used a different manipulation of perceived extremity. Specifically, before participants made each estimate, we asked them whether they thought the true number of hits would be within a certain distance of the expert prediction, and we varied this distance using the last digit of their mobile phone numbers (see Fig. 4). For example, given an expert prediction of 18 hits, a participant whose last phone number digit was 1 was asked, “Do you think that the total number of hits in this game will be within 1 hit of the expert prediction (18 hits), or not?” A participant with a last digit of 9 was instead asked, “Do you think that the total number of hits in this game will be within 9 hits of the expert prediction (18 hits), or not?” To enable this manipulation, we asked participants to provide the last digit of their mobile phone numbers at the beginning of the survey. After reading about the judgment task, participants were told how this number would determine the range of hits around the expert prediction that they would consider before they made their estimates.
To ensure that participants understood how we would determine the range of hits that they would consider, that this range was uninformative, and that it did not influence what values they were allowed to estimate, we asked them to complete comprehension checks (see the Supplemental Material for details). To motivate participants to make accurate estimates, we paid them a bonus of $0.10 for each game in which they correctly predicted the number of hits. The survey ended by asking participants to report their gender and age.
Results
Following our preregistration, we defined our dependent variable as the absolute adjustment from the expert prediction, winsorized at the 98th percentile of adjustments for each game. Extremeness aversion predicts that participants who had previously considered a smaller range around the expert prediction before making their estimate (i.e., those with smaller mobile phone digits) would adjust the expert prediction by less than those who had previously considered a larger range around the expert prediction (i.e., those with larger mobile phone digits). As shown in Figure 5, this hypothesis was supported (p < .001). For example, participants adjusted less when they had previously considered a range of 1 point around the expert prediction (M = 2.82) than when they had previously considered a range of 9 points around the expert prediction (M = 4.03). In Study S3, we replicated these results using transparently uninformative anchors (see the Supplemental Material).

Results of Study 7: average amount of adjustment (winsorized at the 98th percentile of adjustments for each game) as a function of the range considered around the expert prediction. Each error bar represents ±1 clustered standard error. The line of best fit was calculated by regressing the winsorized adjustment on participants’ last digits. Data and R code for this figure are available at https://osf.io/8rbvz/.
General Discussion
In seven studies, we found that transparently irrelevant cues of extremeness influence people’s adjustments from anchors. In Studies 1–6, we found that participants were less likely to adjust beyond a particular amount when that amount was closer to the maximum allowable adjustment. In Study 7, we found that participants adjusted less after considering whether an outcome would be within a smaller distance of the anchor. Importantly, we observed these results even though participants knew that these cues of extremeness were uninformative and that other participants observed different cues. Moreover, we observed these results in different domains, with both informative and transparently uninformative anchors (Study S3) and under different incentive schemes, including an incentive scheme that should have motivated participants to disconfirm our hypothesis. Taken together, these findings suggest that extremeness aversion may cause anchoring in a wide range of contexts.
Theoretically, the argument that extremeness aversion causes anchoring rests on the assertion that, all else equal, people will be less willing to make estimates beyond a certain point when that point is judged to be more extreme. This account makes specific, falsifiable predictions. For example, it predicts that anchors will be most influential when they increase the perceived extremity of the values that would be estimated in the absence of an anchor. This account is also more parsimonious than existing theories of anchoring. For example, unlike theories of effortful adjustment, extremeness aversion does not assume that people always adjust sequentially away from anchor values, nor does it assume that people always stop once they reach a plausible value. And, unlike scale distortion, extremeness aversion does not assume that anchors always change which value on a numerical scale seems to correspond to a given stimulus and thus more easily predicts that anchoring effects will occur even for people who are very familiar with the relevant scale, as is usually the case for experts (e.g., Mussweiler, 2001; Northcraft & Neale, 1987; Russo & Schoemaker, 1989). According to the extremeness aversion account, anchoring effects occur simply because the presentation of an anchor makes values far away from the anchor seem more extreme and values close to the anchor seem less extreme (see Study S1).
Despite the relatively strong assumptions made by scale distortion and effortful adjustment, they cannot easily account for the results herein. First, consider effortful adjustment. This theory posits that people stop effortfully adjusting when they reach the nearest plausible value to the anchor but posits no effect of the anchor on the range of plausible values itself. Thus, it does not predict that a maximum allowable adjustment would exert any influence on people’s estimates. To account for our results, effortful-adjustment theorists would have to add assumptions to their account that would make it nonfalsifiable. For example, they would have to assume that all of our manipulations of perceived extremity somehow altered how big or effortful each sequential adjustment was.
Scale distortion also struggles to parsimoniously account for our results. First, consider that in Studies 1–6, we always manipulated the extremity of estimates to the same extent both above and below the anchor. According to scale distortion, it is unclear whether a larger maximum allowable adjustment would make estimates feel larger (because of the contrast with a smaller minimum allowable estimate) or smaller (because of the contrast with a larger maximum allowable estimate). Thus, this account does not predict how (or whether) participants’ mental scales would have been distorted by our manipulations. Second, in Studies 6 and 7, we more effectively ruled out the possibility of scale distortion explaining our results by removing the need to remind participants of the minimum and maximum allowable estimates. In Study 6, we did so by eliciting estimates on a multiple-choice scale that displayed the same range of estimate values in all conditions, manipulating only the availability of radio buttons underneath the scale. In Study 7, we eliminated any mention of minimum or maximum allowable estimates, while allowing participants to make estimates on an unbounded scale. In both studies, the results supported the extremeness-aversion account and not the scale-distortion account.
Although neither effortful adjustment nor scale distortion can fully explain our results, these processes may operate alongside extremeness aversion to determine how anchors influence judgments in some contexts. For example, scale distortion may be a cause of anchoring in sequential judgments (Mochon & Frederick, 2013), while effortful-adjustment processes may affect how incentives influence anchoring effects (Simmons, LeBoeuf, & Nelson, 2010).
In sum, our results suggest that anchoring effects are at least partially caused by extremeness aversion, and people’s conservative adjustments from anchors may often reflect a Goldilocks-like desire to make adjustments that seem neither too big nor too small.
Supplemental Material
LewisOpenPracticesDisclosure – Supplemental material for Extremeness Aversion Is a Cause of Anchoring
Supplemental material, LewisOpenPracticesDisclosure for Extremeness Aversion Is a Cause of Anchoring by Joshua Lewis, Celia Gaertig and Joseph P. Simmons in Psychological Science
Supplemental Material
LewisSupplementalMaterial – Supplemental material for Extremeness Aversion Is a Cause of Anchoring
Supplemental material, LewisSupplementalMaterial for Extremeness Aversion Is a Cause of Anchoring by Joshua Lewis, Celia Gaertig and Joseph P. Simmons in Psychological Science
Footnotes
Appendix
Table A1 displays the contents of the Supplemental Material available online.
Acknowledgements
We thank the Wharton Behavioral Laboratory, the Wharton Baker Retailing Center, and the Wharton Risk Center.
Action Editor
Timothy J. Pleskac served as action editor for this article.
Author Contributions
J. Lewis and C. Gaertig designed and ran the studies. J. Lewis analyzed the data. J. Lewis, C. Gaertig, and J. P. Simmons wrote the manuscript. All the authors approved the final manuscript for submission.
Declaration of Conflicting Interests
The author(s) declared that there were no conflicts of interest with respect to the authorship or the publication of this article.
Funding
This work was supported by the Wharton Behavioral Laboratory, the Wharton Baker Retailing Center, and the Wharton Risk Center.
Open Practices
All data and materials have been made publicly available via the Open Science Framework and can be accessed at https://osf.io/8rbvz/. The design and analysis plans for the experiments were preregistered at http://AsPredicted.org and can be accessed at the following links: Study 1: https://aspredicted.org/2tw73.pdf Study 2: https://aspredicted.org/52ta8.pdf Study 3: https://aspredicted.org/pu3tp.pdf Study 4: https://aspredicted.org/7hd6a.pdf Study 5: https://aspredicted.org/tx79j.pdf Study 6: https://aspredicted.org/ev7ab.pdf Study 7: https://aspredicted.org/sp3rv.pdf Study S1: https://aspredicted.org/uq9fa.pdf Study S2: https://aspredicted.org/7mu3q.pdf Study S3: https://aspredicted.org/tb5x3.pdf
The complete Open Practices Disclosure for this article can be found at http://journals.sagepub.com/doi/suppl/10.1177/0956797618799305. This article has received the badges for Open Data, Open Materials, and Preregistration. More information about the Open Practices badges can be found at ![]() .
.
Notes
References
Supplementary Material
Please find the following supplemental material available below.
For Open Access articles published under a Creative Commons License, all supplemental material carries the same license as the article it is associated with.
For non-Open Access articles published, all supplemental material carries a non-exclusive license, and permission requests for re-use of supplemental material or any part of supplemental material shall be sent directly to the copyright owner as specified in the copyright notice associated with the article.