



Abstract
There are many instances, both in professional domains such as law, forensics, and medicine and in everyday life, in which an effect (e.g., a piece of evidence or event) has multiple possible causes. In three experiments, we demonstrated that individuals erroneously assume that evidence that is equally predicted by two competing hypotheses offers no support for either hypothesis. However, this assumption holds only in cases in which competing causes are mutually exclusive and exhaustive (i.e., exactly one cause is true). We argue that this reasoning error is due to a zero-sum perspective on evidence, wherein people assume that evidence that supports one causal hypothesis must disconfirm its competitor. Thus, evidence cannot give positive support to both competitors. Across three experiments (N = 49, N = 193, N = 201), we demonstrated that this error is robust to intervention and generalizes across several different contexts. We also ruled out several alternative explanations of the bias.
Keywords
In 2001, Barry George was convicted of the shooting of Jill Dando, a TV celebrity, outside her flat in broad daylight. The main evidence against him was a single particle of firearm discharge residue (FDR) found in his coat pocket. In 2007, the Court of Appeal concluded that the FDR evidence was not probative in favor of guilt because, contrary to what had been suggested in the original trial, it was equally likely to have arisen because of poor police procedures (such as the coat being exposed to FDR during police handling) as from him having fired the gun that killed Dando. Hence, his conviction was overturned and a retrial ordered, in which Barry George was set free.
How valid was the court’s argument that the FDR was nonprobative? Fenton, Berger, Lagnado, Neil, and Hsu (2014) showed that the main argument presented in the appeal judgment may have been flawed: The argument assumed that if a piece of evidence (the FDR in the coat pocket) is equally probable under two alternative hypotheses (Barry George fired the gun vs. poor police handling of evidence), then it cannot support either of these hypotheses. But this assumption holds only if the two alternative hypotheses are mutually exclusive and exhaustive (i.e., exactly one of these two hypotheses is true). In the Barry George case, this assumption was clearly not met; it is possible that he fired the gun, there was also poor police handling of the evidence, and also that neither were true (e.g., the FDR particle came from elsewhere). Therefore, rather than being neutral, the FDR evidence may have been probative against Barry George (albeit weakly). The FDR evidence does not discriminate “Barry George fired the gun” from “poor police handling of evidence,” but it does discriminate “Barry George fired the gun” from “Barry George did not fire the gun.” It is the latter hypothesis pair that was the target in this criminal investigation.
This error was committed in the highly charged context of a criminal appeal, involving legal and forensic experts. But it identifies a reasoning error that is potentially very pervasive, as it goes to the heart of standard methods for evaluating evidence in terms of likelihood ratios and also arises informally in many contexts in which evidence is evaluated. In this article, we demonstrate that the reasoning error is prevalent in everyday lay judgments about the value of evidence and that it persists despite attempts to alleviate the bias through clarifying instructions. Furthermore, we show that people are perfectly capable of assessing the value of negative evidence, using it to rule out hypotheses accordingly. Finally, we propose a simple psychological mechanism that underpins our findings, based on the notion that explanations are assumed to compete to explain evidence in a zero-sum game.
Evidence Evaluation and the Likelihood Ratio
The likelihood ratio—the probability of an item of evidence given that the hypothesis is true divided by the probability of that same evidence given that the hypothesis is false—is used to determine the probative value of evidence in legal, forensic, medical, and other domains of reasoning under uncertainty (Fenton & Neil, 2012; Finkelstein, 2009). Evidence is considered probative if the likelihood ratio is greater than 1, that is, when the evidence is more likely if the hypothesis is true rather than false. Thus, if evidence is equally likely to occur whether the hypothesis is true or false, the likelihood ratio equals 1, and the evidence is considered nonprobative.
However, as in the Barry George case, the likelihood ratio can also be misapplied, with deleterious consequences. A likelihood ratio equal to 1 implies only that evidence is nonprobative if the hypotheses that make up the ratio are mutually exclusive and exhaustive (typically, a target hypothesis and its negation—Barry George fired the gun vs. Barry George did not fire the gun). Crucially, when the target hypothesis and an alternative hypothesis that is not the negation of the target are under consideration (e.g., whether Barry George fired the gun vs. whether the police mishandled the evidence), assumptions of mutual exclusivity and exhaustiveness are often not met (i.e., both or neither hypothesis may be true). As a consequence, even if the likelihood ratio is equal to 1, it is a mistake to infer that the evidence is not probative of the target hypothesis (see Fenton et al., 2014). This mistake can arise in any domain in which evidence has multiple independent explanations, the general case for which is illustrated by the common-effect Bayes net structure of Figure 1.
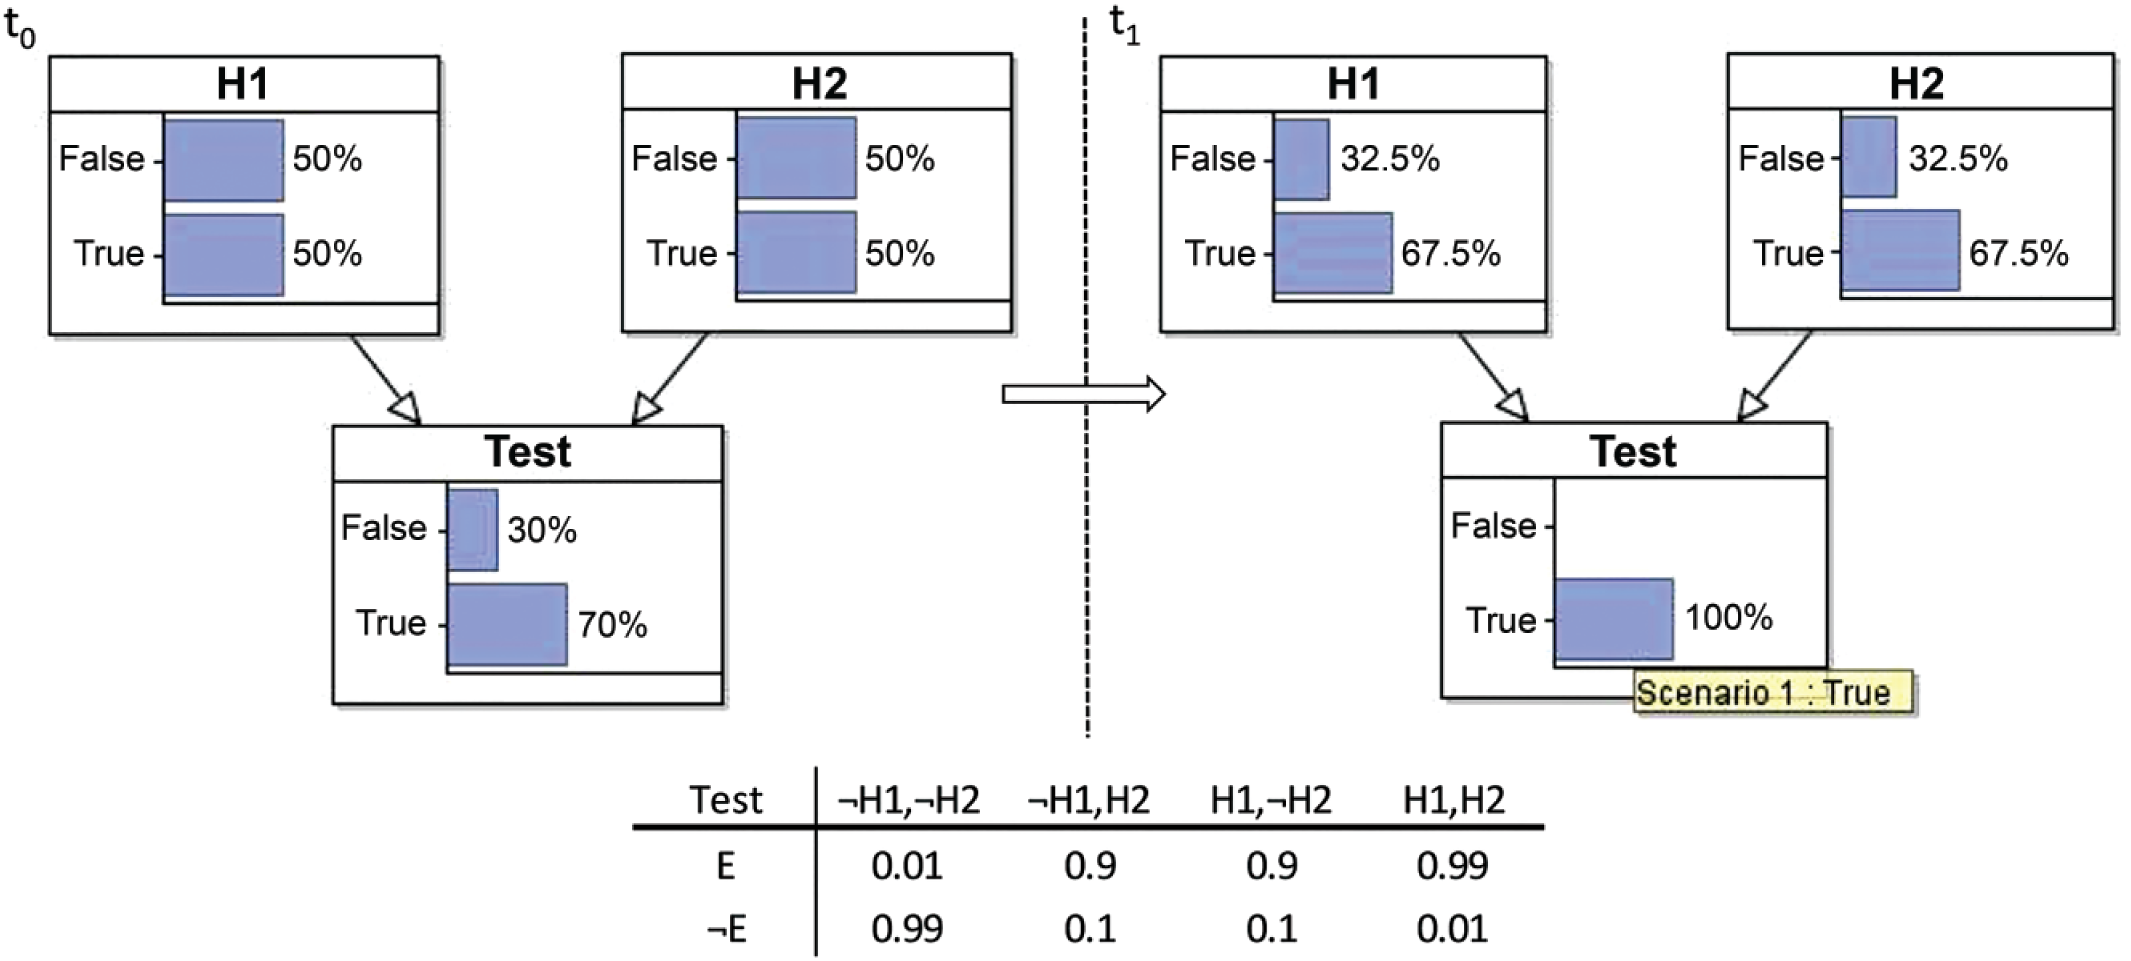
Common-effect scenario, with Hypothesis 1 (H1) and Hypothesis 2 (H2) representing the two claims, both candidate causes of positive (true) test results. Scenarios are shown separately for situations in which no evidence has been observed (t0) and evidence has been observed as true (t1). In the conditional probability table of test (at the bottom of the figure), P(E|H1, H2) results from assuming a noisy odds ratio (see Pearl, 1988). Priors of both claims are arbitrarily set to 0.5. E = evidence.
In this example, the evidence of a positive test was observed (t0, no evidence observed, to t1, positive evidence observed), increasing the probability of both hypotheses, despite the fact that the likelihood ratio of the evidence for Hypothesis 1 against Hypothesis 2 is equal to 1. Equivalent examples include multiple diseases and a medical test, multiple explanations of a person’s behavior (Nisbett & Ross, 1980), or multiple explanations for a crime. In all such cases, the danger is that people mistakenly judge crucial evidence to be nonprobative because they focus on whether the evidence discriminates between the target hypothesis and an alternative hypothesis (Hypothesis 1 vs. Hypothesis 2), rather than between the target hypothesis and its negation (Hypothesis 1 vs. not Hypothesis 1). It is the latter comparison that is critical for determining whether the evidence supports or undermines the target hypothesis (Hypothesis 1). 1
In our example, we used priors of 0.5 for each hypothesis, but this was an illustrative choice. In fact, the key pattern of inference—whereby evidence that has a likelihood ratio of 1 for Hypothesis 1 versus Hypothesis 2 is still probative for Hypothesis 1 versus not Hypothesis 1—holds irrespective of the priors of the hypotheses (as long as these are neither 0 nor 1), given plausible assumptions about the conditional probability table for the evidence E (see proofs in Section A of the Supplemental Material available online).
Zero-Sum Reasoning
We posit that this error is based on the misconception of evidential support as a finite, shared resource across the hypotheses under contention. This zero-sum conceptualization of support is appropriate only if hypotheses truly are both exclusive and exhaustive. But, in general, evidential support is not a zero-sum game, and reasoning from this assumption can lead to ignoring valuable evidence.
The notion of zero-sum effects has been explored in psychology, in which people inappropriately “cap” available resources—whether predictions of student grade quality (Meegan, 2010) or “fixed-pie” beliefs (Smithson & Shou, 2016)—with the resulting assumption that positivity in one domain corresponds to negativity in another (e.g., “When the rich get richer, the poor get poorer”). This effect relates to the notion of hydraulic action (attribution to one must be balanced by substitution from another), explored in work on social attribution (Kanouse, 1972; Lepper & Greene, 1978; Nisbett & Ross, 1980), in which people judge that more support for a behavior (e.g., an angry outburst) due to an intrinsic explanation (e.g., being an angry person) must correspond to less support for an extrinsic explanation (e.g., the situation). We propose a zero-sum reasoning fallacy, wherein the degree of support across multiple explanations is considered fixed, such that evidence that does not distinguish between these explanations is deemed irrelevant. Critically, this is based on a false assumption of exclusivity and exhaustiveness across explanations, when in fact the same evidence can offer support for both explanations.
Experiment 1
Experiment 1 demonstrates the zero-sum fallacy. We predicted that when presented with evidence that should increase support for both hypotheses, lay reasoners would erroneously judge it irrelevant. Conversely, when reasoners are presented with evidence that should decrease support for both hypotheses, we predicted that they would correctly use this evidence to disconfirm both hypotheses because correct responding (ruling out explanations) does not require hypotheses to be treated as nonexclusive.
Method
Participants
A total sample size of 50, with 25 participants per test-result condition (yielding 100 observations), was predetermined. Participants were recruited and participated online through Amazon’s Mechanical Turk. Those eligible for participation had at least a 95% approval rating from more than 100 prior tasks. Participants were English speakers and located in the United States. One participant was removed for incomplete responses. Of the 49 participants remaining, 26 were female. The mean age of the sample was 33.37 years (SD = 10.27). Participants were paid $1 for their time (Mdn = 5.87 min, SD = 5.54).
Materials and procedure
Participants completed basic demographics (age, gender, native language) before moving on to the scenarios. Each participant completed the four scenarios (see Section B of the Supplemental Material) in a random order. Each participant was assigned to one of two conditions: Either all scenarios contained positive test results or all contained negative test results. In all cases, there was both a target and an alternative explanation for the test result (in line with the structure of Fig. 1). For each scenario, participants were asked to make a judgment of “yes,” “no,” or “cannot tell” when posed with the following example format: “Does a [positive/negative] Griess test result give any support to the claim that Ann [has/has not] handled explosives?”
On a separate page, after each scenario judgment, participants were asked to “please briefly provide some reasoning for your decision regarding the previous scenario in the text box below” (not reported in this article). Along with demographics, scenario order and time taken were recorded.
Results
All analyses were Bayesian and performed using JASP statistical software (JASP Team, 2016). 2 Importantly, the use of Bayes factors (BFs) allowed us to infer evidence for the null hypothesis, wherein a BF10 of less than one third is considered strong support for the null (Dienes, 2014).
Each of the 49 participants made four judgments. Figure 2 shows the mean proportion of these judgments, split by test-result condition. To analyze the data, we coded judgments for each participant as either correct (1; “yes”) or incorrect (0; “no” or “cannot tell”). These responses were then summed across the four scenarios, resulting in a single summary variable (sum correct) for each participant, bound between 0 and 4. Consequently, we used a Bayesian independent-samples t test and found that participants in the positive-test-result condition (M = 1.58, SD = 1.38, n = 24) made significantly fewer correct responses than participants in the negative-test-result condition (M = 3.44, SD = 0.79, n = 25), BF10 = 26,463.93, Cohen’s d = 1.563, 95% credibility interval (CI) = [0.903, 2.225]. Finally, correct responding was compared with chance level (test value = 1.33). Whereas correct responding was significantly greater than chance for participants in the negative-test-result condition, BF10 = 1.03 × 10¹⁰, Cohen’s d = 2.656, 95% CI = [2.003, 3.407], participants in the positive-test-result condition showed strong evidence for the null (i.e., were at chance level), BF10 = 0.31, Cohen’s d = 0.162, 95% CI = [−0.208, 0.540]. Lastly, Bayesian contingency tables revealed that neither scenario order, BF10 = 3.56 × 10⁻⁴, nor type, BF10 = 0.002, influenced judgments, with decisive evidence for the null in both instances.
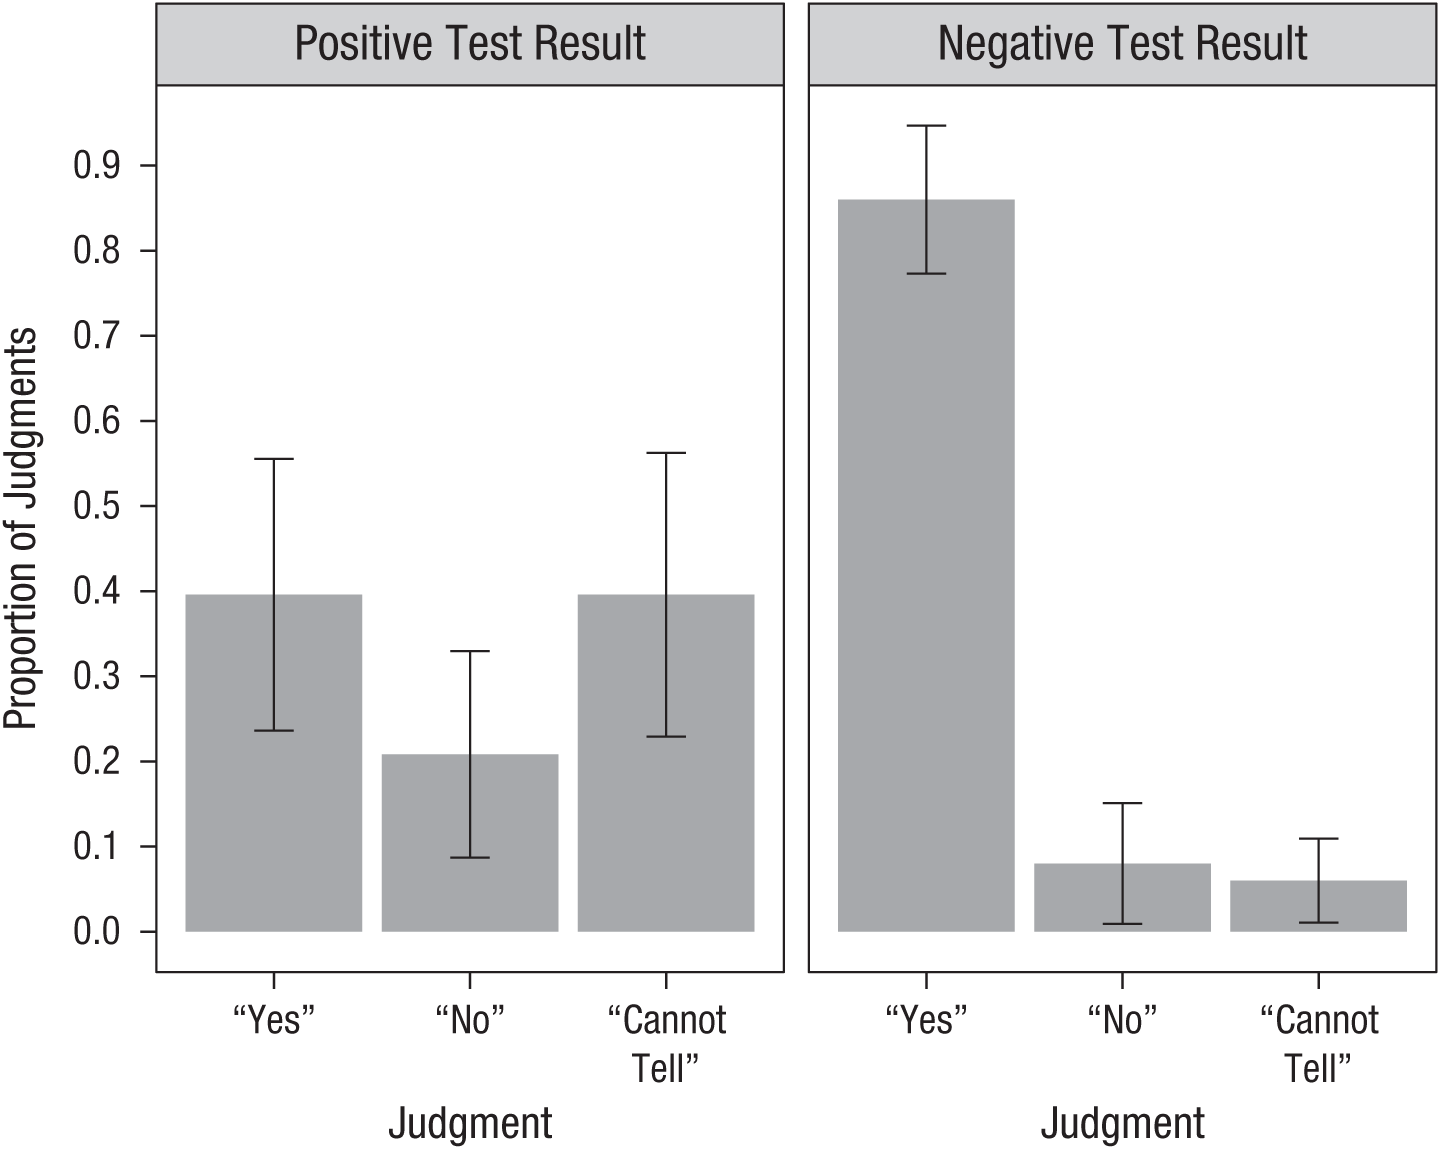
Results from Experiment 1: mean proportion of each judgment type, split by test-result condition. Error bars reflect 95% confidence intervals.
Discussion
Positive evidence was judged as irrelevant significantly more than negative evidence. This fit with our predictions, given that the negative test did not require the introduction of new resources (the “sum” part of zero sum) but instead reduced support (i.e., the negative test disconfirmed both hypotheses). These results were not influenced by scenario order (i.e., no effects of learning or attentional attrition) or type (indicating context generalizability).
Experiment 2
Experiment 2 examined two key questions. First, was the error due to a failure to consider that the hypotheses were nonexhaustive? Second, were “cannot tell” responses (which we considered erroneous) due to low confidence rather than a genuine misinterpretation of the value of the positive test result?
Method
Participants
Participants were recruited using the same protocol as in Experiment 1. A sample size of 200 was predetermined on the basis of a conservative estimate for a possible interaction between test result and exhaustiveness intervention (see Materials and Procedure). Of the 200 participants recruited (50 per group), 3 were removed whose native language was not English, and 4 were removed for incomplete responses. Of the 193 participants remaining, 88 were female. The mean age of the sample was 36.27 years (SD = 10.93). Participants were paid $1 for their time (Mdn = 7.37 min, SD = 5.54).
Materials and procedure
The materials used were identical to those of Experiment 1, with the same general procedure, but to address the questions of Experiment 2, we made the following changes. To address the exhaustiveness issue, we introduced a between-subjects factor, in which an explicit statement regarding nonexhaustiveness was either present (nonexhaustiveness statement) or absent (control). This, in conjunction with the test-result between-subjects manipulation, led to a 2 × 2 design. The nonexhaustiveness statement preceded the standard judgment question and used the following structure: “Please note, it is possible that [subject] neither [Hypothesis 1] nor [Hypothesis 2].”
To address the confidence question, we included a confidence measure directly below the judgment question: “How confident are you that your response is correct?” Participants responded using a slider to indicate from 0% to 100% (no default value; for an example scenario, see Section C of the Supplemental Material). Accordingly, as participants completed each of the four scenarios in random order, they made a judgment, expressed their confidence in that judgment, and then provided some reasoning.
Results
Judgment data
Each of the 193 participants made 4 judgments, resulting in a total of 772 judgments. Figure 3 shows the mean proportion of these judgments, split by test-result condition and exhaustiveness manipulation. As in Experiment 1, participant judgments were coded into a single, summary correct-responding variable. We conducted a Bayesian analysis of variance (ANOVA) with test result and exhaustiveness manipulation (both between subjects). Correct responding was significantly higher in the negative- than the positive-test-result condition, BFinclusion = 607.57, and the nonexhaustiveness statement also led to higher correct responding than in the control condition, BFinclusion = 9.02, as can be seen in Table 1. 3 The model with these two main factors was considered the best fit, BFM = 6.86, and significant overall, BF10 = 5,031.76, as the interaction was not significant. 4 When we broke down the main effect of the exhaustiveness manipulation by test result, the increase in correct responding was found in the negative-test-result condition (n = 95), BF10 = 29.37, Cohen’s d = −0.64, 95% CI = [−1.046, −0.247], but not in the positive-test-result condition (n = 98), BF10 = 0.36, Cohen’s d = −0.192, 95% CI = [−0.57, 0.177].
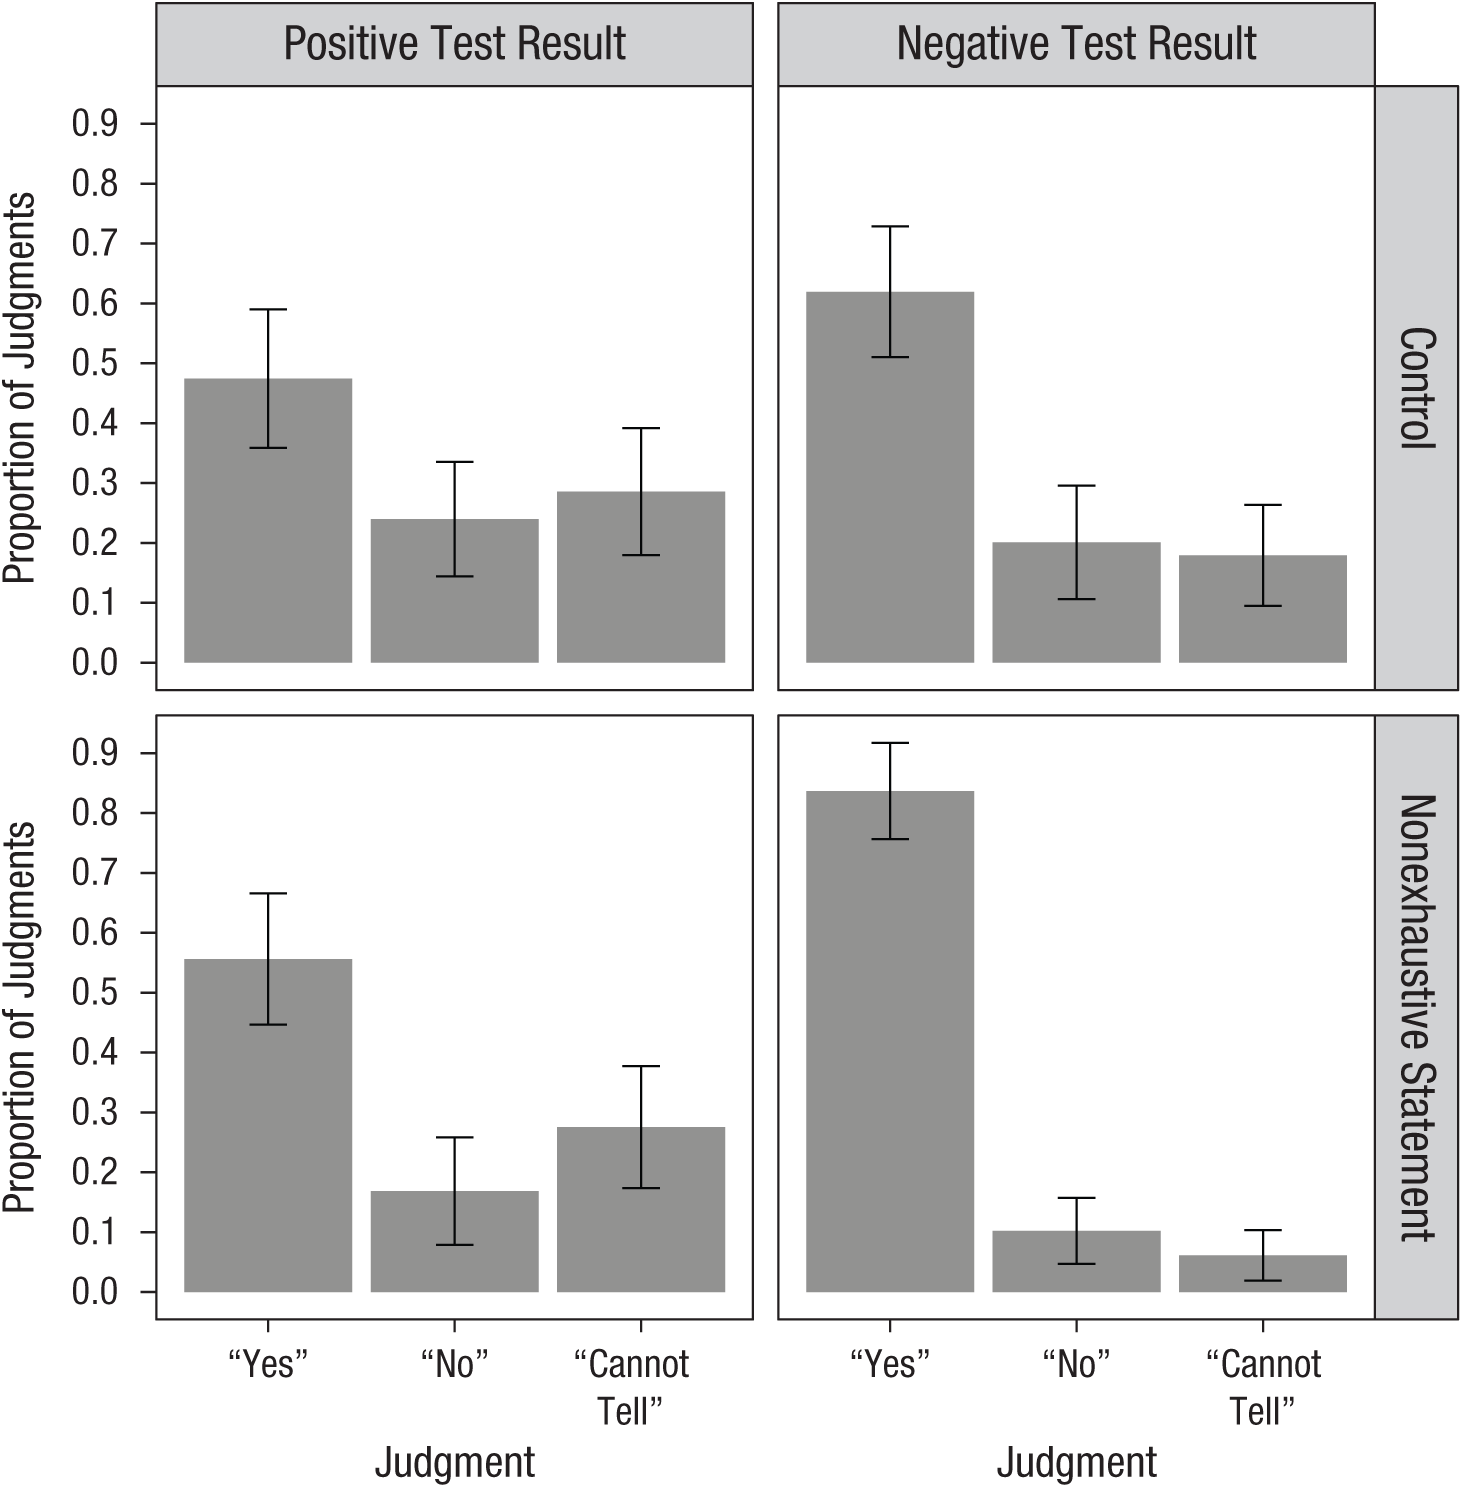
Results from Experiment 2: mean proportion of each judgment type, split by test-result condition (columns) and exhaustiveness manipulation (rows). Error bars reflect 95% confidence intervals.
Experiment 2: Descriptive Statistics for Correct Responding and Results of the Analysis of Chance Responding

Note: BF = Bayes factor; CI = credibility interval.
Whether correct responding significantly differed from chance (1.33) was assessed using a Bayesian one-sample t test.
As can be seen in Table 1, all correct-responding rates were significantly greater than chance level, with the single exception of the participants with positive test results who did not receive the nonexhaustiveness statement. Lastly, using Bayesian contingency tables, we found that the potential confounds of scenario order and type did not impact judgments, with strong support for the null hypothesis in both the former, BF10 = 8.93 × 10⁻⁶, and the latter, BF10 = 0.02.
Confidence data
Figure 4 shows the breakdown of confidence by judgment type, test-result condition, and exhaustiveness-manipulation condition. A 3 (judgment) × 2 (test-result condition) × 2 (exhaustiveness-manipulation condition) Bayesian ANOVA was run on the three variables of interest. Hierarchical model comparisons revealed a significant main effect of judgment on confidence, BFinclusion = 1.18 × 10⁸, with “cannot-tell” responses as least confident and “yes” responses as most confident. The positive-test-result condition also led to higher confidence, BFinclusion = 1,434.77, whereas the exhaustiveness manipulation significantly decreased confidence, BFinclusion = 8.41. Lastly, the analysis yielded a significant interaction between test-result condition and judgments, BFinclusion = 7,510.11, with the model including this interaction term yielding the most significant model improvement, BFM = 18.09, and decisive evidence overall, BF10 = 3.63 × 10⁸. To explore this interaction further, we performed two additional ANOVAs on both positive- and negative-test-result conditions in isolation. This revealed that the confidence of participants in the positive-test-result condition was not significantly affected by judgment type (see Fig. 4; n = 98), BF10 = 0.81, whereas those in the negative-test-result condition were decisively less confident in “cannot-tell” and “no” judgments than “yes” judgments (see Fig. 4; n = 95), BF10 = 5.55 × 10²³.
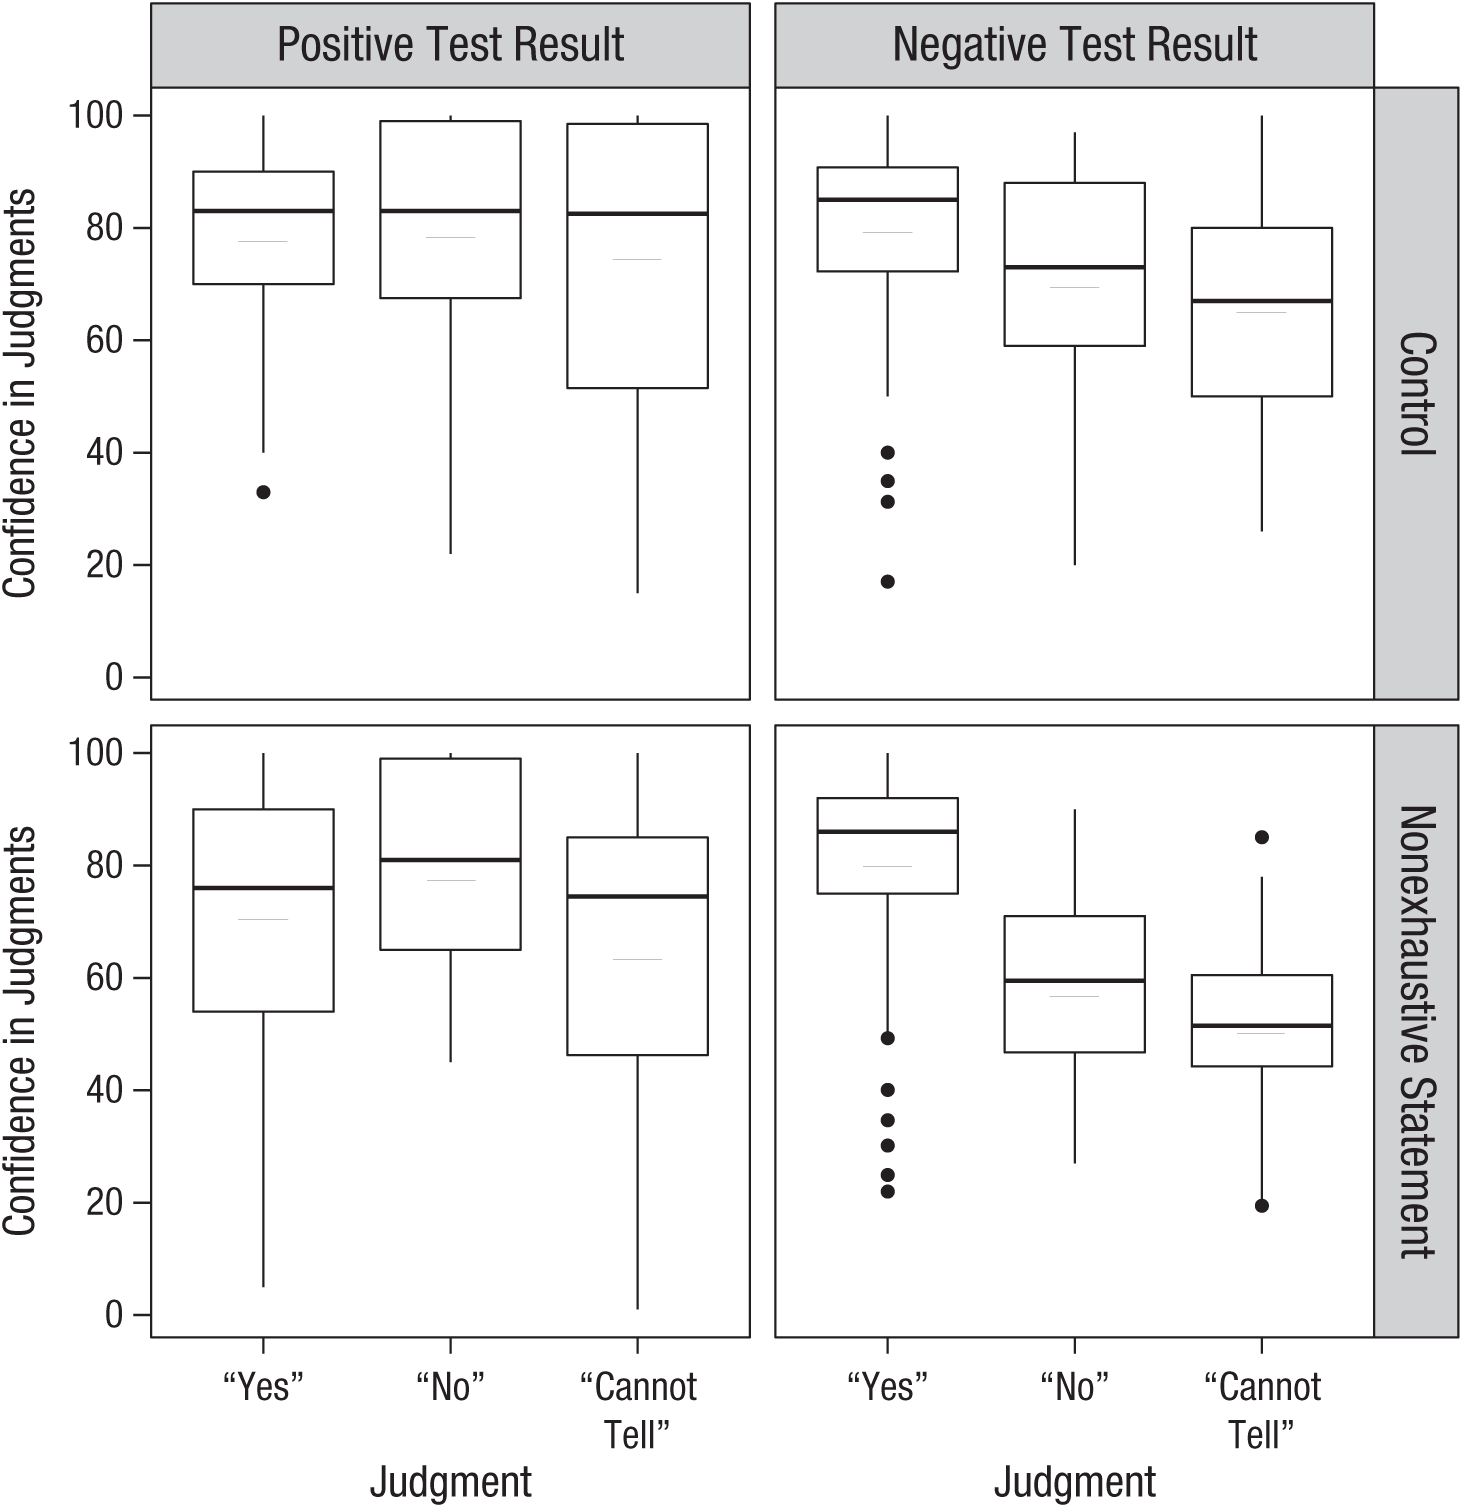
Results from Experiment 2: box-and-whiskers plots showing confidence in each judgment type, split by test-result condition (columns) and exhaustiveness manipulation (rows). Long horizontal lines indicate means, and short horizontal lines indicate medians. The bottom and top edges of each box indicate the 25th and 75th percentiles, respectively. Whiskers extend 1.5 times the interquartile range from the 25th and 75th percentiles. Outliers are represented by black circles.
Discussion
Experiment 2 replicated Experiment 1, as positive evidence was once again judged as irrelevant significantly more than negative evidence. Although the nonexhaustiveness statement was effective in improving judgments, it primarily applied to negative evidence (although correct responding for positive evidence was above chance level, suggestive of a weak effect). Crucially, confidence estimates revealed that erroneous judgments for positive evidence were made as confidently as correct responses (providing evidence against a “low-confidence-bin” explanation). Finally, judgments again were unaffected by either scenario order or scenario type.
Experiment 3
Experiment 3 explored the impact of exclusivity by manipulating whether participants were explicitly told that the hypotheses were mutually exclusive. Further, it examined whether the zero-sum fallacy still holds when the “leak” value of the test (i.e., the probability of a false positive when neither hypothesis is true) is given. This allowed us to rule out the possibility that “no” or “cannot-tell” judgments in the positive-test-results condition were due to an assumption that the test was generally undiagnostic. More precisely, reasoners may have assumed that as multiple hypotheses can entail a positive result, the test generally yielded positive results (irrespective of hypotheses), making the test worthless. This would be represented by an inflated leak value (e.g., 90%); therefore, specifying a low leak value (e.g., 1%) rules out this explanation.
Method
Participants
Participants were recruited using the same protocol as in Experiment 1. A sample size of 207 was predetermined on the rationale used in Experiment 2, taking into account previous rates of ineligible participants and incomplete data submissions. Accordingly, of the 207 participants recruited, 2 were removed whose native language was not English, 3 were living outside the United States, and 1 submitted incomplete data. Of the 201 participants remaining, 112 were female. The mean age of the sample was 37.51 years (SD = 12.31). Participants were paid $1 for their time (Mdn = 7.56 min, SD = 6.57).
Materials and procedure
The materials and general procedure generally followed that of Experiment 2, barring the following exceptions. Across all conditions, a statement was included to indicate the probability of a false positive (i.e., a test coming back positive when neither hypothesis was true). This took the following general form: “If neither [Hypothesis 1] nor [Hypothesis 2] is true, there is only a [X%] chance of the test being positive.” The specific wording and value of the false positive was tailored to each scenario (although the latter was fixed between 0.5% and 3%, details of which can be found in Section C of the Supplemental Material).
Along with the between-subjects factor of test-result condition (positive or negative; common to Experiments 1 and 2), an additional, two-level between-subjects exclusivity manipulation was added (present or absent, making a 2 × 2 between-subjects design). This manipulation consisted of either the presence or absence of an explicit exclusivity constraint across all scenarios. This constraint took the following general form: “Importantly, [constraint] means it is not possible for both to be true (i.e., [subject] can’t have/be [Hypothesis 1] and [Hypothesis 2]).”
The specific wording of these exclusivity-constraint manipulations for each scenario is also provided in Section D of the Supplemental Material. The following example was taken from the brain tumor scenario: “Importantly, Gary’s other symptoms mean it is not possible for both to be true (i.e., Gary can’t have a tumor and early onset dementia).” Accordingly, as participants completed the four scenarios in random order, they made a judgment, expressed their confidence in that judgment, and then provided some reasoning.
Results
Judgment data
Each of the 201 participants made 4 judgments, resulting in a total of 804 judgments. Figure 5 shows the mean proportion of these judgments, split by test-result condition and exclusivity manipulation. Following the analysis protocol of the preceding experiments, we again coded participant judgments into a single, summary correct-responding variable, which was used as the dependent variable in subsequent Bayesian ANOVAs. Hierarchical model comparison found that whereas correct responding was significantly higher in the negative- than the positive-test-result condition, BFinclusion = 5.74 × 10⁶, there was strong evidence for a null effect of exclusivity manipulation, BFinclusion = 0.281. Consequently, the model with only a main effect of test result was both the best fit, BFM = 9.487, and significant overall, BF10 = 4.045 × 10⁶. As in Experiment 2, the main effect of the exclusivity manipulation was broken down by test result. In line with the overall analysis, there was no effect of the exclusivity manipulation in either the positive-test-result condition (n = 98), BF10 = 0.391, Cohen’s d = 0.203, 95% CI = [−0.16, 0.592], or negative-test-result condition (n = 103), BF10 = 0.222, Cohen’s d = 0.067, 95% CI = [−0.305, 0.426].

Results from Experiment 3: mean proportion of each judgment type, split by test-result condition (columns) and exclusivity manipulation (rows). Error bars reflect 95% confidence intervals.
In line with previous experiments, correct responding in the negative-test-result condition was significantly greater than chance (see Table 2), which occurred irrespective of exclusivity manipulation. Interestingly, in the positive-test-result condition, when an exclusivity constraint was made explicit, correct responding was significantly greater than chance level, which was not the case in the control condition. Lastly, as in Experiments 1 and 2, using Bayesian contingency tables, we found that judgments were shown to be unaffected by scenario order (N = 804), BF10 = 7.465 × 10⁻⁵, and scenario type (N = 804), BF10 = 2.177 × 10⁻⁴, with very strong evidence for the null in both cases.
Experiment 3: Descriptive Statistics for Correct Responding and Results of the Analysis of Chance Responding
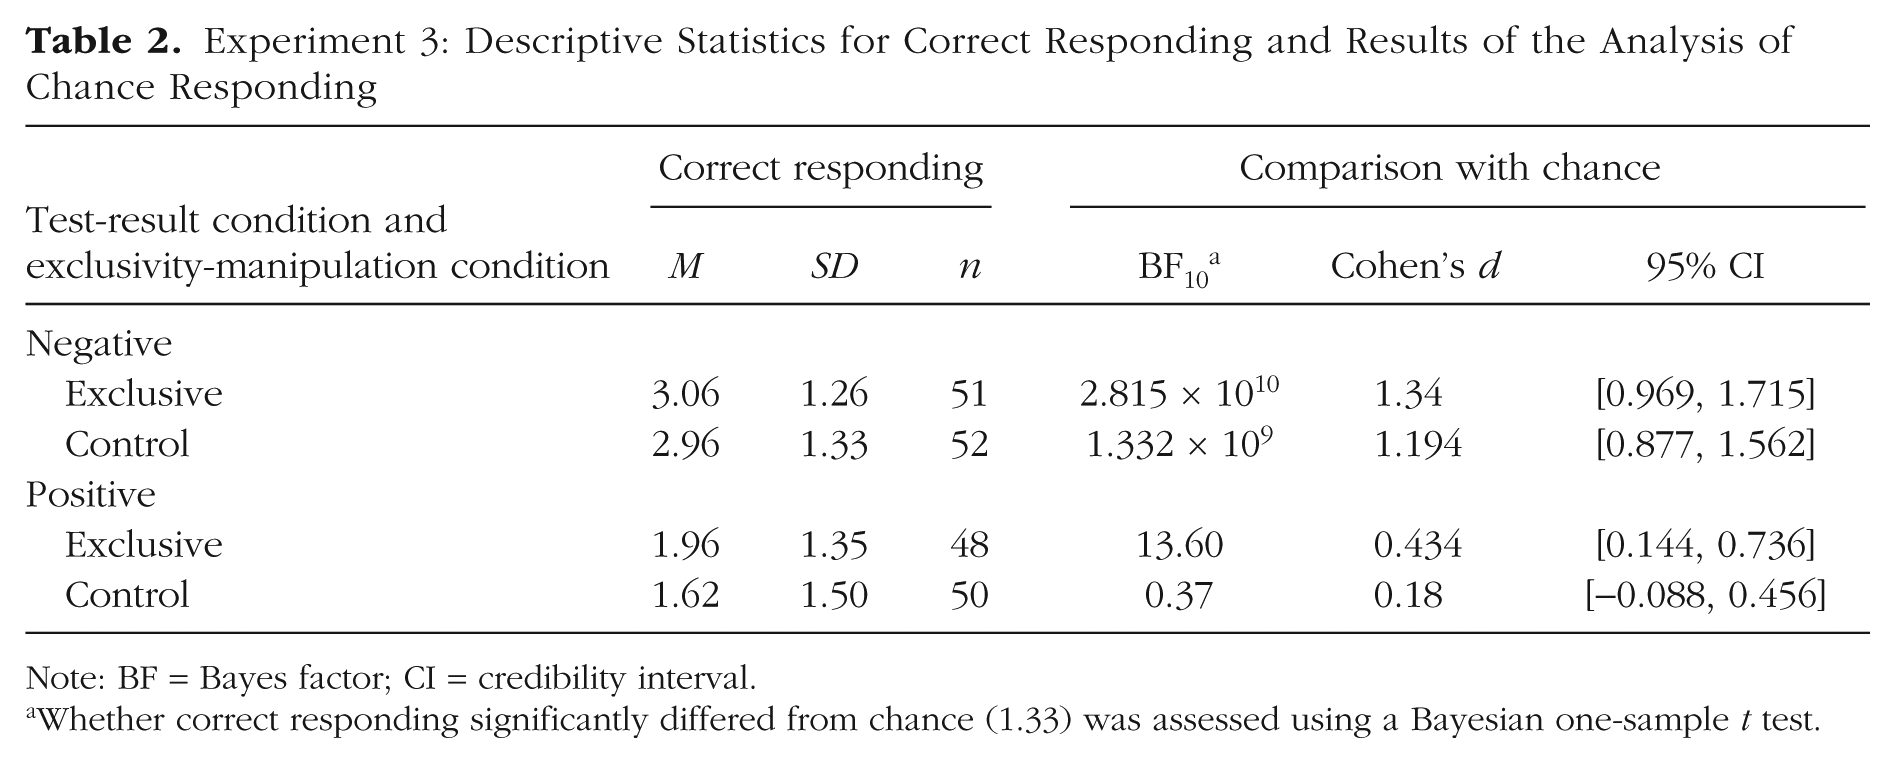
Note: BF = Bayes factor; CI = credibility interval.
Whether correct responding significantly differed from chance (1.33) was assessed using a Bayesian one-sample t test.
Confidence data
Figure 6 shows the breakdown of confidence by judgment type, test-result condition, and exclusivity manipulation. A 3 (judgment) × 2 (test-result condition) × 2 (exhaustiveness-manipulation condition) Bayesian ANOVA was run on the three variables of interest. Hierarchical model comparisons revealed a significant main effect of judgment on confidence, BFinclusion = 2.07 × 10⁸, with “cannot-tell” responses as least confident and “yes” responses as most confident. There was also a main effect of test-result condition, BFinclusion = 132,260.63, with judgments in the negative-test-result condition higher than in the positive-test-result condition but strong evidence for a null effect of exclusivity manipulation, BFinclusion = 0.175. Lastly, the analysis yielded a significant interaction between test-result condition and judgments, BFinclusion = 132,899.66, with the model including these significant terms yielding the most significant model improvement, BFM = 36.78, and decisive evidence overall, BF10 = 1.562 × 10¹². To explore this interaction further, we performed a second round of ANOVAs on both the positive- and negative-test-result conditions in isolation. This revealed that confidence was not significantly affected by judgment in the positive-test-result condition (see Fig. 6; n = 392), BF10 = 0.079, whereas participants in the negative-test-result condition were decisively less confident in “cannot-tell” and “no” judgments than “yes” judgments (see Fig. 6; n = 412), BF10 = 5.266 × 10¹¹.
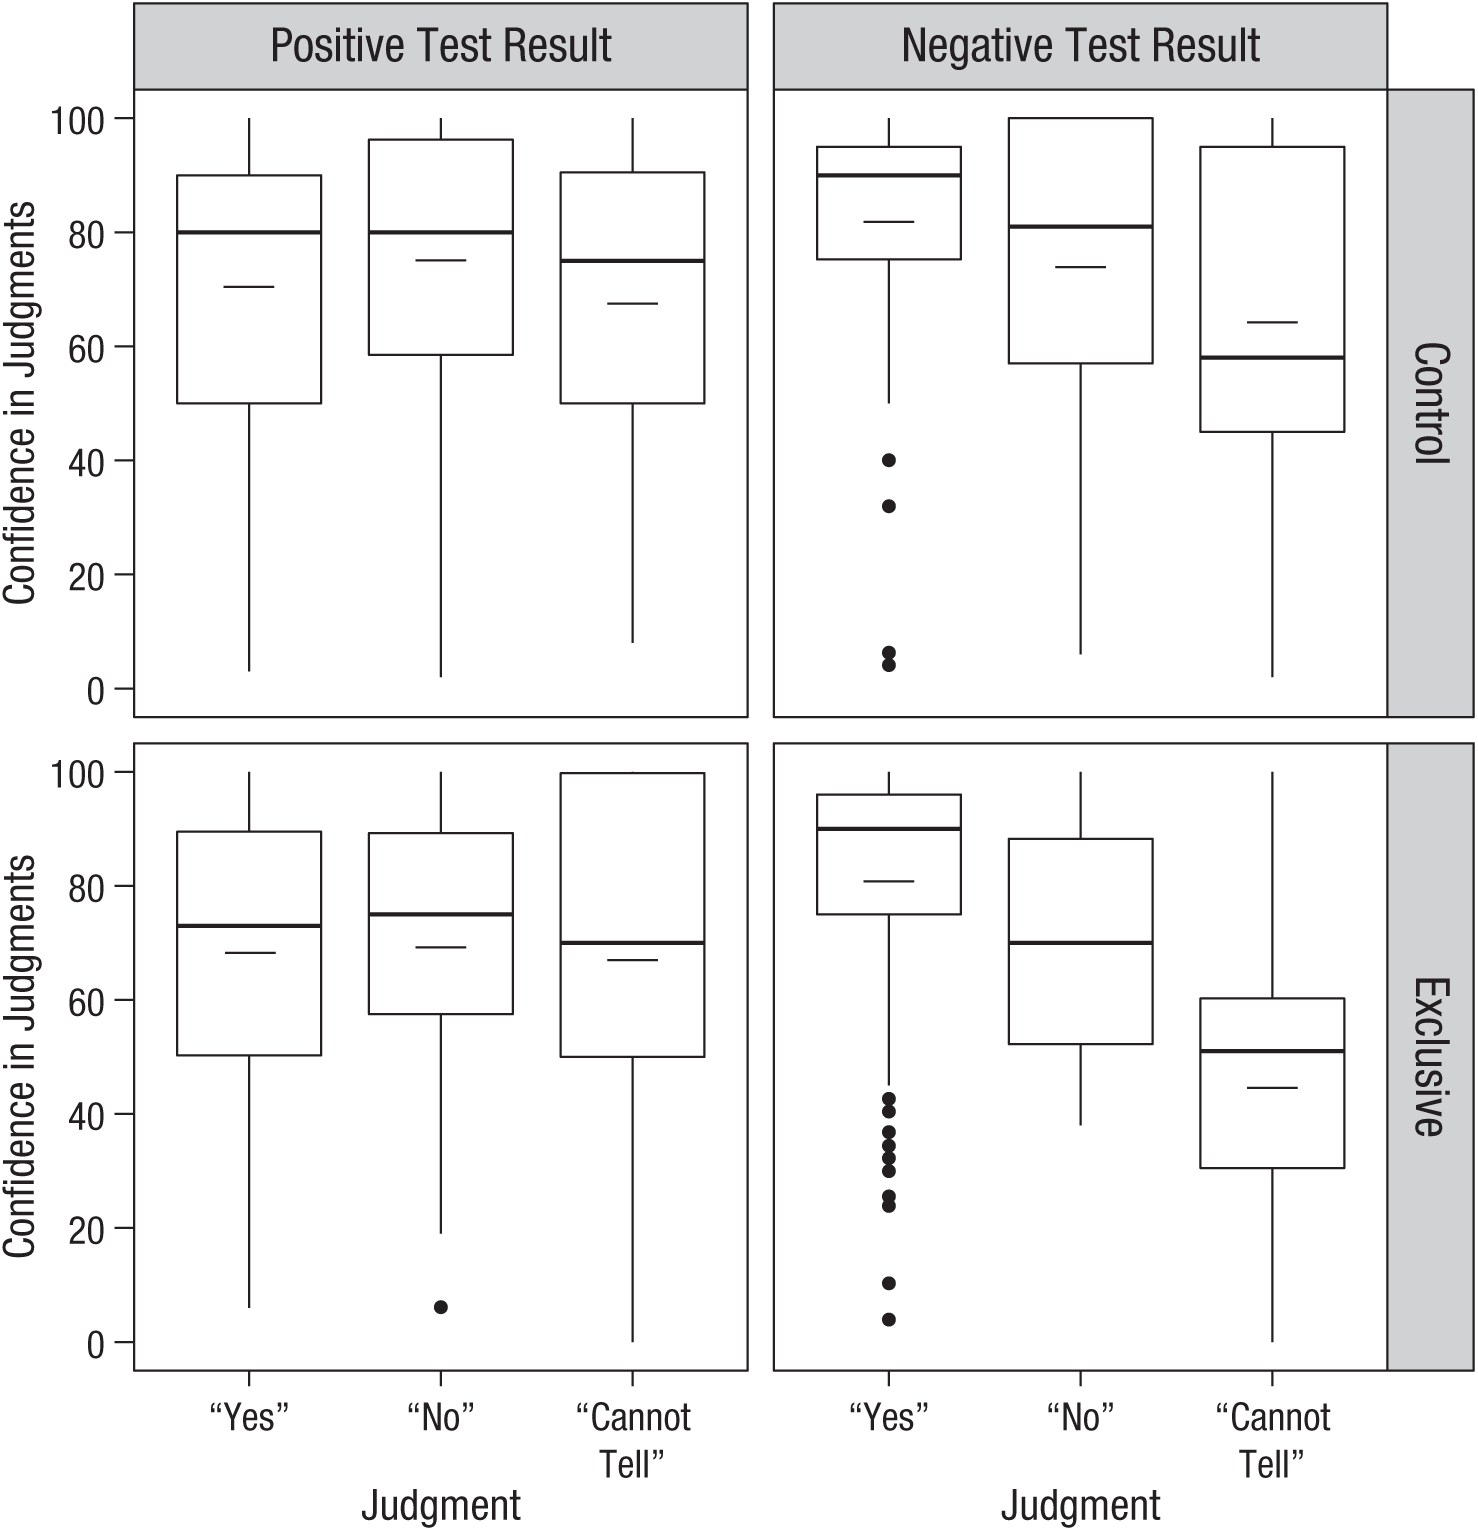
Results from Experiment 3: box-and-whiskers plots showing confidence in each judgment type, split by test-result condition (columns) and exclusivity-manipulation condition (rows). Long horizontal lines indicate means, and short horizontal lines indicate medians. The bottom and top edges of each box indicate the 25th and 75th percentiles, respectively. Whiskers extend 1.5 times the interquartile range from the 25th and 75th percentiles. Outliers are represented by black circles.
Discussion
Experiment 3 demonstrates that the distinctive zero-sum pattern of reasoning holds even when leak values for tests are included and when exclusivity constraints are made explicit. These errors were given with equally high confidence as correct responses, replicating the results of Experiment 2 and corroborating a misplaced faith in such errors.
General Discussion
Three experiments presented evidence for the zero-sum fallacy. Experiment 1 showed the fallacy in positive test cases, comparing it directly with negative test cases, where no such error is made. Experiment 2 explicitly stated that the candidate hypotheses were nonexhaustive, an intervention that reduced errors in negative test cases (although we note some weak evidence for improved correct-responding in positive test cases). Experiment 3 showed no significant impact on the pattern of reasoning when hypotheses were stated to be exclusive and also that erroneous reasoning was not due to participants believing that the tests were generally nondiagnostic.
Further experiments have also shown that the fallacy holds even when likelihoods differ. 5 In addition, the inclusion of confidence measures showed that both erroneous and correct judgments were held with high confidence. We conjecture that this bias arises because people treat evidence as a zero-sum game, whereby alternative hypotheses compete for evidential support. Thus, evidence that favors one hypothesis must thereby disfavor alternative hypotheses. This assumption prohibits people from seeing that the same piece of evidence can simultaneously confirm alternative hypotheses. More precisely, lay reasoners assume that evidence that is equally predicted by two competing hypotheses offers no support for either hypothesis. However, this assumption holds only when the competing hypotheses are mutually exclusive and exhaustive. In the contexts presented in these experiments, and in many real-world contexts such as law and medicine, these conditions do not hold, and yet people persist in disregarding evidence that is genuinely probative of the key hypothesis of interest.
Reasoning under zero-sum assumptions seems to be a compelling heuristic that will often simplify inference and promote clear-cut decision making. But when conditions of exclusivity or exhaustiveness fail, as in many real-world situations, reasoners will overlook crucial evidence.
Supplemental Material
Pilditch_OpenPracticesDisclosure_rev – Supplemental material for The Zero-Sum Fallacy in Evidence Evaluation
Supplemental material, Pilditch_OpenPracticesDisclosure_rev for The Zero-Sum Fallacy in Evidence Evaluation by Toby D. Pilditch, Norman Fenton and David Lagnado in Psychological Science
Supplemental Material
Pilditch_Supplemental_Sections_A_and_E – Supplemental material for The Zero-Sum Fallacy in Evidence Evaluation
Supplemental material, Pilditch_Supplemental_Sections_A_and_E for The Zero-Sum Fallacy in Evidence Evaluation by Toby D. Pilditch, Norman Fenton and David Lagnado in Psychological Science
Supplemental Material
Pilditch_Supplemental_Sections_B,_C,_D,_and_F – Supplemental material for The Zero-Sum Fallacy in Evidence Evaluation
Supplemental material, Pilditch_Supplemental_Sections_B,_C,_D,_and_F for The Zero-Sum Fallacy in Evidence Evaluation by Toby D. Pilditch, Norman Fenton and David Lagnado in Psychological Science
Footnotes
Acknowledgements
The views and conclusions contained in this article are those of the authors and should not be interpreted as necessarily representing the official policies, either expressed or implied, of the Office of the Director of National Intelligence, Intelligence Advanced Research Projects Activity, or the U.S. government. The U.S. government is authorized to reproduce and distribute reprints for governmental purposes notwithstanding any copyright annotation herein.
Action Editor
Timothy J. Pleskac served as action editor for this article.
Author Contributions
All the authors developed the study concept and contributed to the study design. Testing and data collection were performed by T. D. Pilditch. T. D. Pilditch analyzed and interpreted the data under the supervision of D. Lagnado. T. D. Pilditch drafted the manuscript, and D. Lagnado and N. Fenton provided critical revisions. N. Fenton provided the mathematical proofs in the Supplemental Material available online. All the authors approved the final manuscript for submission.
Declaration of Conflicting Interests
The author(s) declared that there were no conflicts of interest with respect to the authorship or the publication of this article.
Funding
This research is based on work supported in part by the Office of the Director of National Intelligence, Intelligence Advanced Research Projects Activity, under Contract 2017-16122000003.
Open Practices
All data and materials have been made publicly available via the Open Science Framework and can be accessed at osf.io/wnu9f. The design and analysis plans for the experiments were not preregistered. The complete Open Practices Disclosure for this article can be found at http://journals.sagepub.com/doi/suppl/10.1177/0956797618818484. This article has received the badges for Open Data and Open Materials. More information about the Open Practices badges can be found at  .
.
Notes
References
Supplementary Material
Please find the following supplemental material available below.
For Open Access articles published under a Creative Commons License, all supplemental material carries the same license as the article it is associated with.
For non-Open Access articles published, all supplemental material carries a non-exclusive license, and permission requests for re-use of supplemental material or any part of supplemental material shall be sent directly to the copyright owner as specified in the copyright notice associated with the article.
