
Abstract
Researchers have suggested that acute exposure to violent video games is a cause of aggressive behavior. We tested this hypothesis by using violent and nonviolent games that were closely matched, collecting a large sample, and using a single outcome. We randomly assigned 275 male undergraduates to play a first-person-shooter game modified to be either violent or less violent and hard or easy. After completing the game-play session, participants were provoked by a confederate and given an opportunity to behave aggressively. Neither game violence nor game difficulty predicted aggressive behavior. Incidentally, we found that 2D:4D digit ratio, thought to index prenatal testosterone exposure, did not predict aggressive behavior. Results do not support acute violent-game exposure and low 2D:4D ratio as causes of aggressive behavior.
Violence is common in video games, and many people are concerned about the effects of such games on the individuals who play them. Psychological researchers have reported that violent games may increase aggressive behavior, and academic societies have made public statements on the harmful effects of violent media (American Psychological Association Task Force on Violent Media, 2005). However, this research has been criticized on the grounds that violent and nonviolent games used in experiments may feature other confounding differences (Adachi & Willoughby, 2011) and that the published literature overrepresents statistically significant results (Hilgard, Engelhardt, & Rouder, 2017).
In this study, we addressed these challenges. To address potential confounds, we controlled our stimuli by customizing video games. In one version of our game, participants had to kill invading aliens; in the other version, participants had to rescue lost and confused aliens. Saving an alien required the participant to transport it back home by aiming a remote controller at it, reproducing first-person-shooter game play but without the violent intent. The game play in both games was exactly the same; the games differed only in graphics, sounds, and cover story. Our secondary goal was to test whether the ratio of the lengths of the index and ring fingers (2D:4D ratio), believed to measure prenatal testosterone exposure, predicts aggressive behavior as theorized.
Violent Video Games
Evidence for causal effects of violent video games comes from laboratory experiments. In such experiments, researchers randomly assign participants to play a violent video game (e.g., Doom) or a nonviolent video game (e.g., Myst; Anderson & Dill, 2000). Following game play, researchers measure aggressive thoughts, feelings, or behavior. Meta-analyses of dozens of these experiments reveal greater levels of aggression following violent, as compared with nonviolent, video-game play (Anderson et al., 2010; Greitemeyer & Mügge, 2014).
This evidence is controversial for two reasons. First, it is often unclear whether observed effects are caused by video games’ violent content specifically. An alternative explanation is that these effects may reflect confounded characteristics of violent video games such as competition or frustration rather than violent content per se (Adachi & Willoughby, 2011; Przybylski, Deci, Rigby, & Ryan, 2014). Second, evidence for violent-video-game effects may be overstated through publication bias (Ferguson & Kilburn, 2010; Hilgard et al., 2017).
Violent video games are hypothesized to cause increases in aggression through a number of causal pathways. These include activation of aggressive thoughts, learning of aggressive scripts, increased processing of ambiguous cues as hostile, desensitization to suffering through repeated exposure to violence, excitation transfer, and hostile affect (Bushman & Anderson, 2002). Reported effect sizes are consistent with typical effect sizes in social psychology (r = .21, Anderson et al., 2010; r = .19, Greitemeyer & Mügge, 2014) and are considered practically meaningful on the basis of their implications for public health.
Difficult Video Games
Some critics have suggested that differences in violent content between games are confounded with differences in competitiveness or frustration. The authors of one small-sample study suggested that differences in aggression may be attributable to competitive, rather than violent, content (Adachi & Willoughby, 2011; but see Anderson & Carnagey, 2009). Another series of studies showed that frustration with controls, but not game violence, may cause aggressive behavior (Przybylski et al., 2014). These confounds, rather than the violent content, may cause increases in aggression.
Manipulating Game Content With Better Controls
Commercially available violent and nonviolent games often belong to very different genres with very different rules of play. Violent games are often shooter or fighting games, whereas nonviolent games are often racing, puzzle, or sports games. Therefore, whereas such games differ in their violent content, they are also different in their game play, creating a possible confound.
Researchers have attempted to account for these potential differences in several ways. One approach is to collect a pilot sample and show that there is no significant confound between games; this approach is flawed in that small samples do not provide strong evidence of equivalence (Hilgard, Engelhardt, Bartholow, & Rouder, 2017). Another approach is to adjust for potential confounds as covariates. This approach may underadjust if the confounds are measured with error or overadjust if the so-called confounds are themselves consequences of violent game play.
We took a more direct approach by modifying the content of a single video game. A game can be modified so that the same level is played either with or without violent content, but all other game parameters are held constant (as suggested by Elson & Quandt, 2016, and demonstrated in Carnagey & Anderson, 2005; Elson, Breuer, Van Looy, Kneer, & Quandt, 2015; Przybylski et al., 2014). This approach allowed manipulation of specific game features in much the same way that a researcher would manipulate features of a laboratory paradigm between conditions, permitting clearer inferences concerning the effects of the manipulated game feature.
2D:4D Ratio
Individual biological differences may also cause aggression. The male sex hormone testosterone is theorized to cause aggression (for a review, see Carré, McCormick, & Hariri, 2011), and it is hypothesized that development of aggressive tendencies may be caused, in part, by prenatal testosterone exposure (see, e.g., Cohen-Bendahan, Buitelaar, van Goozen, Orlebeke, & Cohen-Kettenis, 2005). One supposed index of this prenatal exposure is the ratio of the lengths of the index and ring fingers (2D:4D ratio). This ratio is thought to be related to both prenatal testosterone exposure and aggressive behavior (see Lutchmaya, Baron-Cohen, Raggatt, Knickmeyer, & Manning, 2004; Manning, Scutt, Wilson, & Lewis-Jones, 1998). There is cause for skepticism, however; a meta-analysis indicated that gene polymorphisms that reduce androgen sensitivity did not predict higher 2D:4D ratios as theorized (Voracek, 2014).
Because the overall correlation between 2D:4D ratio and aggression is small (r = −.06 among men and no effect among women; Hönekopp & Watson, 2011), proponents of the 2D:4D-ratio hypothesis of aggression have suggested that the effects of 2D:4D ratio may be moderated by context, demonstrating greater prediction of aggressive behavior in aggressive situations (Millet, 2011). For example, one experiment found that 2D:4D ratio predicted aggression following an aggressive (but not a nonaggressive) music video (Millet & Dewitte, 2007). Our experiment featured a provocation, aggressive primes, and an opportunity to behave aggressively, allowing us to test the relationship between 2D:4D ratio and aggression.
Superadditive Causes of Aggressive Behavior
Several models of aggressive behavior suggest that multiple coincident causes of aggression should produce superadditive interactions (e.g., I3 theory by Slotter & Finkel, 2011; the general-aggression model by Anderson & Dill, 2000). For example, one might expect that effects of violent primes are greatest on individuals already temperamentally disposed toward aggression. In this study, we tested for interactions among violent content, difficulty of content, and 2D:4D ratio in predicting aggressive behavior.
Hypotheses
This study examined the effects of game violence, game difficulty, and 2D:4D ratio on aggressive behavior among college-age men. We made four hypotheses: (Hypothesis 1) Violent video-game content will increase aggressive behavior, (Hypothesis 2) video-game difficulty will increase aggressive behavior, (Hypothesis 3) more masculine 2D:4D digit ratios will be associated with more aggressive behavior, and (Hypothesis 4) these effects will yield superadditive interactions.
Method
Participants
Participants were 446 male undergraduate students at a state university in the American Midwest. Our sample size was planned around a power analysis of the violent-game effect reported in a previous meta-analysis (δ = .43; see Anderson et al., 2010). Testing this effect with 99% two-tailed power would require 400 participants. We set our target sample size at 450, expecting to lose 50 participants to failures of methods or deception. Power to detect higher order interactions was harder to estimate, as it was unclear what effect size to expect. Our planned sample size of 400 would detect effects of |ρ| greater than or equal to .12, two-tailed, with 80% power. Previous studies of 2D:4D ratio and aggression have found simple slopes (rs) of .2 to .5 under aggression-promoting circumstances (e.g., Millet & Dewitte, 2007, 2009).
We restricted our sample to male participants because 2D:4D effects are thought to apply only to men (McIntyre et al., 2007, but see Millet & Dewitte, 2007). Participants were primarily Caucasian (79.7%), with other participants being African American (8.6%), Asian (4.6%), and Latino (3.3%) and 3.8% of participants identifying as another race. On average, participants were 19.0 years old (SD = 1.7, range = 18–31).
The semester ended before the last four experimental sessions could be conducted. Many participants had to be excluded: 41 participants were excluded because the research assistant marked the session as having some error, 3 were excluded because their game-play data indicated an error of game assignment (e.g., dying in the easy game), 13 were excluded for missing data on the primary dependent variable, and 114 were excluded for indicating awareness of the hypothesis. After these participants were excluded, the final effective sample size was 275, yielding 94% two-tailed power to detect δ of .43.
Disclosures
We report how we determined our sample size, all data exclusions, all manipulations, and all measures in the study. Hypotheses and sample-size data were preregistered at https://osf.io/cwenz/. All measures, materials, data, and analytic code are also available at the same link.
Measures
2D:4D ratio
Participants placed their hands on a flatbed scanner with their fingers held together and fully extended. The distance from tip to basal crease of each index finger and ring finger was measured using the caliper tool in the GNU Image Manipulation Program (The GIMP Team, 2014), a freeware Photoshop-like tool. For each hand, 2D:4D ratios were created by taking the ratio of lengths of the index and ring fingers. Five coders provided measurements in this fashion, with each scan coded by at least two coders. Interrater reliability was assessed using a one-way, mixed consistency, average-measures intraclass correlation coefficient (ICC; Hallgren, 2012; McGraw & Wong, 1996) with the psych package in the R programming environment (Revelle, 2017). The resulting ICCs were excellent (ICC3k = .94 for left 2D:4D ratio, ICC3k = .88 for right 2D:4D ratio), indicating high agreement across coders and minimal loss of power to measurement error.
Cold-pressor task
Each participant had an opportunity to behave aggressively toward his partner by assigning the partner to immerse his fist in a bucket of painfully cold water for a predetermined amount of time (Pedersen, Bushman, Vasquez, & Miller, 2008). The cover story described the cold pressor as a form of distraction used to study decision making under distraction.
The cold pressor consisted of a pitcher of water kept in the laboratory refrigerator. Five minutes before the end of the game-play session, the research assistant added a dozen ice cubes to the pitcher. 1 Participants sampled the cold water for 5 s, which showed them that cold-pressor immersion is unpleasant. Participants then assigned their partners to cold-pressor duration using a 9-point scale, ranging from 0 s to 80 s in 10-s intervals. This measure can be quantified in only one way (i.e., 1–9 rating), avoiding concerns about flexible quantification methods associated with the competitive-reaction-time measure of aggression (Elson, Mohseni, Breuer, Scharkow, & Quandt, 2014).
Manipulation checks
Participants completed a questionnaire assessing the efficacy of the various parts of the experimental manipulation. First, participants rated their partners’ feedback as pleasant or irritating (6 items). Then participants rated the video game they played on a number of dimensions, including how violent, exciting, and challenging it was (18 items). All items were rated on a Likert-type scale ranging from 1 (strongly disagree) to 7 (strongly agree). Participants then rated their degree of experience with video games, first-person-shooter video games, and playing video games with a keyboard and mouse. Finally, participants provided demographic information about themselves.
Probe for suspicion
Research assistants attempted an oral funneled debriefing. After this oral debriefing, participants completed a questionnaire intended to imitate a funneled debriefing. This debriefing questionnaire started with broad questions about the study and then grew increasingly specific, asking whether anything seemed strange about the study, the aggression measure, or the other participant in the study. Participants who indicated that the study was about the effects of video games on aggression without picking any lures (debriefing questionnaire, Item 1) were marked as suspicious and excluded from analysis.
Materials
Four modified versions of the video game Doom II (iD Software, 1994) were created using software-modification tools. These four versions were used to create a 2 (easy or hard) × 2 (violent or less violent) design. Violent content was manipulated by changing the graphics, sounds, and story of the game while leaving the controls and enemy behavior constant. In the violent version, enemy graphics and sounds were borrowed from Brutal Doom (Abenante, 2012), a modified form of Doom II that made the game more violent. In this game, defeated enemies exploded into fountains of gore. Participants in this condition were told to kill all the aliens. In the less violent version, enemy graphics and sounds were borrowed from Chex Quest (Digital Café, 1996), a modified version of Doom II that replaced the enemies with silly-looking booger aliens. Participants in this condition were told that the aliens were lost and confused and needed to be sent home with the “zorcher,” a tool resembling a remote controller.
The difficulty of the games was manipulated by changing the enemies’ artificial intelligence. In the difficult version of the game, the enemies fought back, using weapons in the violent game and throwing boogers in the less violent game. Players receiving too many hits would die or become trapped in goo, having to restart the level. In the easy version of the game, enemies would not attack the player and instead walked slowly toward the player and waited to be killed (“zorched”).
The games were also programmed to track some statistics about the players’ performance. These game-play variables included player deaths, player kills, wounds received, bullets fired, shotgun shells fired, and distance progressed. These were used to ensure that players assigned to the easy condition did not receive wounds and that all players used their weapons (“zorchers”) and “zorched” some monsters.
Procedure
Participants arrived at the lab in pairs and were immediately escorted to separate adjacent rooms. When only 1 participant was present, a male research assistant or graduate student would pretend to be the other participant. After participants provided consent, their hands were scanned. Participants were able to see each other as scans were taken, demonstrating the presence of another participant in the study. After they were scanned, participants returned to their desks.
Participants were provoked by their partners in a procedure adapted from Bushman and Baumeister (1998). Participants were given an envelope, a sheet of loose-leaf paper, and a printed essay prompt. They were informed that the first task was to write a 5-min persuasive essay on their personal views on abortion, which would later be judged by the other participant. At the end of 5 min, the essays were collected so that they purportedly could be exchanged with the other participant. All participants wrote an essay that established an unambiguous view on abortion.
During the exchange, each participant received a fake, premade essay designed to oppose his beliefs (a pro-life essay for participants who were pro choice and vice versa). Each participant rated the essay and then put the essay and evaluation in his partner’s envelope, which was then taken from the room, ostensibly for data entry. Participants then played their assigned version of the video game for 15 min. Each participant received a cover story that explained the story and controls of the game.
When the game session ended, the research assistant brought the cold-pressor pitcher and a towel into the room, recorded the game-play variables, and quit the game. The assistant then prepared to open a computer script that ostensibly contained the next task. Participants were told that the next portion of the experiment involved performing a computer task while being distracted by cold water (the cold pressor).
The research assistant then provoked the participant by bringing the participant’s original envelope into the room and showing him the partner’s rating of his essay. The partner had rated all dimensions as between −8 and −10 in quality and commented, “This is the stupidest thing I’ve ever read.” 2 The participant was then asked to assign his partner to an amount of distraction time (i.e., cold-pressor exposure). To avoid experimenter bias, the researcher explained that participants were being asked to randomly assign each other to the various levels of distraction.
Finally, participants were told that the experiment was running out of time and that the distraction task would be skipped. Participants completed post-experiment questionnaires asking them to rate the games, their partners’ feedback, and what they suspected was the purpose of the study. Participants were then fully debriefed and dismissed.
Results
Manipulation check
Game manipulation
Participant ratings on the post-experiment questionnaires were submitted to 2 (violence) × 2 (difficulty) analyses of variance (ANOVAs). The manipulation was highly effective: Participants indicated that the violent game (M = 5.3, SD = 1.6) was much more violent than the less violent game (M = 2.2, SD = 1.3; d = 2.1, 95% confidence interval, or CI = [1.8, 2.4]). They also rated the hard game as more challenging than the easy game, t(243) = 6.15, p < .001, d = 0.74, 95% CI = [0.50, 0.99]. The hard game was not seen as more violent, nor was the violent game seen as more difficult.
Players generally did not perceive themselves to have behaved aggressively during the game (violent game: M = 3.6, SD = 1.78; less violent game: M = 2.76, SD = 1.55; 4 = neither agree nor disagree). Ratings of one’s own aggressive behavior were significantly influenced by the game’s violent content, t(245) = 3.96, p < .001, d = 0.48, 95% CI = [0.24, 0.72], but not by the game’s difficulty, t(245) = −0.49, p = .627, d = −0.06, 95% CI = [−0.30, 0.18]. An interaction suggested that the difference between violent and less violent games was larger when the game was easy, t(245) = −2.09, p = .038, d = −0.26, 95% CI = [−0.51, −0.01].
Provocation
Participants indicated that their received feedback was annoying and unpleasant (M = 4.78, SD = 1.15). To determine whether the cold-pressor outcome was a sensitive measure of aggression, we tested whether participants who were more provoked by the feedback gave higher cold-pressor assignments. The relationship was moderately strong, t(249) = 5.73, p < .001, r = .33, 95% CI = [.22, .43], suggesting that the cold-pressor measure was indeed influenced by participants’ intent to behave aggressively (for details, see the Supplemental Material available online).
If violent games increase hostile appraisals, one might expect participants in the violent-game condition to rate their interaction more negatively. A 2 (violence) × 2 (difficulty) ANOVA was conducted to determine whether the game played influenced participants’ ratings of the interaction. Effects were small and not statistically significant—violence: t(247) = −0.28, p = .777, d = −0.03, 95% CI = [−0.27, 0.20]; difficulty: t(247) = −0.17, p = .867, d = −0.02, 95% CI = [−0.26, 0.22]; Violence × Difficulty: t(247) = −0.86, p = .392, d = −0.10, 95% CI = [−0.34, 0.13]—suggesting that the game played had a minimal influence on participants’ reaction to the feedback.
Conventional general linear models
General linear models were used to look for main effects and interactions of game difficulty, game violence, and 2D:4D digit ratio. Two models were used to look for effects of left and right 2D:4D ratio separately. Factors were contrast coded, and 2D:4D ratios were standardized to preserve the orthogonality of parameter estimates. Cell means and standard deviations are provided in Table 1 and visualized in Figure 1.
Cell Means of Cold-Pressor Assignment per Condition
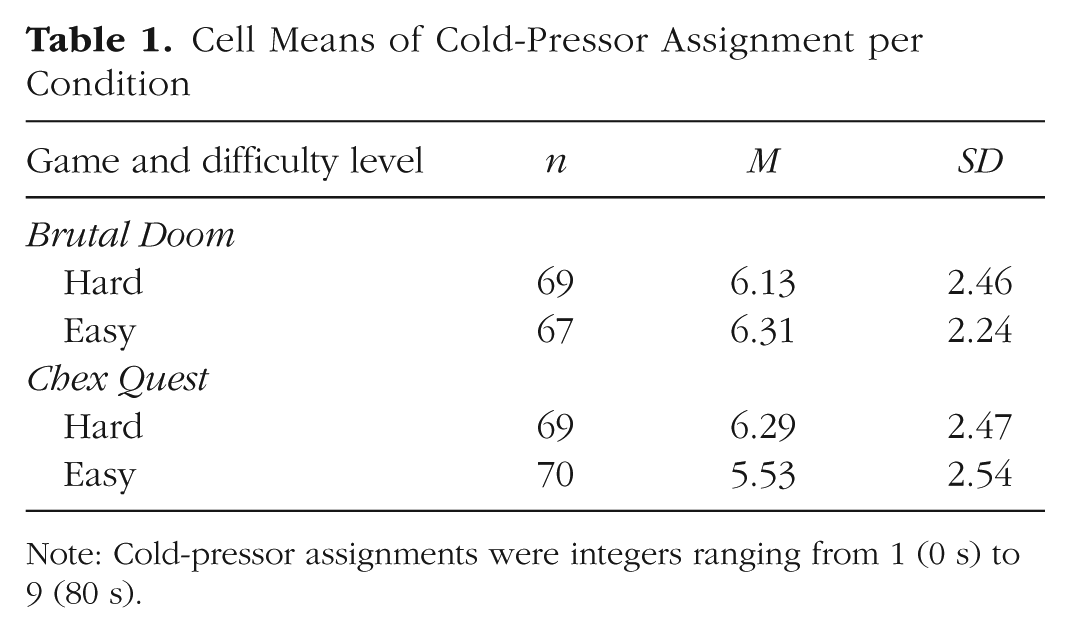
Note: Cold-pressor assignments were integers ranging from 1 (0 s) to 9 (80 s).
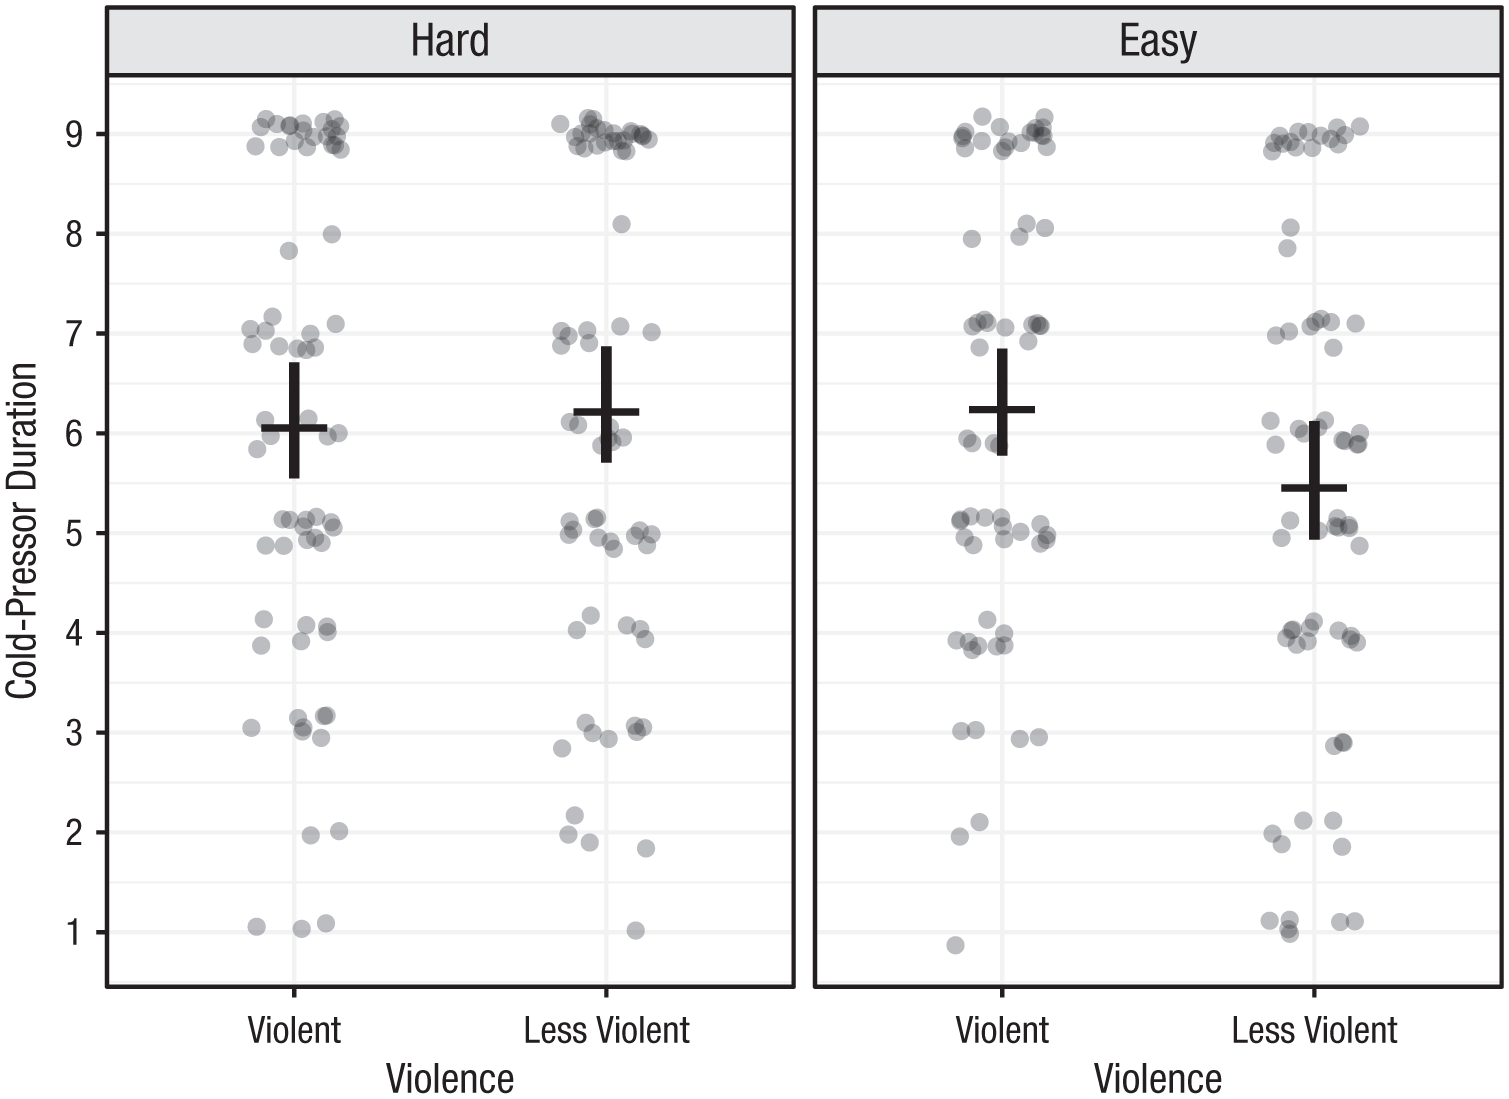
Cold-pressor assignments of individual participants (dots) and condition averages (horizontal bars). The four conditions were a combination of game violence (violent, less violent) and difficulty (hard, easy). Slight vertical and horizontal jitter has been added to reduce overplotting. Cold-pressor assignments were integers ranging from 1 (0 s) to 9 (80 s). Error bars show 95% confidence intervals.
Neither model found any significant effects. Neither game violence, t(265) = 0.90, p = .371, d = 0.11, 95% CI = [−0.13, 0.35]; game difficulty, t(265) = 0.85, p = .395, d = 0.10, 95% CI = [−0.13, 0.34]; nor their interaction, t(265) = −1.52, p = .129, d = −0.18, 95% CI = [−0.42, 0.05], significantly predicted aggression. Additionally, neither left-hand 2D:4D digit ratio, t(265) = −1.11, p = .266, r = −.07, 95% CI = [−.18, .05], nor right-hand 2D:4D digit ratio, t(266) = 0.52, p = .602, r = .03, 95% CI = [−.09, .15], had a significant main effect on aggressive behavior (see Fig. 2). No higher order interactions involving 2D:4D ratio of either hand were statistically significant. The full model output is summarized in Tables 2 and 3.
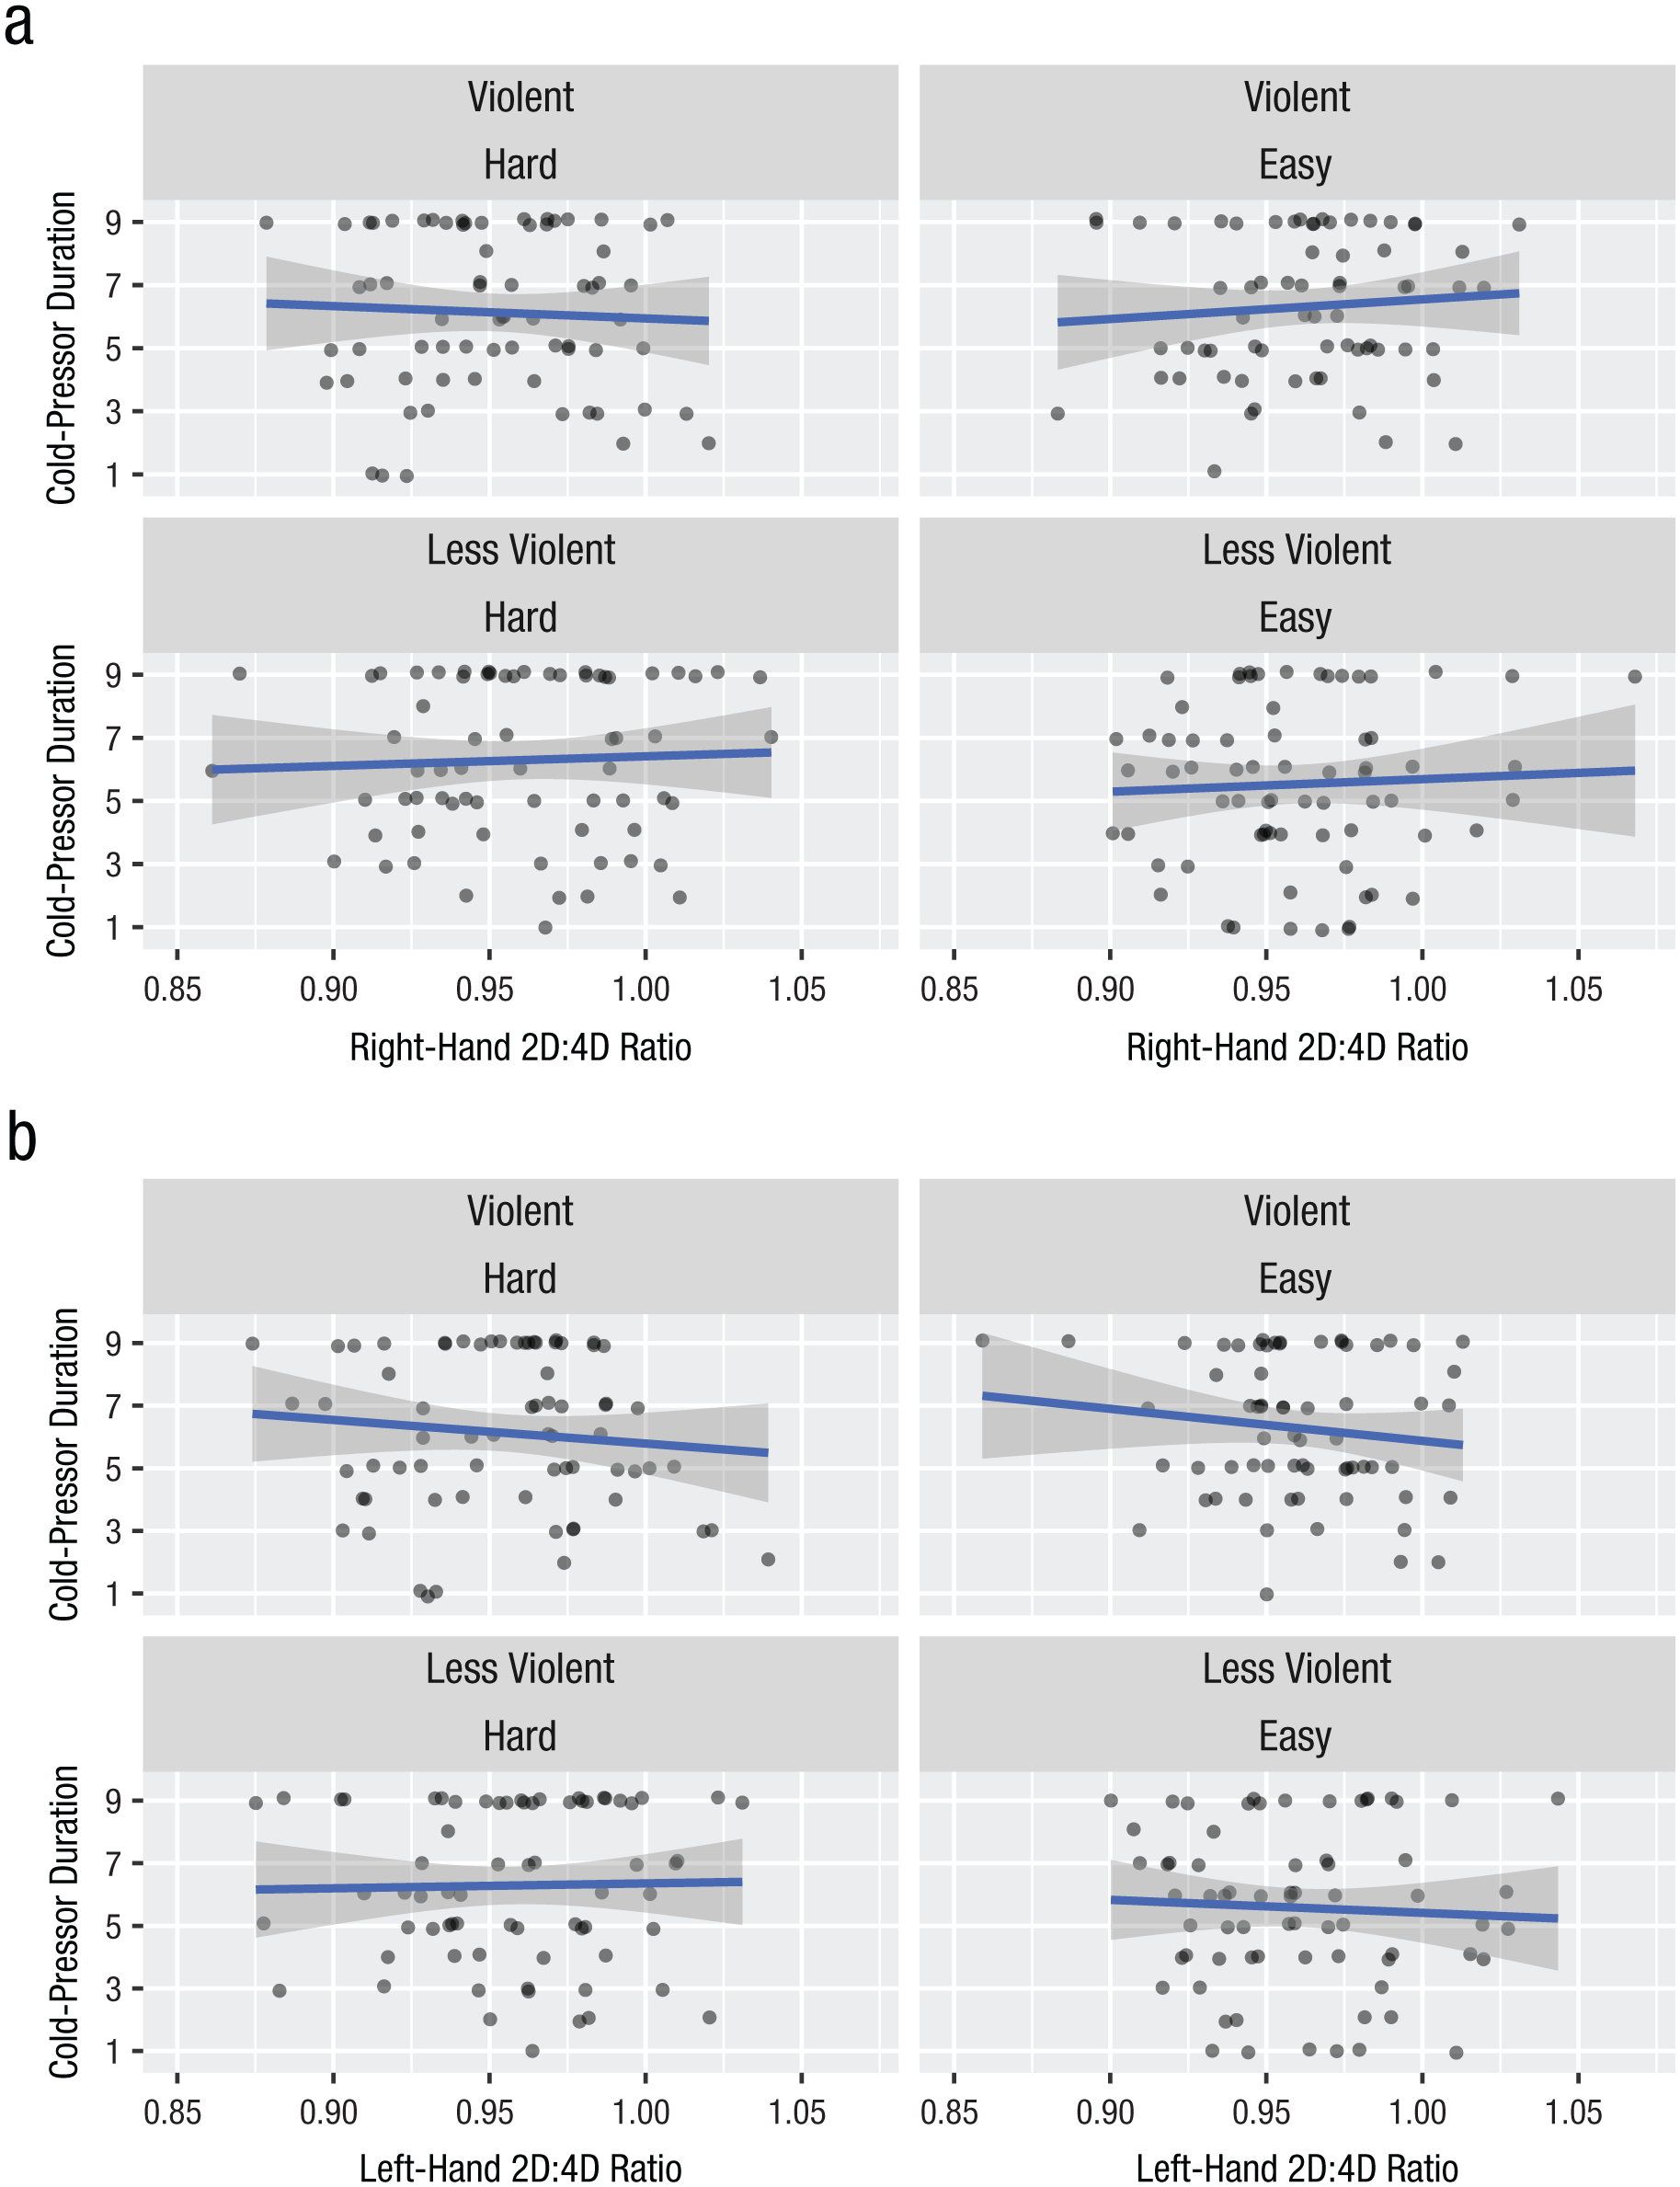
Scatterplots (with best-fitting regression lines) illustrating the relationship between 2D:4D digit ratio and aggression (measured by cold-pressor duration) in each condition (Violence × Difficulty). Results are shown separately for (a) right-hand 2D:4D digit ratio and (b) left-hand 2D:4D digit ratio. Slight vertical jitter has been added to reduce overplotting. Cold-pressor assignments were integers ranging from 1 (0 s) to 9 (80 s). The shaded bands show 95% confidence intervals.
Effects of Violence, Difficulty, and Left-Hand 2D:4D Digit Ratio on Aggression
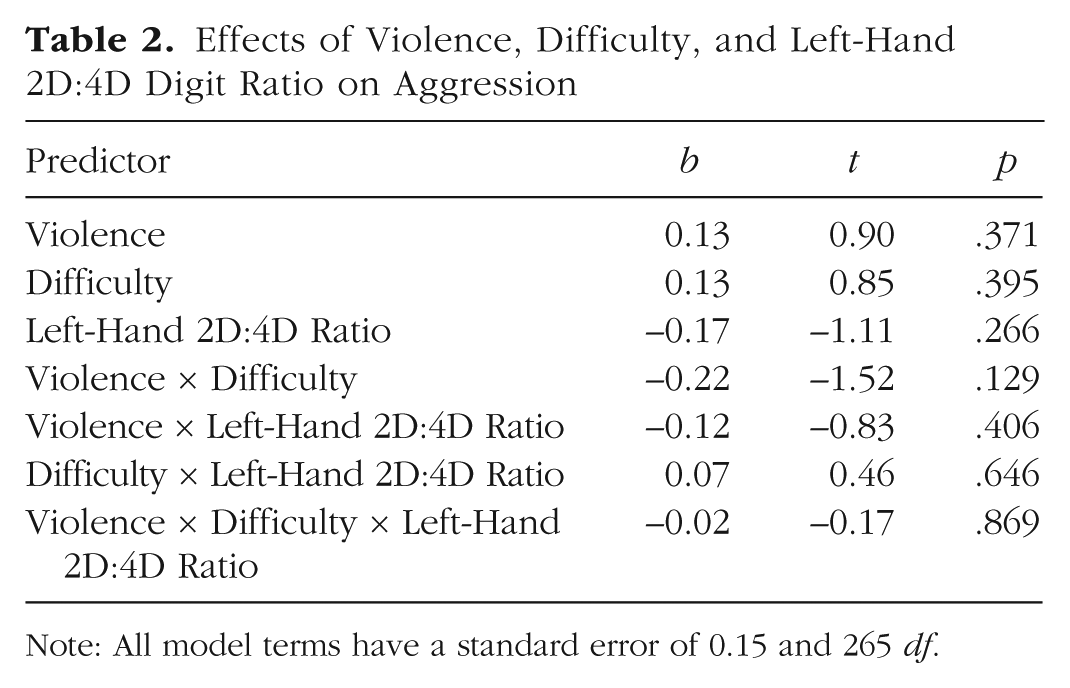
Note: All model terms have a standard error of 0.15 and 265 df.
Effects of Violence, Difficulty, and Right-Hand 2D:4D Digit Ratio on Aggression
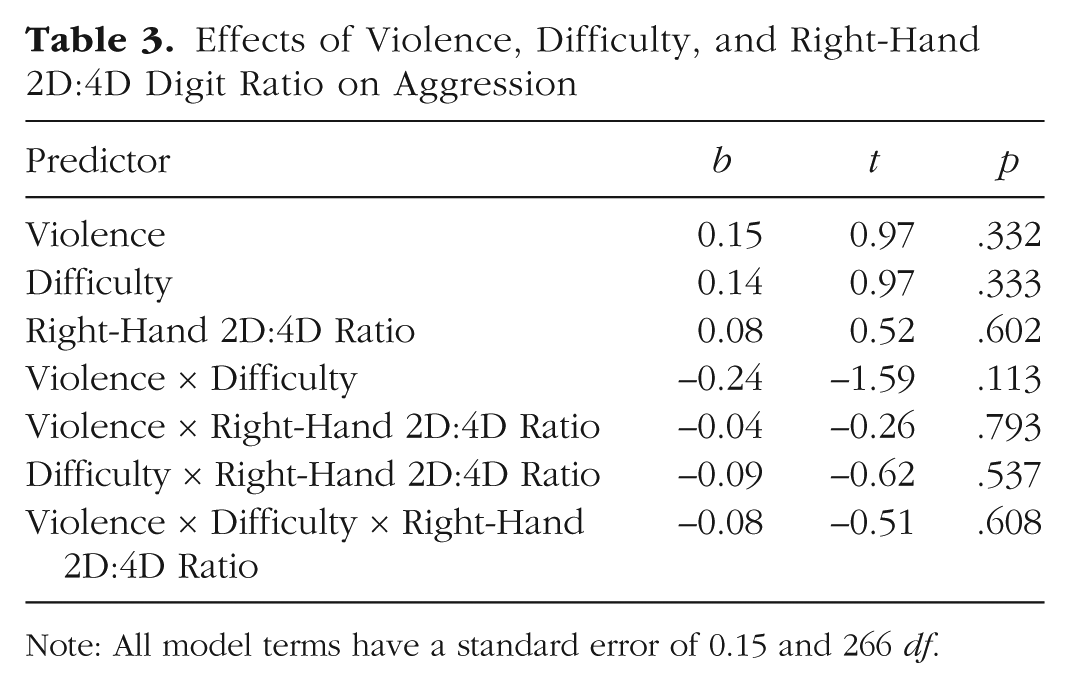
Note: All model terms have a standard error of 0.15 and 266 df.
The earlier manipulation and sensitivity check indicated that much of the variance in aggression could be predicted by experienced provocation. Because this provocation was generally independent of the experimental condition, it was appropriate to try it as a covariate to increase statistical power. However, adding provocation as a covariate did not reveal significant effects—violence: t(246) = 0.78, p = .434, d = 0.09, 95% CI = [−0.14, 0.33]; difficulty: t(246) = 1.08, p = .283, d = 0.13, 95% CI = [−0.11, 0.37]; Violence × Difficulty: t(246) = −1.00, p = .318, d = −0.12, 95% CI = [−0.36, 0.12]. Effects of left-hand and right-hand 2D:4D ratio remained nonsignificant, t(246) = −1.86, p = .065, r = −.12, 95% CI = [−.24, .01], and t(248) = −0.31, p = .755, r = −.02, 95% CI = [−.14, .11], respectively.
Bayesian ANOVA
Models were compared using the BayesFactor package in R (Morey & Rouder, 2015). The scale of the effect size under the alternative hypothesis was specified as δ ~ Cauchy(.4), consistent with the effect size reported in the meta-analysis by Anderson et al., 2010. Models were generated to represent all possible combinations of main effects and interactions. Models including interactions were required to include all lower order interactions and main effects. All models were compared with a null-hypothesis model of no effects (δ = 0).
Of all the models, the null-hypothesis model was best supported by the data. Models of the main effects of violence, difficulty, left-hand 2D:4D ratio, or right-hand 2D:4D ratio were each outperformed by the null model (Bayes factors, or BFs = 3.61, 3.81, 4.40, and 6.53 in favor of the null, respectively). Higher order interactions were also not supported by the data. Evidence was ambiguous regarding a Violence × Difficulty interaction (BF = 1.42 favoring the null). Neither violence nor difficulty interacted with 2D:4D ratio of the left hand (BF01 = 3.97, 4.84, respectively) or 2D:4D ratio of the right hand (BF01 = 4.97, 4.68, respectively). The Violence × Difficulty × 2D:4D interaction was not supported (left-hand BF01 = 3.59, right-hand BF01 = 3.16).
Experienced provocation was added to the model as a predictor. An effect of provocation was strongly supported by the evidence (BF10 = 1.04 × 10⁶). However, the addition of this covariate did not improve the strength of evidence for the main effects of violence (BF01 = 5.04), difficulty (BF01 = 3.62), or 2D:4D ratio (left hand BF01 = 1.26, right hand BF01 = 6.13). Taken together, these results indicate that aggression could be predicted by experienced provocation but not by game condition.
In the Bayesian hypothesis tests provided above, we used a nondirectional, nonspecific alternative hypothesis scaled roughly to the magnitude of the expected effect. Although this is a useful hypothesis to test, it would also be useful to compare the obtained results with a more specific alternative hypothesis representing the effect as estimated from the previous meta-analysis, δ = .43 (95% CI = [.35, .52]; Anderson et al., 2010).
The main effect of violence was observed as an effect size (d) of 0.11, 95% CI = [−0.13, 0.35]. An online BF calculator (Dienes, 2008) was used to compare the evidence for the null hypothesis (δ = 0) with the evidence for H1, the effect-size estimate from previous meta-analysis (δ = .43, 95% CI = [.35, .52]). The obtained BF substantially preferred the null, BF01 = 14.2. Proponents have suggested that Anderson et al.’s (2010) estimate may be an overestimate because of publication bias but that after adjustment for publication bias, the effect (d) is still approximately 0.30 (Kepes, Bushman, & Anderson, 2017). The BF calculator was used to compare the evidence for the null hypothesis (δ = 0) with the evidence for H2, the revised estimate (δ = .30, 95% CI = [.20, .40]). The obtained BF still preferred the null but less so relative to this more modest estimate, BF02 = 2.0.
Supplemental analyses
Cold-pressor assignments were found to be nonnormally distributed. To address this nonnormality, we analyzed the data using censored regression, logistic regression, and ordinal regression. Censored regression was used to attempt to model responses greater than 9, and logistic regression was used to model the probability of a 9 response versus all other responses. These methods did not yield substantively different conclusions (i.e., no parameters were significant; for details, see the Supplemental Material).
Exploratory analyses examined other potential correlates of aggression. Neither participants’ self-reported history of violent-game use nor their in-game behaviors were correlated with their cold-pressor assignments (for details, see the Supplemental Material).
Discussion
Results indicate that when game stimuli are carefully controlled, the effects of 15 min of violent and difficult game play on aggressive behavior may be small and indistinguishable from zero. This suggests that the effects of brief violent-video-game play on aggressive outcomes may be smaller and less robust than the published research literature would indicate (see also Engelhardt, Mazurek, Hilgard, Rouder, & Bartholow, 2015; Hilgard et al., 2017; McCarthy, Coley, Wagner, Zengel, & Basham, 2016). Researchers may need to reevaluate whether violent-video-game manipulations are useful for revealing the causes and mechanisms of aggression. Further research will also be necessary to determine whether, and under which conditions, competitive or frustrating game play causes aggression (Adachi & Willoughby, 2011; Przybylski et al., 2014).
In addition, 2D:4D digit ratio failed to predict aggressive behavior among participants. The current results cast doubt on 2D:4D ratio as an index of prenatal testosterone and a predictor of aggressive behavior (see also Hönekopp & Watson, 2011; Voracek, 2014). The sample size of the current research is considerably larger than the samples in many other studies reporting significant associations between 2D:4D ratio and aggression (e.g., Millet & Dewitte, 2007, 2009).
Three factors may have reduced the effect size relative to previous research. First, it is possible that the less violent Chex Quest game involves sufficient violence to cause an increase in aggression, eliminating the difference between conditions. One study has suggested that the effect of cartoon E-rated violence is as strong as that of explicit M-rated violence (Anderson, Gentile, & Buckley, 2007). This seems unusual; exposure to extremely violent content, compared with mildly violent content, should be more desensitizing, activate more aggressive thoughts, stimulate more aggressive feelings, and reward more aggressive behavior. Furthermore, our participants generally disagreed that Chex Quest involved violence or that their in-game behavior was aggressive. Still, it is possible that an effect was not found in the present study because Chex Quest causes some increase in aggression, reducing the effect size when compared with Brutal Doom. Future research should test the dose-response curve of violent content and aggressive behavior.
Second, because a plurality of participants (29%) gave the maximum possible aggressive response, it is possible that our measure was not sensitive to the influence of violent games. In the context of provocation, there may be a ceiling effect that compresses scores and reduces the sensitivity of the measure. On the other hand, only a minority of responses were at the maximum, and logistic binomial and ordinal regression observed no differences between groups in maximum responding. Furthermore, there was sufficient variability in both provocation and aggression to allow us to observe a moderate (r = .33) correlation between the two, suggesting that the outcome remained a valid and sensitive measure of aggression. Because all participants were provoked, provocation is not a source of noise variance; at most, effect sizes might be reduced by restriction of range. Finally, we note that other studies have found violent-game effects on aggression in the context of provocation (e.g., Carnagey & Anderson, 2005, used the same essay provocation and reported significant effects on a noise-blast task). Nevertheless, restriction of range in the outcome could reduce the effect size. We encourage researchers to report the properties and test the validity of measures of aggressive behavior.
Finally, many participants indicated an awareness of the research hypothesis and were discarded. This may have been, in part, because of the redundant process of oral funneled debriefing and questionnaire funneled debriefing, which may have increased awareness of the hypothesis following collection of the primary outcome. We chose to be conservative in our quality checks so as not to overstate the evidence for the null hypothesis. Nevertheless, one might be concerned that still more participants were aware of the hypothesis, reducing the observed effect size through reduction of internal validity or through reactance (Bender, Rothmund, & Gollwitzer, 2013). Researchers may find value in establishing standardized practices in deception and debriefing.
Summary
We found evidence that brief exposure to violent games does not cause aggressive behavior. It is uncertain whether laboratory paradigms involving brief exposure to violent video games can reveal the causes of aggression. Similarly, 2D:4D ratio does little to predict aggression in a laboratory experiment. One might question the validity of 2D:4D ratio as an index of prenatal testosterone or whether prenatal testosterone predicts aggression. Research may benefit from addressing sources of irreplicability in this literature and considering other potential causes of aggression.
Supplemental Material
HilgardOpenPracticesDisclosure – Supplemental material for Null Effects of Game Violence, Game Difficulty, and 2D:4D Digit Ratio on Aggressive Behavior
Supplemental material, HilgardOpenPracticesDisclosure for Null Effects of Game Violence, Game Difficulty, and 2D:4D Digit Ratio on Aggressive Behavior by Joseph Hilgard, Christopher R. Engelhardt, Jeffrey N. Rouder, Ines Segert and Bruce D. Bartholow in Psychological Science
Supplemental Material
HilgardSupplementalMaterial – Supplemental material for Null Effects of Game Violence, Game Difficulty, and 2D:4D Digit Ratio on Aggressive Behavior
Supplemental material, HilgardSupplementalMaterial for Null Effects of Game Violence, Game Difficulty, and 2D:4D Digit Ratio on Aggressive Behavior by Joseph Hilgard, Christopher R. Engelhardt, Jeffrey N. Rouder, Ines Segert and Bruce D. Bartholow in Psychological Science
Footnotes
Action Editor
Michael Inzlicht served as action editor for this article.
Author Contributions
All the authors contributed to the study concept and design. J. Hilgard collected the data with assistance from undergraduate research assistants trained in part by C. R. Engelhardt. J. Hilgard analyzed and interpreted the data under the supervision of J. N. Rouder, B. D. Bartholow, and I. L. Segert. J. Hilgard drafted the manuscript and all other authors provided revisions. All the authors approved the final manuscript for submission.
Declaration of Conflicting Interests
The author(s) declared that there were no conflicts of interest with respect to the authorship or the publication of this article.
Open Practices
All data and materials have been made publicly available via the Open Science Framework and can be accessed at osf.io/cwenz. The hypotheses were preregistered at https://osf.io/ceyx0/wiki/home/, and the design was preregistered at https://osf.io/idsvr/wiki/home/. The analysis plans were not preregistered. The complete Open Practices Disclosure for this article can be found at http://journals.sagepub.com/doi/suppl/10.1177/0956797619829688. This article has received the badges for Open Data and Open Materials. More information about the Open Practices badges can be found at ![]() .
.
Notes
References
Supplementary Material
Please find the following supplemental material available below.
For Open Access articles published under a Creative Commons License, all supplemental material carries the same license as the article it is associated with.
For non-Open Access articles published, all supplemental material carries a non-exclusive license, and permission requests for re-use of supplemental material or any part of supplemental material shall be sent directly to the copyright owner as specified in the copyright notice associated with the article.