
Abstract
Although declarative concepts (e.g., apple) have been shown to be identifiable from their functional MRI (fMRI) signatures, the correspondence has yet to be established for executing a complex procedure such as tying a knot. In this study, 7 participants were trained to tie seven knots. Their neural representations of these seven procedures were assessed with fMRI as they imagined tying each knot. A subset of the trained participants physically tied each knot in a later fMRI session. Findings demonstrated that procedural knowledge of tying a particular knot can be reliably identified from its fMRI signature, and such procedural signatures were found here in frontal, parietal, motor, and cerebellar regions. In addition, a classifier trained on mental tying signatures was able to reliably identify when participants were planning to tie knots before they physically tied them, which suggests that the mental-tying and physical-tying procedural signatures are similar. These findings indicate that fMRI activation patterns can illuminate the representation and organization of procedural knowledge.
Tying a knot is an ancient and useful human act that is the epitome of everyday procedural knowledge. Making an appropriate knot remains central to the work of sailors, fishermen, and surgeons, among others. Knot tying requires the coordination of several different types of processing, such as planning, motor activity, and spatial processing, that involve the use of a diverse set of neural resources. The goal of this research was to characterize the neural representations of the procedural knowledge of how to tie seven individual knots.
Procedural knowledge has been a focus of neuroimaging from the beginnings of positron-emission tomography (Grafton et al., 1992), and the nature of the underlying neural representations continues to be addressed using functional MRI (fMRI; for a review, see Grafton, 2010). More specifically, neuroimaging studies have investigated knot tying, generally focusing on which brain regions are involved or on the effect of learning (Cross, de C. Hamilton, Cohen, & Grafton, 2017). Involved regions can be related to motor control (postcentral gyrus), object manipulation and visualization (intraparietal sulcus, or IPS, and other parietal regions), and object encoding (fusiform gyrus; Cross et al., 2012). The involvement of cortical regions can be modulated by the degree of knot learning: Shallow learning is associated with parietal cortex activation, and deeper learning is associated with medial structures such as posterior cingulate and precuneus (Tracy et al., 2003). Although these prior studies are informative about which regions may be involved in knot tying in general, they did not focus on the neural representations of knot-tying procedures for individual knots. They do not tell us where or how individual procedures are neurally represented.
Multivoxel pattern analysis (MVPA) has the potential to identify the neural signature of the tying of a specific knot. In contrast to univariate analyses that consider the activity of each voxel independently of any distal voxels, MVPA can identify a spatially distributed activation pattern that is associated with a particular concept. In the case of a declarative concept such as apple, it is possible to specify that the concept is neurally represented by a pattern of activation levels in a set of voxels distributed over multiple brain systems (Carota, Kriegeskorte, Nili, & Pulvermüller, 2017; Huth, Nishimoto, Vu, & Gallant, 2012; Just, Cherkassky, Aryal, & Mitchell, 2010; Mitchell et al., 2008). This pattern is the concept’s fMRI signature.
Unlike the representation of a declarative concept, the neural representation of a procedure should contain information about a mental process that unfolds over some time period while a sequence of actions is executed. In this study, we attempted to uncover the neural representation of the temporally unfolding procedure for tying several different types of knots and to identify the brain structures involved.
To examine procedural knot-tying knowledge, we gave participants with little previous knot-tying experience (besides shoelaces and square knots) computer-based video training in tying knots. This training technique has proven to be effective for learning how to tie knots (Brandt & Davies, 2006; Rogers, Regehr, Yeh, & Howdieshell, 1998; Schwan & Riempp, 2004), and imagined knot tying is one of the training techniques surgeons use for teaching suturing (Torkington, Smith, Rees, & Darzi, 2000). Neural representations were assessed using a machine-learning technique applied to the fMRI data, which were collected while the participants imagined tying each knot after being prompted with the name and a picture of the knot.
A subset of participants also physically tied the knots. Despite differences between motor imagery and movement execution, there are some common underlying brain networks (for a meta-analysis, see Hardwick, Caspers, Eickhoff, & Swinnen, 2018). For example, simulation theory postulates a common network for motor imagery, execution, and observation (Jeannerod, 2001). Other theories suggest that the same network is used for simulation and execution (Guillot & Collet, 2005), and still others suggest that action simulation more heavily loads on executive functions (Glover & Baran, 2017). Our approach was to empirically test whether a classifier trained on the activation patterns associated with each knot during mental tying could identify the knots on the basis of the activation pattern evoked at the beginning of physical knot tying (just prior to movement initiation). The inclusion of physical-tying trials enabled a cross-task comparison of the procedural representations.
The goal of the current study was to determine the neural representations of the procedure of tying individual knots using a machine-learning, cross-validation, prediction approach (Breiman, 2001). This type of analysis has an advantage over hypothesis testing and statistical regression modeling for complex tasks with a potentially large number of predictor variables. Here we tested the ability to identify a neural representation of tying a knot on the basis of the concomitant brain-activation patterns.
Statement of Relevance
How skills and procedures are represented in the brain is a fundamental question. In this research, we used functional MRI to analyze neural activation patterns as participants engaged in the everyday activity of tying different knots in a rope (e.g., bowline). Tying a knot is an ancient and frequently performed human action that is the epitome of everyday procedural knowledge, making it an excellent target for investigation. We found that at the neural level, the procedure for tying a knot is represented as a motor plan—a higher-order mental structure that goes beyond a linkage between successive steps. Moreover, at the level of the individual knot, the neural signatures were similar for imagining tying the knot and planning the actual tying. This similarity enabled us to use the neural signatures to identify specific knots in both modalities. The ability to identify the neural representation of a motor plan informs the question of how complex procedures are represented in the brain and may ultimately be beneficial in developing brain–computer interfaces.
The usefulness of MVPA for exploring procedural rules has recently been demonstrated in motor-action tasks that differ in level of abstraction (opening a bottle vs. opening a bottle with particular tools vs. opening different containers; Wurm & Lingnau, 2015) or when participants had to perform hand movements such as aiming, squeezing, or extension (Pilgramm et al., 2016; Zabicki et al., 2017). Zabicki et al.’s findings are particularly informative because the authors used both representational-similarity analysis (RSA) and MVPA to test models of imagery, execution, and cross-modality to examine the type of processing in various cortical regions. They noted that “One conclusion for the similarity of executed and imagined actions therefore might be that . . . the similarity of [motor imagery] and [motor execution] is highest for higher levels of action processing like the planning of a movement” (p. 4534). In the present research, we focused on the planning of the movements and experimentally isolating the planning.
MVPA has also been used in button-pressing tasks involving sequenced behavior (Woolgar, Thompson, Bor, & Duncan, 2011; Yokoi, Arbuckle, & Diedrichsen, 2018). In rule-mapping button pressing (in which the stimulus information indicates which finger and which hand to respond with), activation patterns have been observed in different brain regions corresponding to stimulus and task attributes, such as rules (e.g., inferior frontal sulcus, or IFS; insula; and IPS), position of a cue (IFS and IPS), and background color (insula and IPS). In contrast, no main effects of these variables have been found in a univariate analysis.
The current project enhances the understanding of how sequences of actions (Woolgar et al., 2011; Yokoi et al., 2018) and imagined and executed movements are neurally represented (Pilgramm et al., 2016; Zabicki et al., 2017) in the context of a complex, sequential, and naturalistic procedural task. This project advances the prior research in three ways: (a) It identified procedural representations in a naturalistic, complex task; (b) it focused on a procedure that involved a sequence of several hand movements rather than a single action; and (c) it characterized the mental representations of procedural planning (before the execution of a task) on the basis of the imagined performance of the task. We centrally addressed the challenge of identifying the neural signatures of the tying of individual knots and determining the role of those signatures in the planning stage that preceded tying.
Method
Participants
Seven right-handed adults (6 women and 1 man between the ages of 20 and 36 years old) from the Carnegie Mellon community participated in several experimental sessions. They came to the lab four times (Phase 1: Training Session 1 and Testing Session 1; Phase 2: Training Session 2 and Testing Session 2). In Phase 1, the first session was a training session in which the participants learned to tie seven knots. The session ended when they were able to tie each knot successfully twice with instructions and once without instructions. This was followed by a testing session in the scanner within 1 day of the training session. In the testing session, they imagined tying each knot six times (mental tying) as described below in the Testing Session section. Phase 2 was a replication of Phase 1. The only change was an increase in the criteria for ending the training session. The Phase 2 training session ended when each knot was successfully tied five times without written instructions present. Phase 2 followed Phase 1 within a month (M = 13 days, range = 7–28). Three of these trained participants returned for a Phase 3. Because several months had passed since Phase 2 testing, Phase 3 provided a retraining session in which the participants retrained to tie seven knots until they were as proficient as in Phase 2. These participants were then scanned for the Phase 3 testing session, in which they physically tied all seven of the knots six times, providing 126 instances of physical knot tying in the scanner. The precise Phase 3 instructions are described below in the section titled Classification of the Motor Planning That Precedes the Physical Tying of Knots.
All participants gave signed informed consent approved by the Carnegie Mellon Institutional Review Board. Six participants contributed data from 12 mental-tying test sessions (data from 1 participant were discarded because of excessive motion > 1 mm in the y plane and > 3 mm in the z plane). Our measurement approach was to use predictive modeling as opposed to hypothesis testing, given that Breiman (2001) argued that power considerations are very different. This technique is common in machine-learning assessment and represents a shift from a data-modeling culture. The goal is to find an algorithm for f(x) that will make future x in a test set a good predictor of y. Having 6 participants with two sessions and six repetitions of each knot-tying trial enabled a strong test of predictability using cross-validation in algorithmic modeling. The classification analysis is described in detail below. This approach provides an unbiased estimate of predictive accuracy rather than a reliance on goodness of fit in regression models.
Training session
In the training session, participants watched a series of instructional videos of how to tie each type of knot, and then they physically tied them. The video for each knot began with the name of the knot and then described and demonstrated, step by step, how that knot is tied. All knots consisted of five steps, except for the clove hitch (three steps) and the taut-line hitch (six steps). Participants were instructed to tie the knot step by step as they watched the video. At the end of the video describing how a given knot was tied, they were instructed to again attempt to tie the knot, this time while the full set of instructions remained on the screen. They were allowed only one attempt to tie the knot before they were moved on to the instructions for the next knot, regardless of the success or failure of that attempt (and of the attempt while watching the video).
After cycling through all seven knots, the participants attempted to tie each knot when presented with only the name and a picture of a tied knot. For any knot that they failed to tie correctly, they restarted the training/test cycle for only that knot. When they correctly tied each knot that they had previously tied incorrectly, the training session ended. Participants returned on the day after their training session for the fMRI session. The second training session was the same, except that the learning criterion was increased to five correct attempts in a row for each knot. The extended set of training instructions, including the description of knot-tying terminology (e.g., quadrant, loop, and intersection) and a link to a sample training video, can be found in the Supplemental Material available online.
Testing-session task instructions
In the testing session, the participant’s task was to mentally go through the steps of tying a knot, as follows: Please think of each step of the knot-tying separately. Do not move on to the next step before you have mentally completely performed the previous step. Please mentally work through every motion associated with each step in your mind to completion and do not short-cut around a particular step. Also please do not skip steps that are unclear but rather do your best to work through them as you did for previous steps.
Testing-session experimental paradigm
The stimuli were seven nautical knots: square, two half hitch, timber hitch, taut line, clove hitch, bowline, and sheet bend. Each knot was presented six times (in six different random permutation orders of the seven knots). On each trial, the name of the knot along with a picture of the tied form of the knot were presented for 7 s, during which the participant mentally tied the knot (see Fig. 1 for an example). One end of the rope was colored black so the two ends could be distinguished in the instructions. This task was followed by a 7-s rest period, during which the participant fixated on an “X” displayed in the center of the screen. There were three additional presentations of a fixation “X,” 17 s each, distributed across the session to provide a baseline measure.
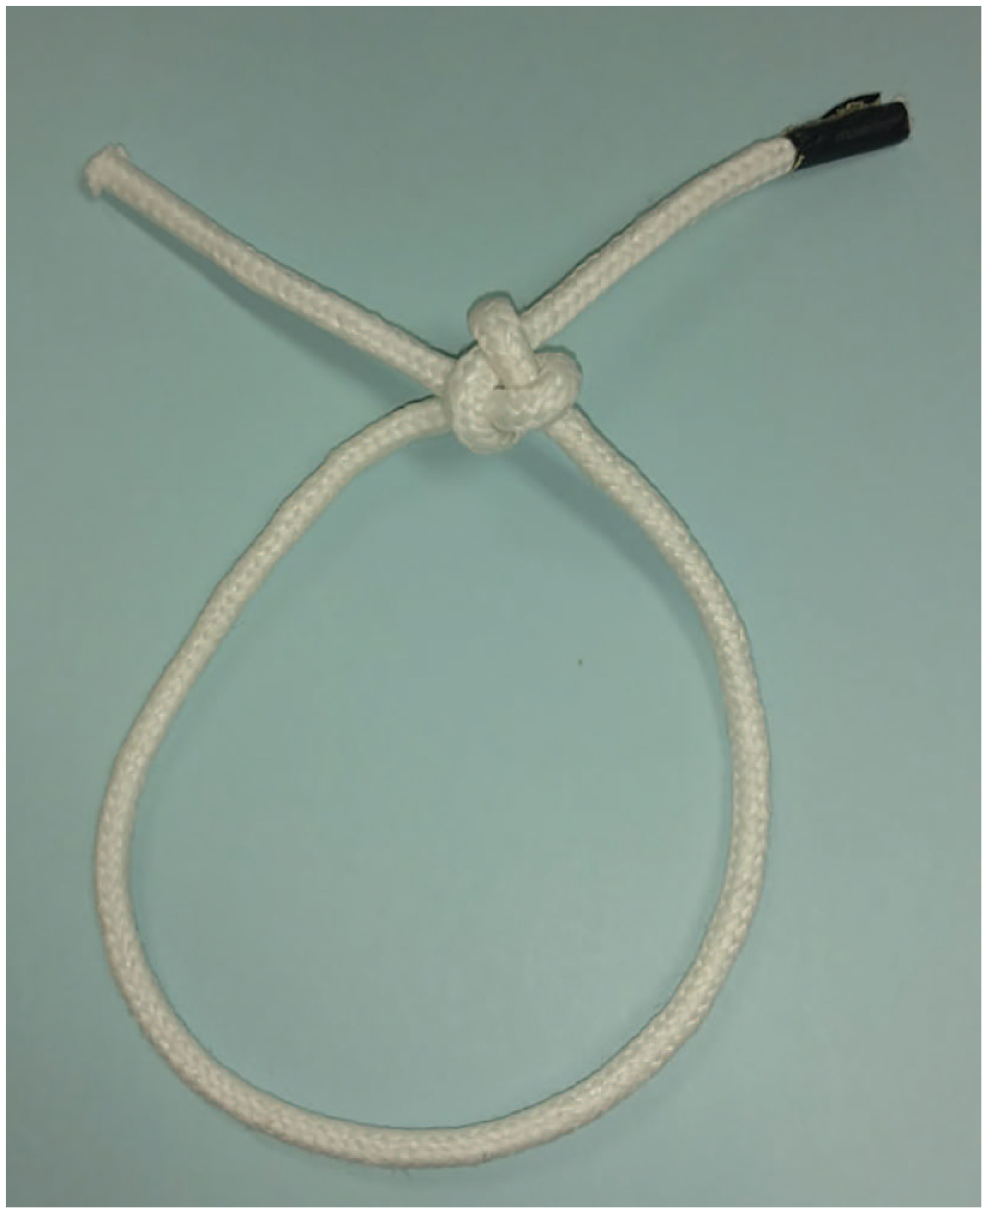
One of the seven knot photos shown to participants. One end of the rope was colored black so the two ends could be distinguished in the instructions.
In the second phase of the fMRI acquisition, after participants had completed the mental knot-tying task, they were asked to physically tie each of the knots only once (as prompted in a random order). The name and a picture of the knot were presented to indicate which knot to tie. Participants were instructed to quickly and accurately tie the knot as soon as they could after the name and picture appeared. The knot name and picture were displayed for 40 s, followed by a prompt that required participants to press a button to continue to the next knot. Before participants advanced to the next knot, the experimenter removed the tied knot and supplied the participant with a new rope.
fMRI procedures
Functional images were acquired on a Siemens Verio (Erlangen, Germany) 3.0T scanner at the Scientific Imaging and Brain Research Center of Carnegie Mellon University using a gradient echo echo-planar imaging pulse sequence with a repetition time of 1,000 ms, an echo time of 25 ms, and a 60° flip angle. Twenty 5-mm thick anterior commissure-posterior commissure aligned slices were imaged with a gap of 1 mm between slices using a 32-channel head coil. The acquisition matrix was 64 × 64 with 3.125-mm × 3.125-mm × 5.0-mm in-plane resolution. Images were corrected for slice-acquisition timing, motion, and linear trend and were normalized to the Montreal Neurological Institute template without changing voxel size (3.125 mm × 3.125 mm × 6 mm). The gray-matter voxels were assigned to anatomical areas with reference to Automated Anatomical Labeling (AAL) masks (Tzourio-Mazoyer et al., 2002). The original set of 90 AAL regions was modified in two cases: An IPS region of interest (ROI) was generated to parcel out sulcal activation from the superior and inferior parietal regions, and the precentral, postcentral, and supplementary motor region were combined into a motor cortex ROI.
The percentage signal change (PSC) relative to the fixation condition was computed at each gray-matter voxel for each stimulus presentation (the PSC data were converted to z scores). The main measure used in the subsequent analyses consisted of the voxel activation levels on each of the six brain images acquired within a 6-s window, offset 5 s from the stimulus onset (i.e., Images 5–10). In several previous machine-learning studies of fMRI-assessed neural representations (e.g., Just et al., 2010), the window and the offset were 4 s to account for the delay in hemodynamic response. Here, an additional second was added to the offset, and 1 s was added to the window to account for the complexity of mentally tying a knot compared with thinking about a well-known, concrete object. An exploration of data from 2 pilot participants suggested that this 5-s to 10-s window provided maximal classification accuracies (see the Supplemental Material). In the analysis of the physical-tying data, a smaller, earlier, 4-s to 7-s window was used to be consistent with the motor-planning interval as described below; all other parameters remained the same.
Time-course analysis and voxel selection
Prior to the selection of stable voxels, the activation time course for each knot in each presentation was normalized to a mean of 0 and a standard deviation of 1 in the critical 6-s window. This eliminated the effect of the amplitude of activation, and only the pattern of activation over time for each knot remained.
Voxels in the training set were selected using the criteria that their activation levels for different knots were stable across repetitions and at the same time their activation patterns distinguished between the knots; selection was a three-step procedure. First, the mean pairwise correlation of the six activation levels (in the 6-s window) across presentations was computed for each voxel (i.e., correlations were calculated for each knot at each voxel, and then the correlations were averaged over knots). High correlations indicated that their activation profile (i.e., the tuning curve of the voxel) over the seven knots was stable across the multiple presentations of the stimulus set. (The activation profile of a voxel refers to the vector of its seven responses, or activation levels, at six time points to the seven knots during that presentation.) Second, the mean pairwise correlation for the 6-s window across knots was calculated for each voxel (i.e., correlations were generated for each knot at each voxel and then averaged over presentations). Low correlations indicated distinctiveness between knots. Third, the measures from the first two steps were combined.
The voxel-selection criterion measure was the summed value of similarity on the first correlation (high correlation across presentations) and the distance (negation of the correlation) in the second correlation (low correlation across knots). For the whole brain analysis, the 120 voxels with the highest summed similarity-distance scores were selected, and for the individual anatomic region analyses, the 10 voxels with the highest summed similarity-distance scores within each anatomical region were selected. Previous research has indicated that a set of 120 to 240 voxels provides maximal classification (see http://www.ccbi.cmu.edu/publications.html#neurosemantics for a variety of tasks that use similar numbers of features). The lower number of 120 voxels was selected here a priori. Selection of voxels occurred only in the training set, and then they were used to classify activation of that set of voxels in the test set. For purposes of visualization only, to indicate the locations of the selected voxels, we calculated the summed similarity-distance across the entire data set (no separate test set was left out) for each participant, and then a map of the union of those voxels was generated.
Classification of mental tying of individual knots
Gaussian naive Bayes (GNB) classifiers were applied in a cross-validation procedure (Just et al., 2010) to identify the seven knots from their fMRI time-series signatures. The classifier was trained using selected voxels (as described above) from only a subset of the data (the training set) and then tested on the remaining data (the test set). On each of the folds of the cross-validation procedure used for the within-participants classification, the training set on which the GNB classifier was trained consisted of the data for each of the seven knots from four of the presentations (selecting the 120 most stable voxels in the training presentations), and the test set consisted of the mean of the remaining two presentations (averaging over two test presentations to simply reduce noise). There were 15 folds of cross-validation, defined by the 15 ways that four of the six presentations could be chosen to be in the training set. The data for this and the majority of the analyses of mental knot tying, unless otherwise stated, consisted of the fMRI time series (normalized to remove overall amplitude differences among the seven knot signatures), which were composed of 6 consecutive images obtained 1 s apart from the 5th to the 10th image after stimulus onset, reflecting the relative activation at successive time points in the mental knot-tying procedure.
We calculated normalized rank accuracy (referred to hereafter simply as accuracy) of the classification, which is the normalized rank of the correct label in the classifier’s posterior-probability-ordered list of classes. If the classifier were operating at chance, the correct label would appear on average in the middle of the ranked list, producing a chance-level normalized rank accuracy of .50. Accuracies were calculated for each item in each fold, then averaged across folds, and then across items. Statistical significance levels were obtained using random permutation testing (for the seven-class classification). The seven knot labels associated with each of the six repetitions of imagined knot tying were randomly permuted, with 350 such iterations for each participant.
For the between-participants classification, the classifier was trained on data from 11 sessions (5 participants in 2 sessions each plus 1 participant from a single session) and tested on the left-out participant-session. In this analysis, each participant’s data for the test set were averaged over the six presentations. The mean signal over the 6-s window corrected for the possibility that the rate of mental knot tying was different across participants. In addition, the between-participants data were conducted on the nonnormalized data.
Classification of the motor planning that precedes the physical tying of knots
This analysis tested whether a classifier that was trained on the signature of the mental tying of knots could classify the signature of the motor planning that precedes physical tying. Three participants from the original set returned and physically tied all the knots multiple times in the scanner. The following procedure isolated the mental planning of the tying of a knot. On each trial, participants were first handed a rope that they then held in the ready position, and they then pressed a “ready” button. Following the button press, they were shown the name and image of the target knot for 4 s. Their instructions were to “First, plan how to tie the knot and do not begin to tie the knot until after ‘START TYING NOW’ appears on the screen.” The experimenter observed the participants’ hands to ensure that they followed these instructions precisely on every trial. The end of the planning period was indicated by the instruction “START TYING NOW!” printed in red above the knot name. The red prompt disappeared after 2 s.
The 4-s delay was motivated by two factors. First, the delay had to be long enough that the hemodynamic response from multiple images could be averaged. Second, it had to be the approximate length of time for a planning stage. This was determined by estimating the time prior to any motor action. For this purpose, 2 participants repeated the physical-tying task in the scanner environment while video recordings of their hand movements were made. The analysis of the videos indicated that the participants never began to tie the knots until at least 3 s had passed (range = 3–7 s). On the basis of this testing, the temporal window used for the fMRI test data for classifying the planning stage were the four images from Images 4 through 7 after stimulus onset (taking into account the hemodynamic delay of the fMRI signal), representing only the time to mentally plan the tying of the knot and never including activation due to physical motion.
The classification of the motor planning of knot tyings was based on the neural signature of the mental tying of the knots. The classifier was trained on the mean mental knot-tying data for each knot, averaged across all presentations and all participants, and it was tested on the mean motor-planning data averaged over the six presentations and the three Phase 3 participants. The test data in this additional data set were averaged across all physical-tying trials (six attempts for each knot) for the seven knots. The activation data for the time window of each knot were normalized to minimize the impact of knot difficulty on activation amplitude and to maximize the impact of the sequence pattern of activation levels. One hundred twenty voxels (as in the mental-tying analysis) were used. The occipital cortex was excluded from this analysis because of the differences in the display between the training and test conditions (the mental-tying display showed the name and image of the tied knot; the physical-tying display additionally provided a view of the participant’s hands through the use of a split-mirror system).
Results
Procedural knowledge of how to tie a particular knot can be identified from its fMRI signature
The main finding was that it was possible to accurately identify which of seven knots a participant was mentally tying from the accompanying fMRI activation patterns. Recall that the data consisted of the normalized fMRI time series from six separate images, reflecting the relative activation at successive times in the mental knot-tying procedure. Figure 2 shows the mean time courses from two of the seven knots, indicating the type of information that the classifier was using. Despite the fact that we normalized out the difficulty/amplitude difference between the two knots, their time courses are discriminable from each other.

Example of a normalized time course of activation for two knots from a single participant (data are averaged over the 120 voxels depicted in Fig. 3). Error bars indicate standard deviations across voxels.
The mean classification rank accuracy across two sessions was high (M = .70; range = .59–.79) and significantly above chance for all participants, indicating that the procedure of mentally tying each knot evokes an identifiable activation signature. Every participant’s accuracy was reliably above chance (p < .05), where the within-participants critical value was obtained by random-permutation testing (range = .59–.63). The classifier’s features were the activation levels at the six time points for the 120 most stable and discriminative voxels (720 features in total) in the cerebral cortex or cerebellum (using correlation across presentations and differences between knots of their activation time courses as measures of stability and discriminability, as described in the Method section; this feature-selection approach was used for all analyses except where noted).
The between-participants classification of the procedural neural signatures of the knot-tying procedures was not reliable (rank accuracy: M = .49), indicating a lack of commonality of the signatures across participants. This finding stands in contrast to the commonality of the neural representations of declarative concepts (e.g., Just et al., 2010). The absence of commonality of procedural neural signatures across participants may have been due to individual differences in the rate at which participants mentally tied the knots. Consistent with this account is the finding reported below that there was reliable between-participants commonality in the knot-tying signatures when the data across the six time points in the time series were averaged, which would have minimized individual differences in the rate at which the knots were mentally tied.
The neural representation of this procedural knowledge (the 120 most stable, discriminative voxels across participants) can largely be localized to several brain regions (only regions that contained at least 1 stable voxel were further analyzed; regions were taken from a set of 90 AAL regions; Tzourio-Mazoyer et al., 2002). These regions included spatial-processing regions (bilateral parietal: inferior, superior, and IPS), language and executive regions (bilateral pars triangularis, pars opercularis, superior temporal, middle and superior frontal), motor-processing regions (pre- and postcentral sulcus and supplementary motor area), visual-processing regions (occipital cortex), object-processing regions (bilateral inferior temporal and fusiform), and the cerebellum. When the classification was performed using voxels from only one of these six groupings of regions at a time (selecting 10 stable voxels from each of the 22 anatomical regions involved and then allocating them into the six groupings of regions), the mean rank accuracy across these individual anatomically defined ROIs was .61 (range = .53–.66 of participant means for the 22 ROIs; the range of the accuracies in these ROIs for individual participants was .38–.81). The highest accuracies were obtained in the left superior parietal ROI (.66), occipital lobe (.66), left IPS (.65), motor cortex (.65), right superior parietal (.63), bilateral superior frontal (.61), and cerebellum (.57). (Classification accuracies using voxels from several of these groupings are shown in Fig. 3, overlaid on the locations of 120 stable voxels from all participants; the accuracies for the 22 individual ROIs are shown in Table 1.)
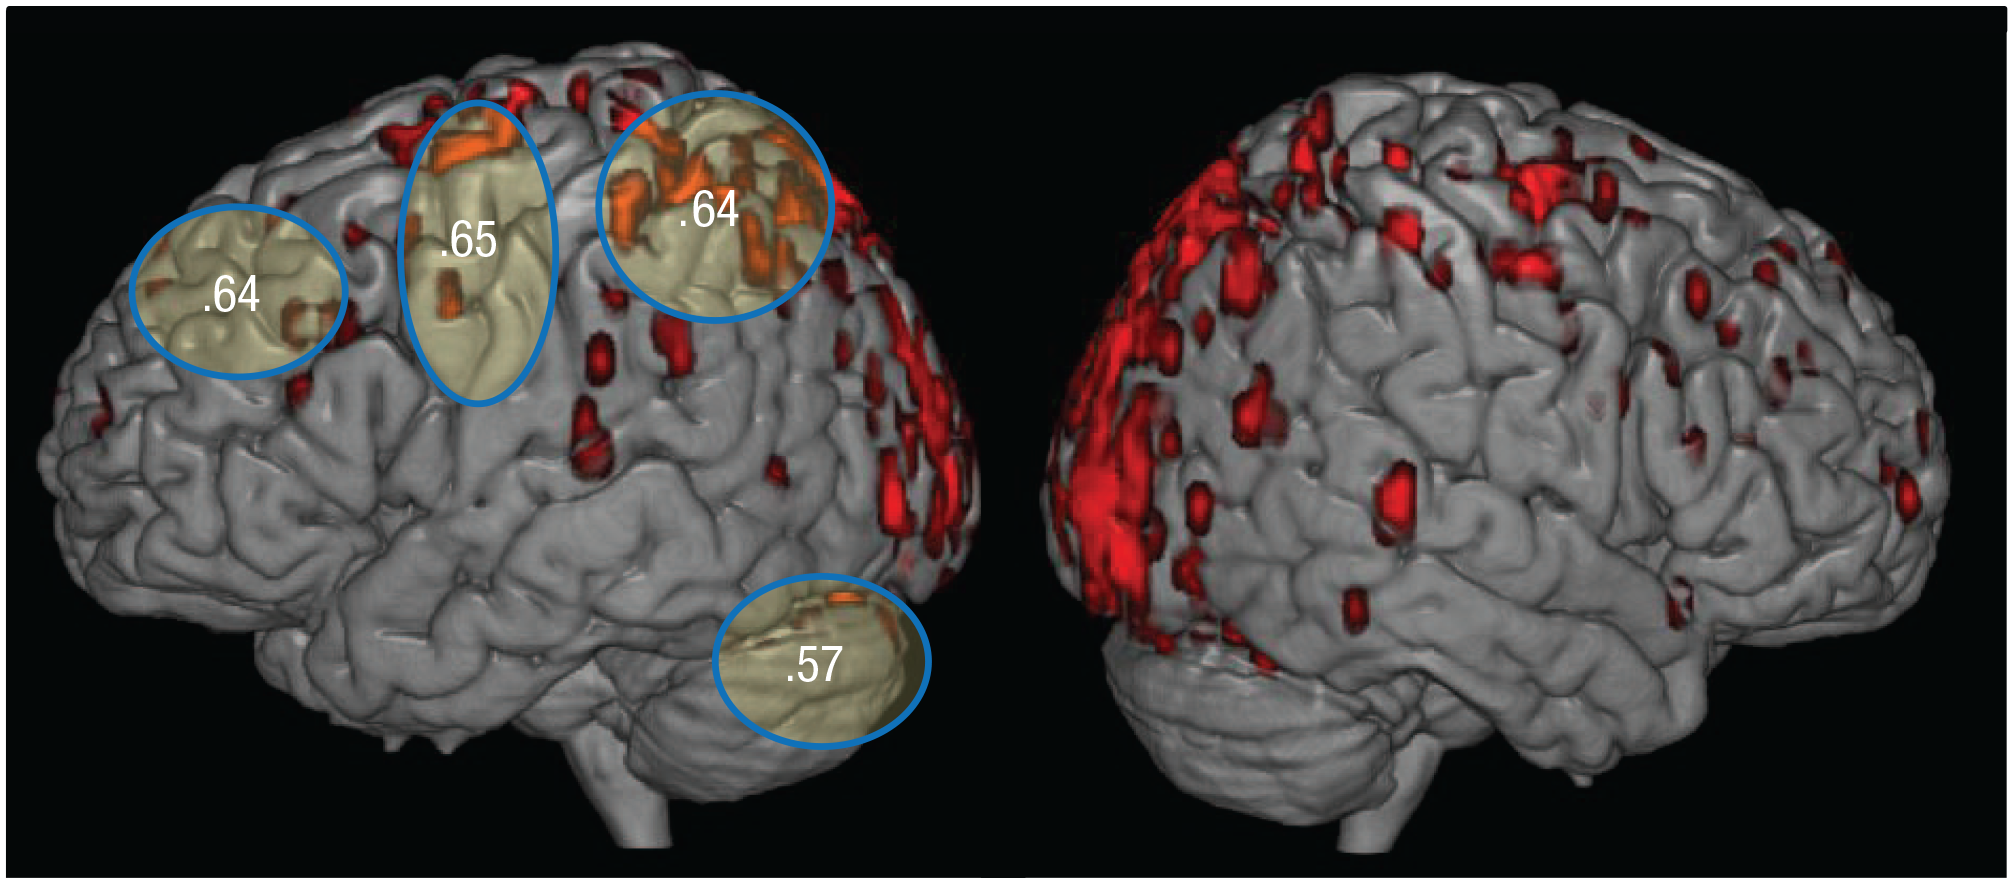
Classification accuracies for each grouping of regions, overlaid on the locations of the 120 most stable voxels (depicted in red). The ellipses indicate the areas from which the anatomical regions of interest (ROIs) were taken. The occipital (visual-processing) and inferior temporal (object-processing) groupings are not depicted. Classification accuracies were calculated using 10 voxels from each of several anatomical ROIs within each region. Accuracies correspond to bilateral groupings but are depicted only on the left hemisphere.
The 22 Regions of Interests (ROIs) Significantly Above Chance Rank Accuracy

These rank accuracies are also reported in Figure 3.
The knot-tying procedures were reliably identifiable even without recourse to information in occipital cortex (which may have contained a visual representation of the probe stimulus knot) or motor cortex. These findings indicate that multiple regions contained the procedural information, but their individual accuracy was typically and unsurprisingly less than their conjoint accuracy. This provides an indicator of the multilocus, network representation of the procedural knowledge.
Signal intensity and amplitude-based classification
To determine whether there was a commonality of the signal-intensity-based neural representation of the knot tying across participants, we trained a classifier on the data of all but 1 participant in both mental-tying sessions and then tested it on the data of the left-out participant. The mean rank accuracy across participants was .87 (range = .69–1.00), excluding occipital cortex voxels to minimize the possibility that the classifier was simply using visual features of the knot and the picture to distinguish the knot trials (M = .88, range = .79–.95 when occipital voxels were included). As noted in the Method section, this analysis used the mean activation over the critical 5-s to 10-s window rather than the time series. Thus, there was a great deal of commonality across participants in the signal intensity of the neural representation of tying a particular knot when the speed of tying was approximately equated by averaging over the time series. This technique of averaging over the time series was used in predicting knot-tying execution from imagined knot tying (see the following section) in which speed of tying might vary across individuals in both the mental-tying and physical-tying data.
Amplitude-based classification could also be conducted in a within-participants analysis in which it would not be necessary to use the mean of the time-series data. When the fMRI time series was not normalized and hence included signal-amplitude information, the classification rank accuracy remained unchanged (using as features the 120 most stable voxels from anywhere in the cortex). The seven knots were classified with a high mean rank accuracy of .70 (range = .59–.80). This finding indicates an ability to identify knots from brain-activation data when difficulty differences are included in the signal.
The neural signature of the mental tying resembles the motor plan evoked for its physical tying
The neural signature of the mental tying of a knot, when used as training data for a classifier, allowed the classifier to identify individual knots by the neural signature of the motor plan for the physical-tying procedure, indicating the similarity between the two types of signals. A classifier trained on the neural signature of the mental tying of the knots reliably identified the planning of individual knots with a classification accuracy of .791, very significantly above chance level, indicating the similarity between the two types of neural representations. The motor-planning data, acquired before the participant started any hand movements (offset by the hemodynamic delay interval), did not contain any motor-action information. Thus, the motor plan for tying a particular knot can be identified from its fMRI signature obtained during mental tying.
Discussion
This study reveals that the procedural knowledge of how to tie a particular knot has a distinct, identifiable neural signature. Although a few previous studies have shown that motor movements (Bednark, Campbell, & Cunnington, 2015; Graydon, Friston, Thomas, Brooks, & Menon, 2005; Kim, Ogawa, Lv, Schweighofer, & Imamizu, 2015; Penhune, 2013; Pilgramm et al., 2016; Wiestler & Diedrichsen, 2013; Wurm & Lingnau, 2015) and stimulus–response rules (Apšvalka, Cross, & Ramsey, 2018; Woolgar et al., 2011) can be identified from their neural representations, there has not been a previous demonstration of the neural identifiability of complex procedures. This decoding of procedures uses the same approach as has been successfully applied to other nonprocedural representations, such as those of concrete object concepts (Just et al., 2010; Mitchell et al., 2008), scientific concepts (Mason & Just, 2015, 2016), emotion concepts (Kassam, Markey, Cherkassky, Loewenstein, & Just, 2013), and perceptual representations (Huth et al., 2012).
Despite the fact that the vocabulary of motor steps for tying the seven knots was similar across the knots, it was still possible to identify the unique procedural knowledge signature across time for each knot by applying a machine-learning algorithm to the multivoxel time-series activation patterns. Presumably, the order of the steps affects how each one is executed, imbuing the activation pattern with a unique knot signature.
Procedural representations organize a sequence of actions
The most general implication of this study is that there are procedural representations that organize a sequence of actions, as proposed in the classic work, “The Problem of Serial Order in Behavior” (Lashley, 1951). Lashley argued that because of timing considerations, a sequence of steps in a procedure has to be organized within a mental structure that is larger than a simple linkage from one step to the next. He argued that serial order in behavior is supported by higher-level mental structures that organize a sequence. The current study assessed this higher-order structure in terms of its neural implementation and found that it uniquely identifies each knot. This higher-order structure manifested itself as an activation pattern distributed across several cortical regions and the cerebellum. This temporally distributed activation pattern is evoked as a motor plan prior to the execution of motor actions. It was possible to demonstrate that the planning of physically tying a knot consists of retrieving a knot-tying motor plan that resembles the neural signature of mental knot tying. Here, the neurocognitive representation of a procedure consisted of a sequence of motor actions and states. However, procedural tasks can be conceptual, as in the case of solving algebra problems or computer programming. In future research, neural representations of conceptual steps (and their planning) can be compared with motor steps to explore the possibility of neural representations of procedures at a more general or abstract level.
Brain locations of knot-tying procedural representations
It is notable that the neural signature of a knot-tying procedure was distributed across several brain regions. Likely roles include a mental visualization of the knot at a given state of its being tied (presumably supported by parietal regions specialized for spatial representations) and a motor plan for performing the next move (presumably supported by motor cortex and the cerebellum), but there may be overlap in the processes and the various cortical regions (Apšvalka et al., 2018; Graydon et al., 2005; Ito, 2008; Kim et al., 2015; Oosterhof, Tipper, & Downing, 2012; Wurm & Lingnau, 2015).
Identification of procedural representations for brain–computer interfaces
These findings suggest the possibility of neurally distinguishing complex sequences. Decoding of procedural representations can be useful in future developments of brain–computer interfaces for robotic control, having already been used to decode handedness of motion (Min, Marzelli, & Yoo, 2010) and to distinguish between mental and auditory imagery associated with a movement (Yoo et al., 2007). Direction, types of hand movements, and tool use are also classifiable procedures (Handjaras et al., 2015), as was the intention to make a simple hand movement (Gallivan, McLean, Valyear, Pettypiece, & Culham, 2011). Here, the mental activity of thinking about tying a specific knot and the motor plan preceding physical-tying trials were identified and could potentially be used as input to a robotic device. Practical use is still limited because of the need for an fMRI scanner, but the findings indicate the possibility of using noninvasively assessed neural representations of procedures to control a robotic system.
Future extensions
This research represents an early stage of a programmatic investigation of the neural representations of complex procedural knowledge. The ability to identify a motor-plan stage in the fMRI signal is related to Lashley’s (1951) hypothesis that a motor plan is generated before movement rather than being serially constructed. This is a first step toward using fMRI to characterize the cognitive and neural components of procedural skills. The decomposition of procedural concepts should be enabled by studying various combinations of the subprocesses and individual movements involved.
Supplemental Material
Mason_Supplemental_Material_rev – Supplemental material for Neural Representations of Procedural Knowledge
Supplemental material, Mason_Supplemental_Material_rev for Neural Representations of Procedural Knowledge by Robert A. Mason and Marcel Adam Just in Psychological Science
Footnotes
Acknowledgements
We thank Zach Anderson and Robert Vargas for assistance in recording training videos, testing participants, running experiments, and data processing.
Transparency
Action Editor: John Jonides
Editor: D. Stephen Lindsay
Author Contributions
R. A. Mason and M. A. Just contributed equally to all aspects of this project. Both authors wrote the manuscript and approved the final version for publication.
References
Supplementary Material
Please find the following supplemental material available below.
For Open Access articles published under a Creative Commons License, all supplemental material carries the same license as the article it is associated with.
For non-Open Access articles published, all supplemental material carries a non-exclusive license, and permission requests for re-use of supplemental material or any part of supplemental material shall be sent directly to the copyright owner as specified in the copyright notice associated with the article.