
Abstract
Across seven studies (combined N = 5,484), we demonstrated that confidence in one’s judgments decreases over a series of quantitative estimates. This finding was robust to various methods of confidence elicitation, the presence of incentives, and different estimation topics (Studies 1, 2, and 4). Our results also stand in contrast to participant expectations (Study 3). The phenomenon does not appear to be driven by fatigue, lack of effort, or various explanations based on incorporating uncertainty from prior judgments into subsequent ones. Our findings suggest that rather than evaluating confidence in isolation, participants evaluate confidence in reference to their stated confidence on earlier judgments. We theorize that confidence in earlier judgments increases in hindsight because of biased forgetting of disconfirming evidence. As a result, confidence in subsequent judgments appears to be comparatively lower (preregistered Studies 5–7). We discuss the implications for confidence research and consumer, organizational, and policy decision-making.
Keywords
Although the literature on confidence in judgment is vast, few studies have examined how confidence changes over time. Yet many highly consequential situations feature repeated judgments. In the course of a day, a financial analyst may evaluate a series of investments, a doctor may diagnose a series of patients, and a recruiter may review a series of résumés. Importantly, each individual judgment commands its own level of confidence, which influences decision-making. For example, a doctor is more likely to prescribe treatment when highly confident in a diagnosis than when less so.
In this article, we document and explore a systematic decline in confidence when individuals make a series of judgments. Because confidence in a particular judgment should be a function of the features of that judgment and the information in one’s possession, it should not exhibit systematic time trends. Indeed, lay intuition holds that confidence should increase over time (examined in Study 3).
Many studies show that individuals are overconfident in multiple domains (Fischhoff, Slovic, & Lichtenstein, 1977; Mannes & Moore, 2013; Prims & Moore, 2017; Soll & Klayman, 2004). Unjustified confidence in one’s judgments, sometimes referred to as “overprecision” (Moore & Healy, 2008), is remarkably robust to debiasing (Moore, Tenney, & Haran, 2015).
Most research has focused on confidence judgments in the aggregate, implicitly assuming that the findings apply equally to individual trials. The small body of work examining confidence over time has found mixed results. Specifically, Sanchez and Dunning (2018) showed that for novel, multicue probabilistic learning tasks (e.g., diagnosing a zombie disease), participants’ confidence grew more rapidly than accuracy, a pattern they termed the “beginner’s bubble” (p. 10). Conversely, Pulford and Colman (1997) reported a decline in overconfidence throughout a series of difficult trivia questions. They speculated that the decline was due to participants’ ability to self-monitor performance.
Our results are consistent with those of Pulford and Colman (1997). However, after testing several versions of what they may have meant by “self-monitoring,” we posit a more concrete explanation. Specifically, we suggest that confidence in subsequent estimates decreases because confidence in prior estimates increases in retrospect.
Contextual Confidence and Postdecision Processing
Prior research suggests that “confidence evolves during the course of the decision process” (Baranski & Petrusic, 1998, p. 942). Broadly, after people make a decision, information distortion and motivated reasoning continue, consolidating preferences and alleviating dissonance (Arkes & Blumer, 1985; Festinger, 1964, p. 31; Festinger & Carlsmith, 1959; Lerner & Tetlock, 1999; Svenson, Rayo, Andersen, Sandberg, & Svahlin, 1994). The literature on confirmation bias argues that people selectively seek and process information that supports their hypotheses (Kunda, 1990; Nickerson, 1998). Most relevantly, people demonstrate biased recall, disproportionately retaining arguments that support prior beliefs and forgetting ones that do not (Kunda, 1990).
Research on perceptual tasks has confirmed that confidence elicited after a decision is partly determined by postdecisional computation processes (Baranski & Petrusic, 1998). However, research examining both perceptual tasks and more cognitively complex assessments diverges over whether the continued collection of evidence is unbiased, leading to improved calibration (Moran, Teodorescu, & Usher, 2015; Yu, Pleskac, & Zeigenfuse, 2015), or biased in favor of the prior choice (Zylberberg, Barttfeld, & Sigman, 2012). Whereas prior research has examined the time interval between multiple confidence ratings concerning a single judgment, we examined the time intervals between confidence ratings regarding two different judgments.
Our theory is made up of two components. First, confidence is inflated in retrospect. When participants have to assess their confidence in a prior judgment, they do not go over the entire process of deliberation but rely primarily on the gist of that process (Stephen & Pham, 2008). We hypothesized that once participants have made a judgment, stated their confidence, and moved on to the next item, they have little reason to hold in memory the evidence supporting or contradicting their earlier assessment. If the supporting information is retained better than the contradictory information, in line with findings of prior research, then when participants recall their prior confidence, this gist information is shifted toward greater certainty.
Second, our theory leverages the influence of reference points and comparisons, common in classic research on sensory perception (Di Lollo, 1964; Helson, 1964; Krantz & Campbell, 1961). Indeed, reference dependence has been employed to explain perceptions of value (Kahneman & Tversky, 1979) and the effects of anchors on judgments regarding seemingly objective quantities (Frederick & Mochon, 2012). Here, we suggest that in determining their present confidence, individuals recall their stated confidence on a recent judgment and compare how they feel about the current judgment to how they feel (currently) about the reference judgment. Because of biased recall, prior judgments appear more certain in retrospect, making later judgments appear less certain. This results in the observed decline in reported confidence. We refer to this two-stage mechanism as the inflation-and-adjustment theory.
Overview of Studies
Seven studies documented the decline in reported confidence across a series of estimates. In all studies, participants made estimates regarding randomly ordered stimuli and then reported their confidence in those estimates. Studies 1 and 2 demonstrated the effect using multiple confidence-elicitation methods and incentives for truthful reporting. In Study 3, people mispredicted the effect. Study 4 tested whether the effect relies on estimates being topically related (it does not) and demonstrated this across several domains. In Study 5, we moderated the effect with task difficulty. Studies 6 and 7 tested our theory that declining confidence relies on comparing current confidence to that in prior items.
In all studies, we report how we determined our sample size and all data exclusions, manipulations, and measures. Materials, data, and code for all seven studies, as well as copies of our preregistrations for Studies 5, 6, and 7, can be found online at the Open Science Framework (https://osf.io/r3z7p/).
Study 1: Confidence Declines Over Trials
Method
In Study 1, participants estimated the weights of nine animals from photographs and stated their confidence in each estimate. We tested whether confidence decreased over the course of the task.
Participants
We collected 202 participant responses from Amazon Mechanical Turk (MTurk). After removing data from 4 participants who looked up information online and 6 participants who responded incorrectly to an attention check, we had a final sample of 192 participants (45% female; mean age = 38.5 years). 1 We paid participants $0.50 for their time. Furthermore, a single question was selected at random for each participant; if the participant’s estimate was within 10% of the correct answer, the participant received a $0.25 bonus.
Procedure
Participants estimated the weights of nine zoo animals from photos. The actual weights of the animals ranged from 6.4 to 379 pounds. The photos of the animals were presented in random order. Participants also reported how confident they were that each of their weight estimates fell within 10% of the correct answer. Participants reported confidence on a 5-point scale, from 1, not at all, to 5, very, by typing a number into a text box. Responses regarding each of the nine target animals were collected on separate web pages, enabling us to collect the time spent on each question. After completing all estimates, participants reported how many of the estimates they expected would fall within 10% of the correct answer. Participants then reported demographic information and whether they had looked up any information.
Analytical approach
On the basis of the effect sizes observed in earlier studies (see the Supplemental Material available online), we predetermined a sample size of 200 participants.
Because each participant provided observations for nine different animals, we employed a mixed-effects linear model computed using the lmer function in the lme4 package in R (Bates, Mächler, Bolker, & Walker, 2015). Our models clustered the standard errors at the level of participant and item by including random intercepts for stimulus (an animal, in this case) and random slopes and intercepts for confidence across participant.
Furthermore, because we were primarily interested in how an individual’s confidence responds to repeated questioning, rather than in individual differences in the use of the confidence scale, we z-scored confidence ratings within participants. Rescaling preserves the trend but eliminates differences in the degree of sensitivity; it also allowed comparisons between confidence ratings elicited on different scales in later studies.
Error was quantified as the absolute percentage of deviation from the true value for each item. Accuracy was a binary variable set to 1 if the estimate was within the specified criteria (10% in the present study) and to 0 otherwise.
To analyze response time data, we used a generalized linear mixed-effects regression predicting response-submission time, with a fixed effect for question order and random intercepts for participants. We utilized a gamma distribution and a logarithmic link function to account for the right-skewed distribution of submission time. Additionally, we used a log transformation of the question response time to predict confidence, error, and accuracy to further investigate the role of fatigue.
Results
Study 1 tested whether question order systematically affects subjective confidence in weight estimates. When considering all 1,728 estimates made by participants, we found that the average confidence on a 5-point scale was 2.80 (SD = 1.06). The task proved quite difficult, with only 9% of weight estimates landing within 10% of the true value. Most importantly, confidence z-scored within participants declined over the course of the task at a rate of 0.03 standard deviations per question, β = −0.03, 95% confidence interval (CI) = [−0.05, −0.02], t = −3.82, p < .001. The mean confidence declined from 2.94 on the first question to 2.76 for the ninth question (see Fig. 1).
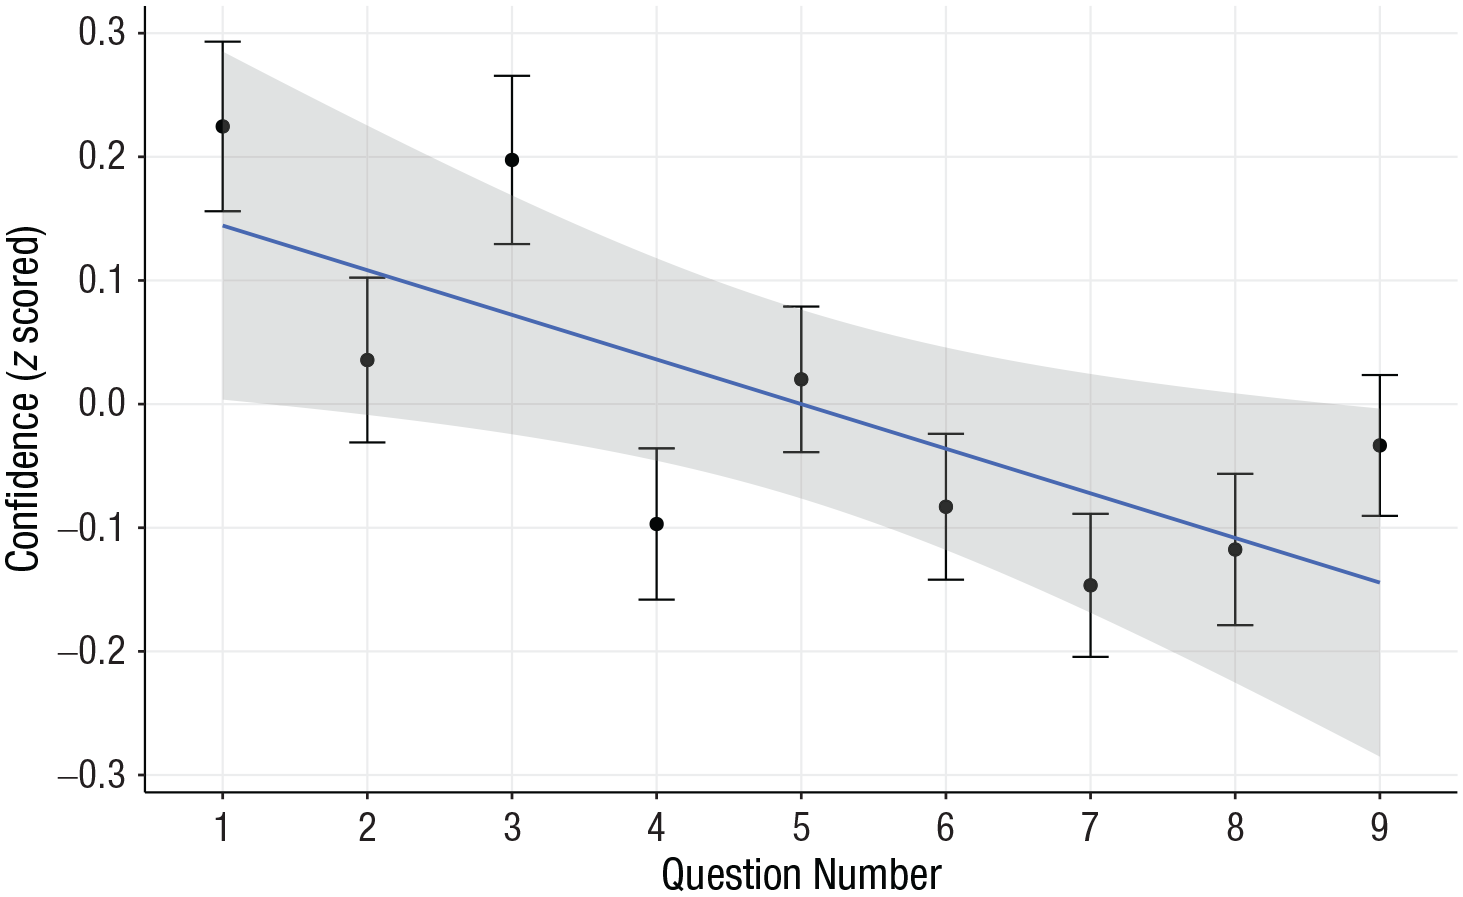
Confidence across the series of questions in Study 1. Dots indicate group means, and error bars indicate standard errors. The solid line indicates the best-fitting regression, and the shaded area represents the 95% confidence band for the regression.
Prior to examining the influence of response time, we excluded 8% of estimates (145 of 1,728) with response times in excess of 33 s (3 times the median response time); these outliers were probably the result of task interruption. The gamma regression predicting submission time using question order confirmed that time spent on each estimate declined by about 1 s with each subsequent question, b = −0.06, SE = 0.003, t = −19.44, p < .001. This could reflect either participant fatigue or participants’ growing familiarity with the task. When we examined error (operationalized as absolute deviation of the estimate from the truth as a percentage of the true value), excluding 35 estimates with an error of more than 1,000%, we observed a small but significant increase over the course of the nine estimates, b = 3.0%, SE = 1.43, t = 2.009, p = .037. The log of time did not significantly predict confidence (even when we controlled for question order), accuracy (using logistic regression), or error. We found that confidence and error were not strongly correlated (average within-participants Goodman-Kruskal gamma correlation = −.04, SD = .39). As a final robustness check, controlling for the log of response time and percentage of error did not diminish the effect of question order on z-scored confidence, β = −0.04, 95% CI = [−0.06, −0.02], t = 3.68, p < .001.
Although a 5-point confidence scale does not permit statements about the appropriateness of the expressed level of confidence, it has the advantage of being more intuitive for participants who might struggle to express their confidence as a probability. In Studies 2, 4, 5, 6, and 7, we implemented a probabilistic confidence elicitation that allowed us to examine overconfidence.
Study 2: Confidence Expressed as Probability
Method
In Study 2, we elicited confidence ratings using a 5-point Likert scale, a subjective probability rating, and the Becker-Degroot-Marschak (BDM) confidence-elicitation method (Becker, Degroot, & Marschak, 1964). The expression of confidence in terms of probability enabled us to assess calibration at the population level. The BDM procedure provides financial incentives for truthful reporting of confidence.
Participants
We obtained 606 completed survey respons-es from MTurk. After removing 29 participants who looked up information online, 11 participants who responded incorrectly to an attention check, and 4 participants with duplicate MTurk identifiers, we had a final sample of 562 participants (44% female; mean age = 36.5 years). We paid participants $0.50, with an opportunity for a $0.25 bonus. Bonus criteria differed by condition.
Procedure
We randomly assigned each participant to one of three conditions. In all conditions, the task was to estimate the weight of the same animals used in Study 1 and to indicate confidence in each estimate. The method of confidence elicitation and incentives differed by condition. In the Likert condition, participants estimated the weights of nine animals presented in random order and rated their confidence using a 5-point Likert scale, ranging from not at all to very. We incentivized accuracy by selecting a question at random and awarding a bonus if that estimate fell within 10% of the truth.
In the probability condition, participants again estimated animal weights, but we elicited confidence ratings by asking, “What is the probability that your estimate is within 10% of the actual value?” as a percentage probability between 0 and 100. The incentives for accuracy remained the same as in the Likert condition.
In the BDM condition, we altered the probability condition to provide an incentive for participants to accurately report the probability that their estimate was correct using the BDM (Becker et al., 1964) method. We informed participants that they could win an additional $0.25 either by betting that one of their estimates (chosen at random) was correct or by a lottery. Their confidence rating determined the point at which they would shift from betting on their estimate being correct to betting on the lottery with an equal or greater probability of winning, the actual odds of which had yet to be determined. For example, if they stated that they were 75% confident, they would bet on their estimate unless the lottery odds (not yet known) provided a better-than-75% chance of winning. This incentive structure disincentivizes overstating one’s confidence. Such a strategy would prevent participants from betting on lotteries that offer a better chance of winning than their true level of confidence but a lower chance of winning than their (inflated) stated level of confidence. Similarly, this incentive structure disincentivizes understating one’s confidence. Such a strategy would potentially force participants to bet on lotteries that offer a worse chance of winning than their true level of confidence.
We used a comprehension check to ensure that participants understood the BDM incentive structure. Five percent of the 220 participants assigned to the BDM condition quit after entering the survey but before providing any responses. This was consistent with the other conditions. Seventy-eight percent correctly answered the question, “What should you do if you want to maximize your chance of winning a prize?” on their first attempt (answer: “Report your best estimate and how likely you believe it is that this estimate is correct”). Ten percent answered correctly on their second attempt, but 7% of participants incorrectly answered the comprehension question on their second attempt and were dropped from the survey or quit following their first failed attempt. Losses due to screening or attrition in the instructional phase marginally increased overall attrition in the BDM condition compared with the other conditions, χ2(2, N = 660) = 4.77, p = .092.
After completing all estimates, participants reported how many of the estimates they expected would fall within the 10% window and were given a chance to provide more information about their estimation process via a free text response. Participants then reported demographic information and whether they had looked up any information online.
Analytical approach
A target sample size of 200 participants per cell was predetermined on the basis of observed effect sizes in prior studies. The statistical approach remained the same as in Study 1.
Results
Summary statistics for all three conditions are presented in Table 1. In all conditions, we again observed the main effect of decreasing confidence with subsequent questions (Table 2, Fig. 2). Although a decline in confidence of 0.5% per question may seem small, over the course of 10 questions, this results in a 5% decline in confidence without an apparent normative explanation. The interaction between question order and condition was not significant, demonstrating that the decline in confidence is robust to variations in elicitation scale and incentives for accurate reporting of confidence.
Summary Statistics for Study 2
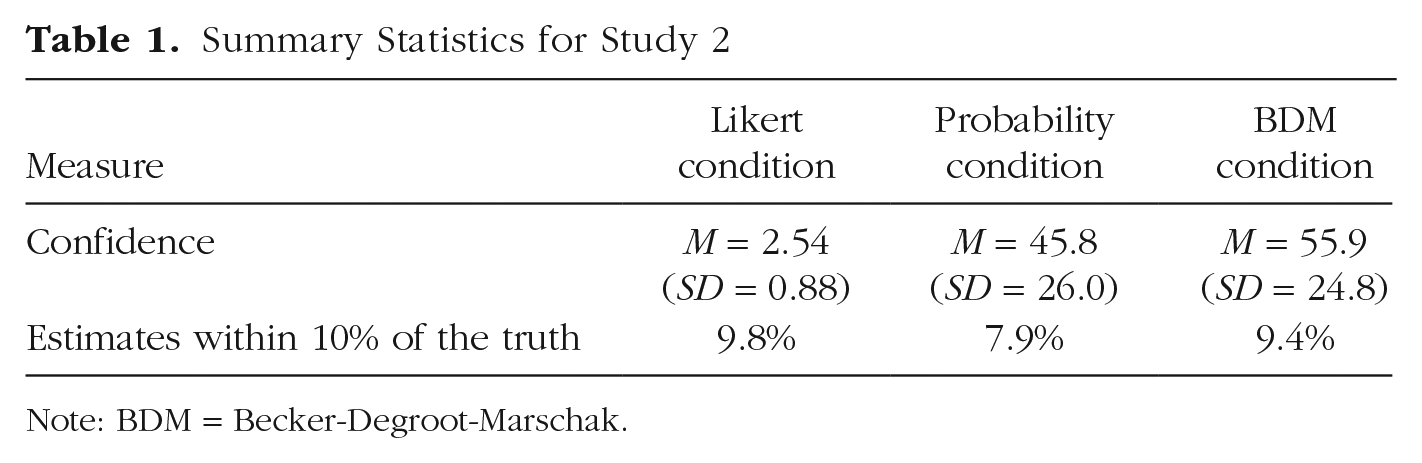
Note: BDM = Becker-Degroot-Marschak.
Regression Results for Study 2
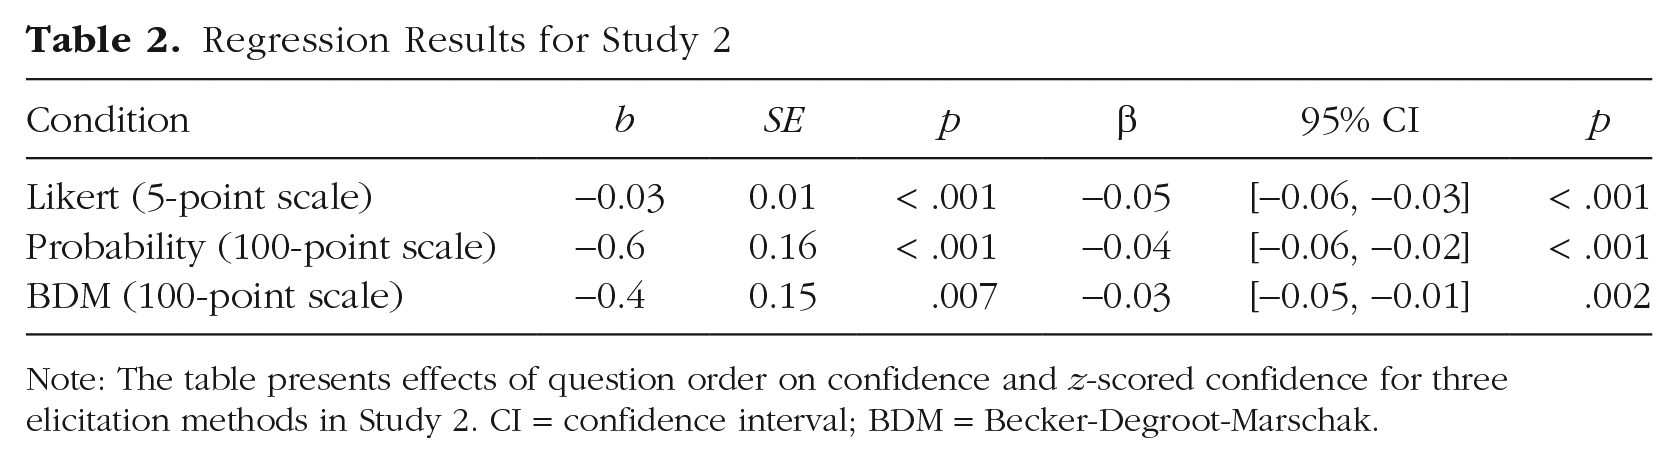
Note: The table presents effects of question order on confidence and z-scored confidence for three elicitation methods in Study 2. CI = confidence interval; BDM = Becker-Degroot-Marschak.

Confidence across the series of questions in each of the three conditions of Study 2. Dots indicate group means, and error bars indicate standard errors. The solid lines indicate the best-fitting regressions, and the shaded areas represent the 95% confidence bands for the regressions. BDM = Becker-Degroot-Marschak.
Prior to examining the influence of response time, we excluded 6% of estimates (348 of 5,058) with response times in excess of 33 s (3 times the median response time); these outliers were probably the result of task interruption. Time spent on each estimate declined with each subsequent question, gamma regression b = −0.06, SE = 0.002, t = −31.84, p < .001, and response time significantly predicted confidence when we controlled for participant and stimulus, increasing 1.5% for each additional log (second) spent, b = 1.5, SE = 0.56, t = 2.60, p = .009. When we examined error over the course of the nine items, excluding 105 estimates with an error of more than 1,000%, we did not observe any systematic change over the course of the task in any of the three conditions or overall. Collapsing across condition and controlling for the log of response time and percentage of error did not diminish the effect of question order on z-scored confidence, β = −0.04, 95% CI = [−0.05, −0.03], t = −7.94, p < .001.
Mean confidence ratings and accuracy levels for each question by condition are presented in Figure 3. Overconfidence can be computed by comparing mean confidence levels expressed on a probability scale with the accuracy achieved by all participants in a given condition for each question. This measure revealed substantial overprecision (about 45%), though calibration improved slightly with subsequent questions because of the decline in confidence.
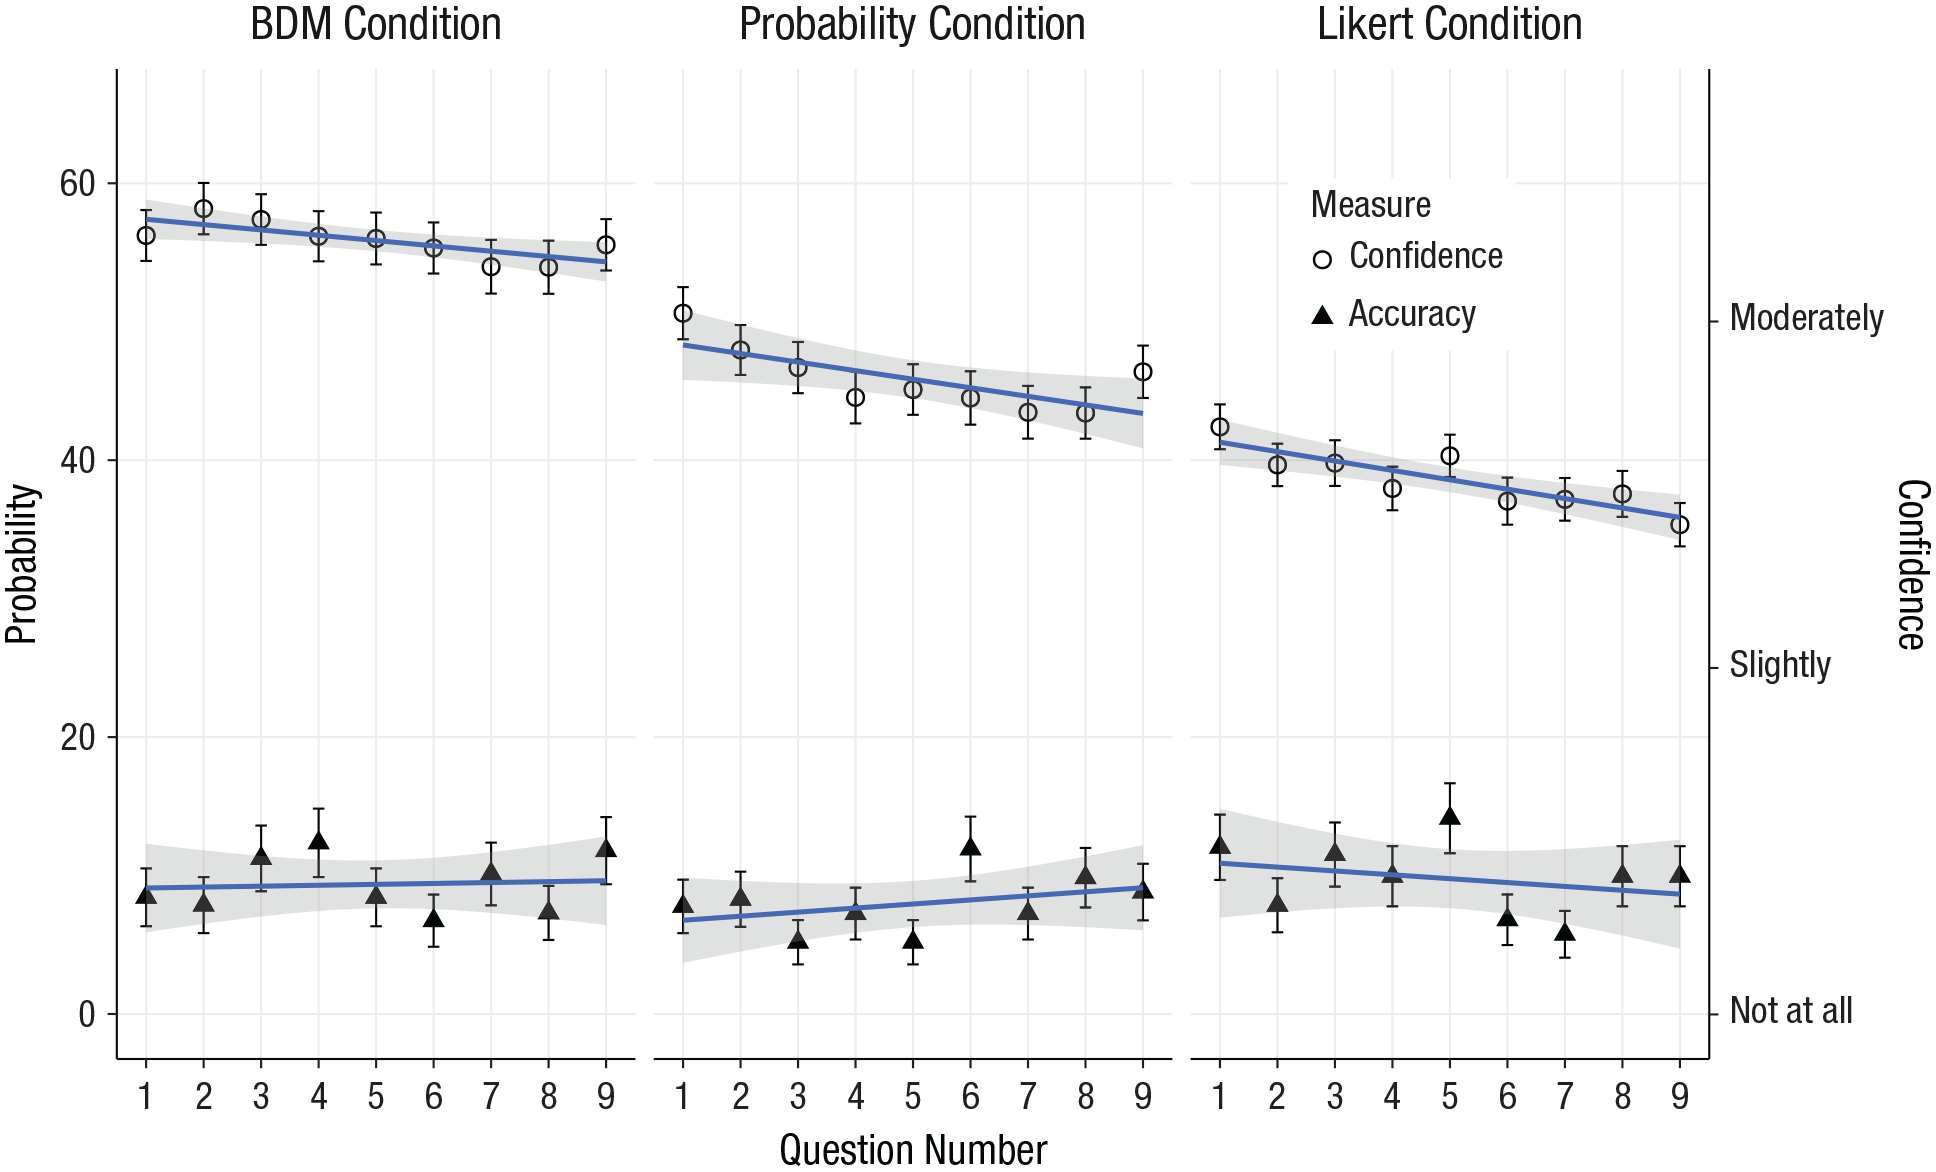
Mean confidence rating (right-hand y-axis) and aggregate accuracy (left-hand y-axis) across the series of questions in each of the three conditions of Study 2. The Likert results are rescaled to approximate a probabilistic scale for the purposes of illustration, but a comparison of confidence with accuracy is not possible, strictly speaking. Dots indicate group means, and error bars indicate standard errors. The solid lines indicate the best-fitting regressions, and the shaded areas represent the 95% confidence bands for the regressions. BDM = Becker-Degroot-Marschak.
In summary, Study 2 demonstrated that our effect was robust to confidence elicitation on probability scales and when participants were given financial incentives for accurate reporting of confidence.
Study 3: Forecasting Confidence
Method
In Study 3, we examined lay beliefs regarding changes in confidence over a series of estimates. We did this by comparing participants’ beliefs about how their confidence would change (if at all) with actual estimates and confidence ratings provided by another sample.
Participants
We collected 403 completed survey responses from MTurk. After removing 5 participants who looked up information online, 5 who failed an attention check, and 2 with the same MTurk ID, we had a final sample of 391 participants (55% female; mean age = 35.9 years). Incentive and bonus procedures were the same as in Study 1.
Procedure
We randomly assigned each participant to one of two conditions. In the control condition, participants estimated the weights of five zoo animals (a subset of the stimuli used in Study 1) and reported their confidence for each estimate using a 5-point Likert scale. In the forecast condition, participants completed one randomly selected weight estimate and confidence assessment before being asked to imagine completing four more estimates of similar difficulty. Participants reported how confident they expected to be in the hypothetical fifth estimate (using the same 5-point scale) and whether they expected their confidence to increase, decrease, or remain the same across the series of estimates. We also asked participants to provide a written justification for their answer. Participants then reported demographic information and were given an opportunity to report cheating before being presented with results for a single randomly selected question for bonus-payment purposes.
Analytical approach
A sample size of 200 participants per cell was predetermined, and the statistical approach remained the same as in Study 1.
Results
When considering all 1,965 estimates made by participants, we found that the average reported confidence on a 5-point scale was 2.63, SD = 0.89; performance remained poor, with a success rate of 7%. In the forecast condition, a paired-samples t test revealed that participants forecasted a significantly higher level of confidence for the hypothetical fifth question than they reported for the estimate they actually provided (mean difference = 0.14, 95% CI = [0.04, 0.24]), t = 2.76, p = .006, Cohen’s d = 0.16, 95% CI = [0.04, 0.28]. When asked explicitly how they thought their confidence would respond to a series of questions of similar difficulty, only 12% reported that they expected confidence to decline; 51% predicted no change, and 37% predicted an increase in confidence.
Consistent with prior findings, results in the control condition showed a significant decline in confidence z-scored within participants, β = −20.07, 95% CI = [−0.11, −0.02], t = −3.07, p = .002. Thus, the vast majority of participants did not accurately anticipate the observed decline, and many predicted the opposite, interaction b = −0.08, SE = 0.019, t = −4.21, p < .001 (see Fig. 4).

Confidence across the series of questions in each of the two conditions of Study 3. Dots indicate group means, and error bars indicate standard errors. The solid lines indicate the best-fitting regressions, and the shaded areas represent the 95% confidence bands for the regressions.
Study 4: Multi-Domain Estimates
Method
In Study 4, we manipulated whether the stimuli used to elicit a series of estimates were related (as in prior studies) or drawn from several different topic domains. This manipulation allowed us to test two possible explanations for the decline. First, participants might derive their later estimates by adjusting an uncertain amount from a prior (also uncertain) estimate. Participants might recognize that this method would cause error to accumulate from estimate to estimate and therefore reduce their confidence for later estimates. By eliciting estimates from variety of domains (e.g., weights, calories, temperatures), we ensured that later estimates were not being derived from earlier estimates. If the decline in confidence persisted, we could conclude that it is unlikely to be due to a feeling that errors were adding up from one item to another.
Second, repeated estimation in the same domain may impact confidence by leading individuals to identify previously unrecognized holes in their knowledge (Fernbach, Rogers, Fox, & Sloman, 2013; Rozenblit & Keil, 2002). This is one plausible interpretation of what Pulford and Coleman (1997) meant by “self-monitoring.” Eliciting estimates from unrelated domains should reduce or eliminate the decline in confidence if it is driven by the realization that participants are less knowledgeable than they initially believed.
Participants
We recruited 900 participants from MTurk and obtained 910 complete responses. After removing 10 participants who looked up information online and 19 participants who answered an attention question incorrectly, we had a final sample of 881 participants (57% female; mean age = 35.7 years). We paid participants $0.50 for their study participation. Furthermore, we awarded a $0.50 bonus for highly accurate judgments.
Procedure
We randomly assigned each participant to one of six conditions. In five of the conditions, we asked participants to make four estimates in the same domain, similar to those used in previous studies (i.e., number of candies in a jar, weights of animals, calories in foods, weights of people, and temperatures in cities). In the sixth condition, the mixed condition, participants made one estimate from each of these five domains. In all conditions, we randomized the order in which we presented the stimuli.
In the M&M condition, participants saw photos of four jars of multicolored M&Ms. For each jar, participants estimated the number of a specified color of M&Ms (brown, green, red, and yellow). The animals condition was the same as in Study 1, but with just four animals (wildcat, weasel, deer, and monkey). In the food condition, participants estimated the calorie counts of four snack foods (jelly beans, raisins, pretzels, and sunflower seeds) on the basis of a description of the serving size and weight of each food (e.g., Jelly Beans, 35 pieces, 40 grams). In the people condition, participants estimated the weights of four people (range = 130−195 pounds) on the basis of full-length photos. The weather condition required participants to estimate the noon temperatures in four major U.S. cities (New York, San Francisco, Denver, and Omaha) 1 week into the future.
In all conditions, participants used a 5-point Likert scale to report their confidence that each of their estimates was within 10% of the correct answer. At the end of the survey, participants reported demographic information and whether they had looked up any information online during the study. On the basis of the effect sizes observed in prior studies, we predetermined a sample size of 150 participants per cell.
Results
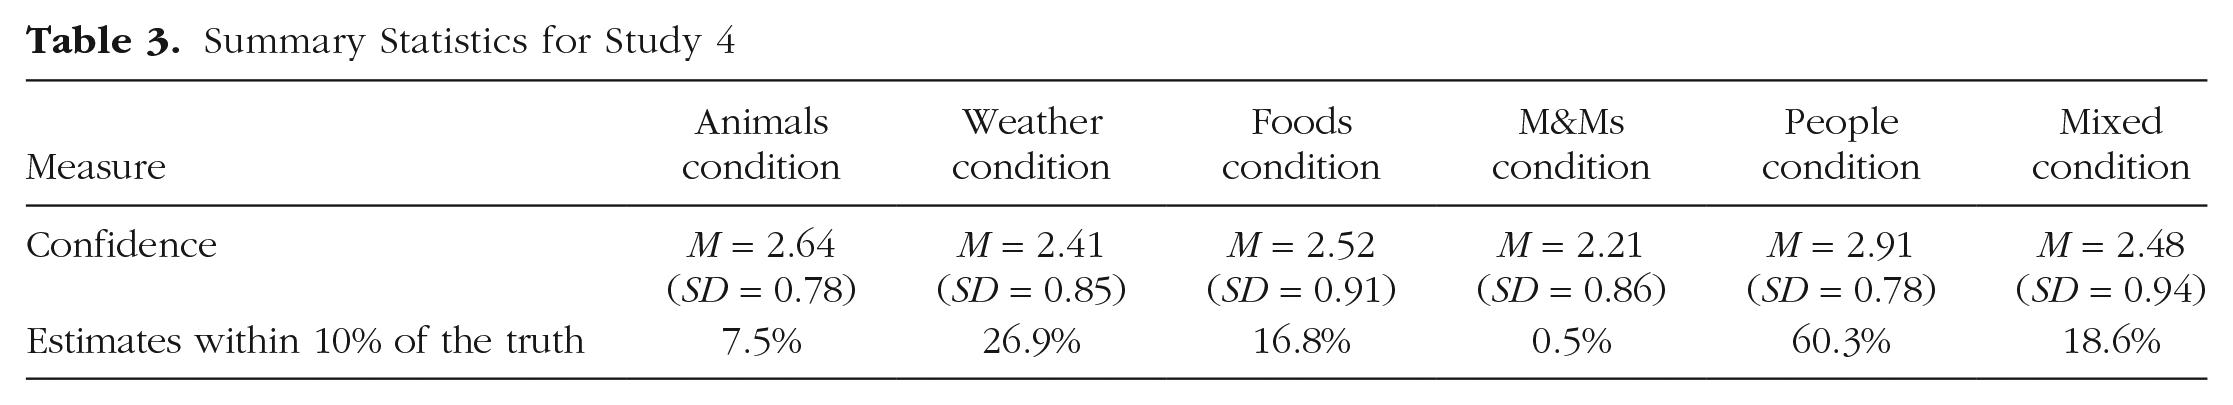
When considering all 3,671 forecasts and estimates made by participants, we found that the average confidence on a 5-point scale was 2.53, SD = 0.88. The percentage of estimates that met the 10% accuracy criterion varied from 0.5% to 60% per condition (see Table 3). As predicted, there was a statistically significant linear decrease in z-scored confidence (and unstandardized confidence) in each of the unmixed categories (see Table 4 and Fig. 5). Importantly, the mixed condition also showed evidence of declining confidence. The decrease in confidence did not significantly differ between conditions.
Summary Statistics for Study 4
Regression Results for Study 4
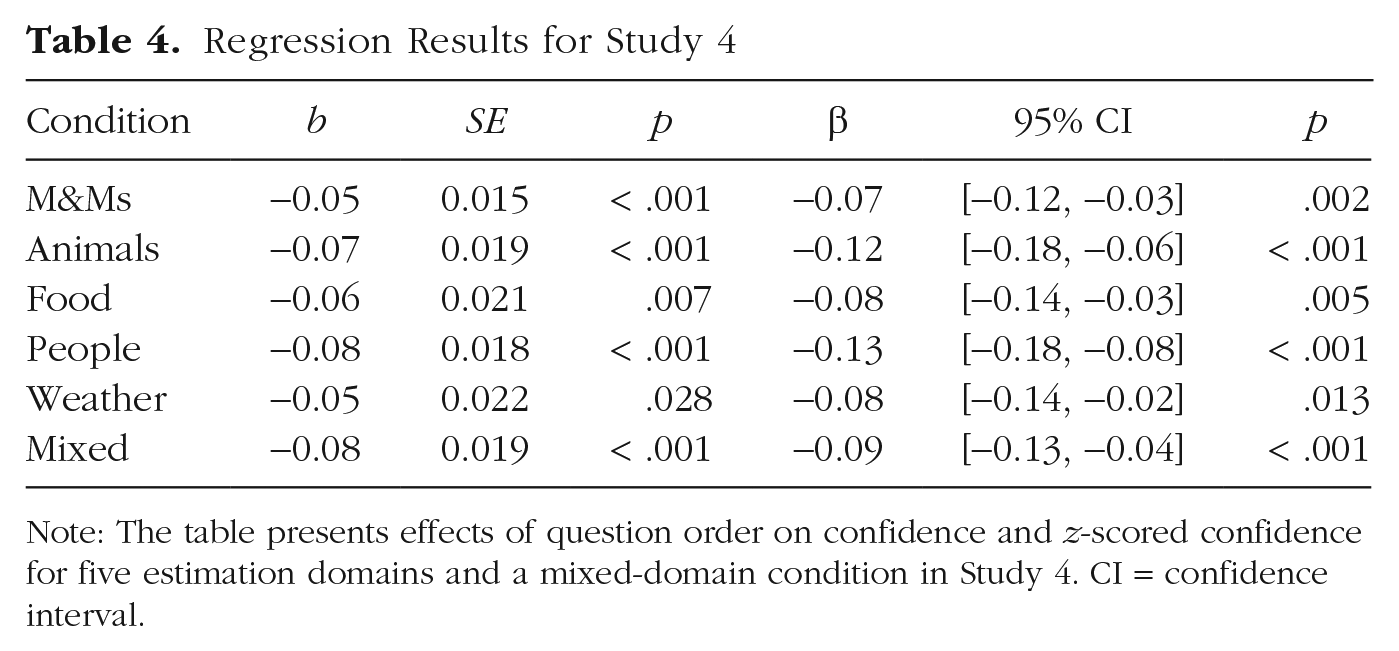
Note: The table presents effects of question order on confidence and z-scored confidence for five estimation domains and a mixed-domain condition in Study 4. CI = confidence interval.

Confidence across the series of questions in each of the six conditions of Study 4. Dots indicate group means, and error bars indicate standard errors. The solid lines indicate the best-fitting regressions, and the shaded areas represent the 95% confidence bands for the regressions.
When we examined error over the course of the task, after excluding 11 estimates with errors more than 5 standard deviations above the mean error, we did not observe any systematic changes. Collapsing across condition and controlling for percentage of error did not diminish the effect of question order on z-scored confidence, β = −0.09, 95% CI = [−0.12, −0.07], t = −8.56, p < .001.
The persistence of the decline in the mixed condition suggests that it was not driven by participants’ feeling that errors from earlier estimates are somehow accumulating on later estimates. It also makes it less likely that the key to the effect was participants’ recognition of the limitation of their knowledge in any one domain. However, it is not clear to what degree participants recognized that the estimates in the mixed condition were truly independent tasks. It is still possible that participants were learning that they were poor at estimation tasks in general, topic notwithstanding.
Study 5: Easy Versus Hard Tasks
In Study 5, we manipulated question difficulty. On easy estimation items, participants are likely to identify fewer reasons why their estimate might be incorrect. Thus, according to our theorizing, when they move on to a subsequent estimate, they will have fewer conflicting cognitions to forget and will experience a lesser (or no) change in confidence. This suggests that a series of easy estimation questions should show an attenuated decline in confidence. On the other hand, people tend to be overconfident on difficult tasks and underconfident on easy ones (e.g., Moore & Small, 2007). Thus, if learning about the task accounts for the confidence change, gradually learning that the task is easy should lead to increased confidence.
Method
Participants
We recruited 700 participants from MTurk and collected 692 completed responses after excluding responses with duplicate respondent IDs. In accordance with our preregistration, we excluded 16 participants who failed an attention check. We excluded an additional 58 participants who missed a later comprehension check. The rate of attrition did not differ between conditions, χ2(2, N = 676) < 0.001, p = 1.00. Our final sample consisted of 618 participants (56% female; mean age = 36.0 years). Incentive and bonus procedures were the same as in Study 1 except that the bonus criteria varied by condition as described below.
Procedure
We randomly assigned each participant to one of two estimate-difficulty levels. In both conditions, we showed participants photos of a glass container filled with six different colors of M&M candies. We asked participants to estimate the number of each color of candy in the container. The order of the questions (which color was being asked about) was randomized. In the hard condition, the required tolerance for a “correct” answer was plus or minus 10 candies. In the easy condition, the tolerance was plus or minus 60 candies. Participants were asked to make six estimates (the number of red, blue, yellow, green, brown, and orange M&Ms) in random order and to report their confidence in the accuracy of each estimate.
After participants submitted each estimate, we showed them their answer as well as the calculated range for the true value that would allow their answer to count as correct. For example: “Your estimate (85) is within 60 of the actual value and your answer will be judged as correct
Following the six estimates, we collected demographic information. We also asked participants to estimate how many questions they had answered correctly. Finally, we used the experimental software to give them feedback on their total score and a randomly selected result for bonus-payment purposes.
Analytical approach
A minimum postexclusion sample size of 300 participants per cell was predetermined using power simulations from pilot data. The statistical approach remained the same as in Study 1.
Results
Both confidence and accuracy were higher in the easy condition, M = 69.5%, SD = 22.0%, accuracy (within 60) = 81.3%, than in the hard condition, M = 50.8%, SD = 22.7%, accuracy (within 10) = 10.5%—confidence: t = 10.39, p < .001; accuracy: t = 34.14, p < .001—confirming that our manipulation of task difficulty was successful. Comparing average confidence and accuracy by condition, we found that participants were overconfident in the hard condition, t = 22.71, p < .001, and underconfident in the easy condition, t = 6.28, p < .001, replicating the well-known easy-hard effect (Lichtenstein & Fischhoff, 1977; Lichtenstein, Fischhoff, & Phillips, 1982; Moore & Small, 2007).
In the hard condition, we observed the main effect of decreasing z-scored confidence, β = −0.06, 95% CI = [−0.08, −0.03], t = 4.18, p < .001. In the easy condition, confidence did not significantly decline, β = −0.02, 95% CI = [−0.04, 0.01], t = 1.23, p = .221. As predicted, the interaction between question order and condition was significant, β = −0.04, 95% CI = [−0.08, −0.002], t = 2.05, p = .041 (see Fig. 6). Importantly, this result is distinct from the easy-hard effect because it demonstrates the impact of task difficulty not on calibration overall or on an isolated judgment but on the dynamics of confidence in context.
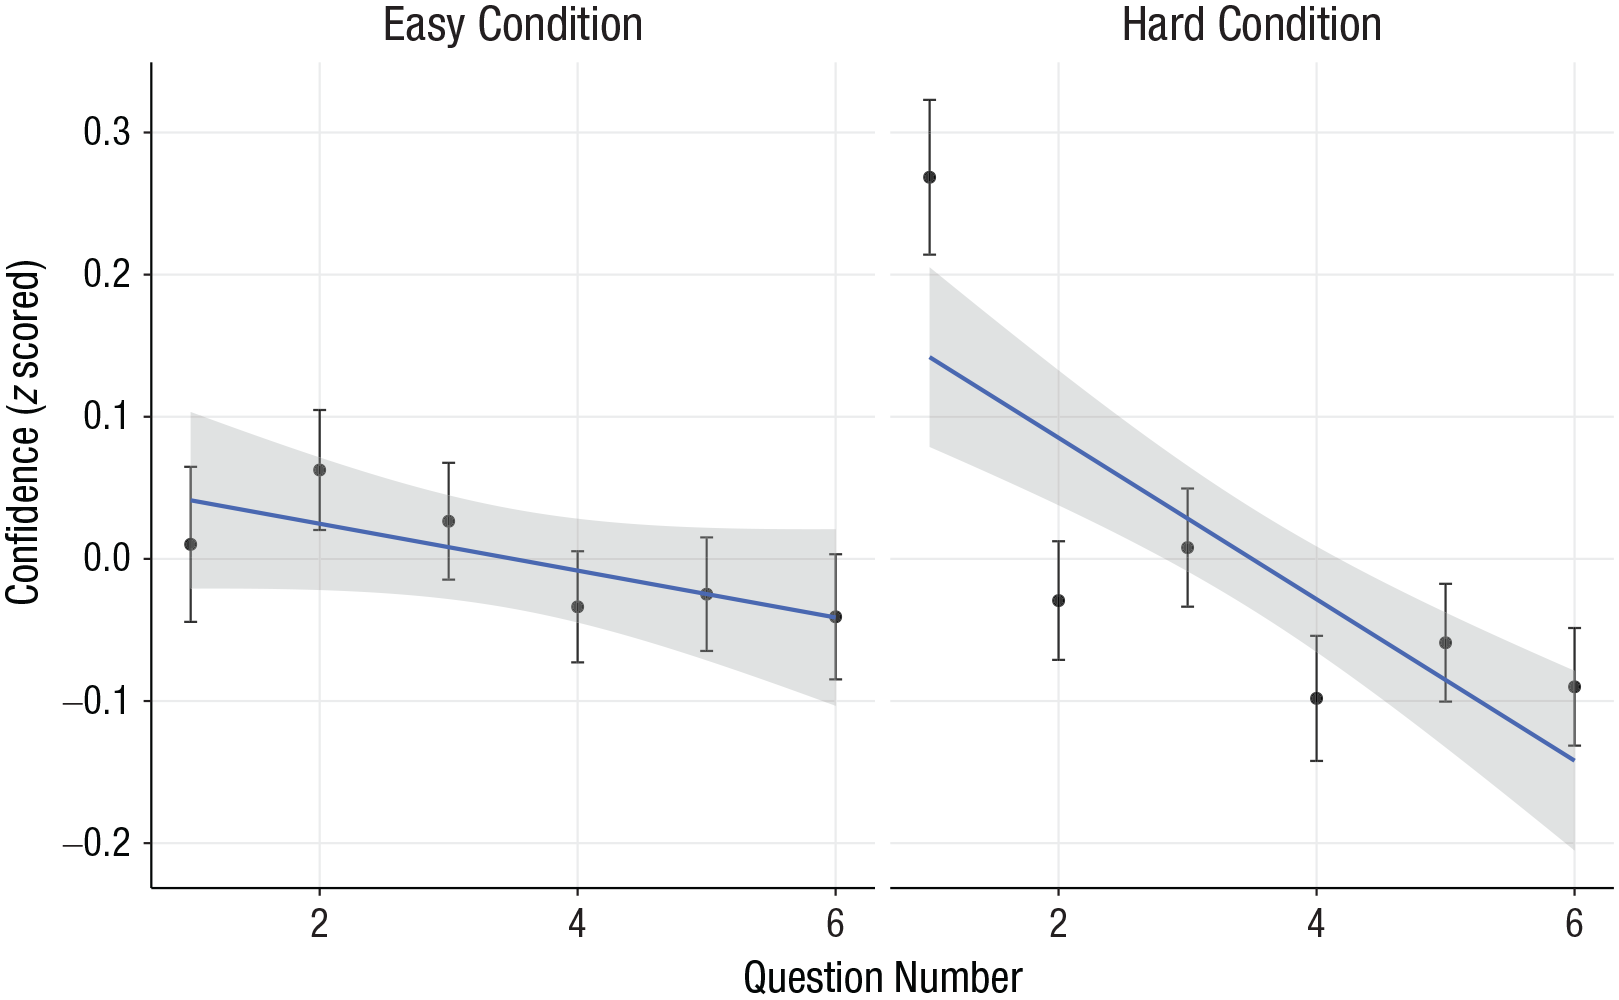
Confidence across the series of questions in each of the two conditions of Study 5. Dots indicate group means, and error bars indicate standard errors. The solid lines indicate the best-fitting regressions, and the shaded areas represent the 95% confidence bands for the regressions.
Prior to examining the influence of response time, we excluded 12% of estimates (443 of 3,708) with response times in excess of 45 s (3 times the median response time); these outliers were probably the result of task interruption. Time spent on each estimate declined with each subsequent question, gamma regression b = −0.16, SE = 0.004, t = −41.8, p < .001, and response time marginally predicted confidence when we controlled for worker ID and stimulus, increasing .8% for each additional log (second) spent, b = 0.76, SE = 0.42, t = 1.82, p = .069.
When we examined error over the course of the six items, excluding 15 estimates with an error of more than 600% (suggesting an estimate for the entire jar rather than one color), we also observed a decrease in percentage of error over the course of the task in both conditions, b = −1.6, SE = 0.26, t = −6.41, p < .001. It seems likely that participants were taking advantage of the repeated examination of the same candy jar to improve their estimates. This makes the decline in confidence that we observed in the hard condition particularly intriguing, as it seems that confidence declined while at the same time accuracy improved. However, once again we found that these declines in error and response time did not statistically mediate the effect of question order on confidence. Controlling for the log of response time and percentage of error did not diminish the effect of question order on z-scored confidence in the hard condition, β = −0.05, 95% CI = [−0.08, −0.02], t = −3.59, p < .001. The interaction between question difficulty and question order remained at a similar magnitude, though it was only marginally significant with the addition of the control variables, β = −0.04, 95% CI = [−0.08, 0.00], t = −1.91, p = .056.
Study 6: Revisiting Earlier Estimates
In Study 6, we explicitly tested our inflation-and-adjustment theory, which proposes (a) that confidence in prior estimates increases in hindsight and (b) that this inflated level of confidence serves as a reference point from which future confidence judgments are adjusted. Prior research suggests that over time, people become more committed to their judgments, view them as more consistent and more cohesive, and forget or discount contradictory and missing information (Griffin & Tversky, 1992; Koriat, 2012; Koriat, Lichtenstein, Fischhoff, & Bourne, 1980; Walters, Fernbach, Fox, & Sloman, 2016). Given this increase in recalled confidence, the current estimate might appear less certain by comparison. Thus, the confidence decrease we report arose not because later items were actually more difficult, the estimates less accurate, or the deliberation process more fraught, but because prior estimates seemed more coherent in hindsight.
Method
We tested this theory by comparing our previous procedure to one in which participants make estimates and confidence ratings, complete a set of filler estimates, and then revisit the confidence ratings they had offered for earlier items. We were particularly interested in the change in confidence from the end of the filler estimates to the first revisited estimate.
If confidence judgments are based on a recollection of the general gist of the earlier estimation process, and if confidence in previous estimates was inflated because of biased forgetting, then a revisited estimate should receive higher confidence ratings compared with the most recent filler estimate. However, if the participants were monitoring their performance and learning that the task is difficult, then we should observe the opposite pattern. To the extent that self-monitoring has allowed participants to discern the true difficulty of the task and their own general ineptitude, then revisited estimates should receive ratings that are lower than or comparable with recent estimates.
Participants
We collected 1,008 completed responses from MTurk. After removing 29 participants who looked up information online and 24 participants who failed an attention check, we had a final sample of 955 participants (51% female; mean age = 36.1 years). Incentive and bonus procedures were the same as in Study 1.
Procedure
We randomly assigned each participant to one of two conditions. In both conditions, participants made estimates of four different animal weights (drawn at random from a set of eight stimuli and presented in random order), and then made 12 unrelated filler estimates. As in prior studies, participants reported their corresponding confidence ratings after each estimate. Our treatment occurred after the 12 filler estimates. In the control condition, participants then made weight estimates for the four animal stimuli of the original set of eight not sampled in the first four estimates and again reported their level of confidence for each (new) estimate. In the repeat condition, participants were presented with the estimates they had already made for the first four animals (one at a time in a new random order) and asked to reassess their confidence in those original estimates. All confidence ratings were elicited as the probability that the estimate was within 10% of the actual value. Participants reported demographic information, reported cheating, and were presented with one result for bonus-payment purposes.
If participants’ confidence ratings reflected how confident they were feeling on a current estimate relative to the immediately preceding one, we should have observed an increase in confidence in the repeat condition between the last of the 12 filler items and the first item of the final set, which again featured animals. We expected no such increase in the control condition. When repeat-condition participants encountered an item they had seen previously, the familiar item should have felt more certain than the immediately preceding, unfamiliar item. Furthermore, we predicted that the four repeated items would not show a downward trend in confidence ratings because participants would not actually be making the estimates (only rating their confidence) and thus would not feel more uncertain and conflicted about each new estimate relative to the previous one.
Analytical approach
A sample size of 1,000 participants was predetermined in order to provide sufficient statistical power to detect an interaction between question order and experimental condition. We conducted three preregistered analyses. First, in the repeat condition, we tested for an increase in confidence between the last of the 12 filler items (Item 16) and the first item that presented participants with a familiar stimulus (Item 17) in the repeat condition. We expected the magnitude of this change to be larger than the change in confidence on the same items in the control condition. For this analysis, we used a linear mixed-effects model predicting the dependent variable (confidence z-scored within participant) from question order, condition, their interaction term, random intercepts for specific stimuli and participants, and random slopes for each participant across question order. We predicted that the coefficient of the interaction term would be positive and significant.
Second, we repeated this analysis for the final set of 4 items, which featured familiar animals in the repeat condition and new animals in the control condition, with question order mean-centered. We predicted that the average level of confidence for these final four items would be higher in the repeat condition than in the control condition.
Finally, we tested the hypothesis that, as in prior studies, confidence would decline over the course of the initial questions (i.e., Questions 1–4) but that this decline would be attenuated in the repeat condition on the final four questions when participants were restating their confidence regarding the same stimuli. To test this hypothesis, we analyzed a subset of the data within the repeat condition that contained only Items 1 through 4 and 17 through 20. This allowed us to compare participants’ confidence on these selected items. We centered the question numbers within each set of four and assigned a dummy variable for each set (0 = first set, 1 = final set). The significance of the coefficients for set and the interaction term of centered question order and set are the tests of our exploratory hypothesis.
Results
When considering all 19,100 estimates made by participants, we found that the average confidence on a 100-point scale was 52.6 (SD = 25.1). The main effect of decreasing z-scored confidence across the first four estimates in the control condition, β = −0.11, 95% CI = [−0.14, −0.07], t = −5.96, p < .001, and the repeat condition, β = −0.10, 95% CI = [−0.13, −0.07], t = 5.79, p < .001, replicated our findings in prior studies.
Next, we examined the change in confidence from the last of our 12 filler questions (Item 16) to the first item of the second set of animal-weight estimates (Question 17). In the control condition, we observed a small but significant decline in z-scored confidence (mean difference = −0.17), t = 2.89, p = .004, Cohen’s d = −0.19, 95% CI = [−0.33, −0.06], suggestive of a continuation of the effect as usual. As our theory predicted, the repeat condition showed a significant increase in z-scored confidence from the last new estimate to the first revisited estimate (mean difference = 0.41), t = 6.73, p < .001, Cohen’s d = 0.44, 95% CI = [0.31, 0.58]. Thus, we observed a significant interaction between item and condition, β = 0.58, 95% CI = [0.42, 0.74], t = 7.21, p < .001.
When examining the final four questions, we observed, as predicted, no significant confidence change in the repeat condition (Fig. 7). We observed a marginally significant increase in the control condition, which in the broader context of Items 8 through 20 appeared to be noise. In line with our predictions, the mean level of confidence was higher in the repeat condition than in the control condition for these final four estimates, β = 0.26, 95% CI = [0.19, 0.32], t = 7.78, p < .001. Also, as predicted, the significant downward slope in confidence for the first four estimates was significantly attenuated when these same estimates were revisited at the end of the survey, interaction β = 0.10, 95% CI = [0.05, 0.15], t = 4.21, p < .001.

Confidence across the series of questions in each of the two conditions of Study 6. Dots indicate group means, and error bars indicate standard errors. Items 17 through 20 in the repeat condition (highlighted in red) were a reappraisal of the first four estimates.
The results of Study 6 show a pattern largely consistent with our theory. The fact that confidence in the revisited estimates showed a dramatic increase relative to the immediately preceding estimate suggests that participants were not recalibrating their evaluation of task difficulty, at least not in a generalizable manner that would cause them to question earlier assessments of their confidence. Overall, the data seem supportive of part two of our theory.
Contrary to part one of the theory, however, we did not observe an increase in confidence for the revisited estimates compared with the original confidence appraisals, conducted several minutes earlier. In fact, a paired-samples t test of all original and revisited confidence ratings showed a marginally significant decrease (mean difference = 0.85%), t = 1.70, p = .089. With the benefit of hindsight, we can think of a number of reasons why this might be so. Anchoring on the lower confidence ratings for Items 5 through 16 may have decreased reported confidence on the items that immediately followed. It was our intention that the filler questions would make the original stated confidence response difficult to remember to prevent participants from simply restating their earlier responses. However, this also prevents us from drawing a definitive conclusion about whether participants intended to report a higher or lower confidence than that originally reported. Finally, it is of course possible that participants were doing some amount of learning about the difficulty of the task; this mechanism could also be at play.
Study 7: Repeated Estimates or Repeated Confidence Ratings
Method
In our final study, we tested part two of our theory by separating the effect of making repeated estimates from the effect of repeatedly reporting one’s confidence. If the decline in reported confidence arises from conveying one’s degree of confidence relative to prior statements of confidence, the effect should require multiple confidence ratings. It should not emerge if a participant made multiple estimates but offered a confidence rating for only one of them. By contrast, if confidence declines because participants are gaining an appreciation for the difficulty of the task, the effect should be observed between participants even if any given participant expresses confidence only once during the series of estimates.
Participants
We obtained 1,982 completed responses from MTurk after excluding 72 responses with duplicate respondent IDs. In accordance with our preregistration, we excluded 80 participants who failed an attention check common to all conditions. After removing 17 participants who looked up information online, we had a final sample of 1,885 participants (56% female; mean age = 36.1 years). Incentive and bonus procedures were the same as in Study 1.
Procedure
We randomly assigned each participant to one of two conditions. In both conditions, participants estimated the weights of five animals. In the control condition, participants reported their corresponding confidence ratings after each estimate, as in prior studies. We randomly selected only one of these confidence ratings from each participant to include in the analysis. In follow-up analysis, we used bootstrapping to ensure that the results did not rely on which estimate was selected for each participant. In the single-confidence condition, participants estimated the weights of five animals but reported confidence for only one of these five estimates (randomly selected). The result was a 2 (condition) × 5 (question number for confidence rating) between-participants design.
After making the five estimates, participants reported demographic information and were given an opportunity to report cheating. We then used the experimental software to present each participant with a randomly selected result for bonus-payment purposes.
Analytical approach
The experimental manipulation in this study resulted in a single confidence measure per participant, requiring a fully between-participants analysis and precluding the use of confidence z-scored within participant as the main dependent variable. In order to make full use of our available data, we repeated the analysis using 10,000 bootstrapped simulations of the random draw of confidence ratings from the control-condition data. We predetermined a sample size of 2,000 participants (1,000 per condition) in an effort to detect the moderation of our effect.
We expected to observe a decline in confidence over the five estimates in the control condition but no decline in confidence in the single-confidence condition. We used a linear mixed-effects model predicting confidence from question order, condition, and their interaction term, as well as random intercepts for specific stimuli. We predicted that the coefficient of the interaction term would be positive and significant.
Results
We replicated our finding of a decline in confidence for the control condition, b = −2.01, 95% CI = [−3.06, −0.96], t = −3.75, p < .001. Crucially, there was not a significant decline in the single-confidence condition (Fig. 8). The interaction between condition and question order was positive and significant, as predicted, b = 1.65, 95% CI = [0.19, 3.11], t = 2.22, p = .026. The supplementary bootstrap analysis confirmed the robustness of the decline of confidence in the control condition, with 79% of samples showing a significant decline at an average of 1.5% per question. The analysis also showed that although the interaction was consistently positive (98% of estimates > 0, mean b = 1.09), it was significant for only 24% of samples.

Confidence across the series of questions in each of the two conditions of Study 7. Dots indicate group means, and error bars indicate standard errors. The solid lines indicate the best-fitting regressions, and the shaded areas represent the 95% confidence bands for the regressions.
These results further support the hypothesis that the decline in confidence over the course of a task is a contextual phenomenon in which prior statements of confidence serve as reference points. When no prior reference points are available, as in the single-confidence condition, the decline so consistently observed in the prior studies disappears, b = −0.37, 95% CI = [−1.39, 0.64], t = −0.72, p = .473. The results would be consistent with only a “learning-through-self-monitoring” explanation if learning required not only experiencing the estimates but also explicitly reporting one’s confidence.
General Discussion
In this article, we document a decline in reported confidence across a set of quantitative estimates that does not appear readily justifiable by normative considerations, such as feedback or new information. We observed this decline using a variety of stimuli and several confidence-elicitation methods, and both with and without financial incentives. The decline does not appear dependent on the factors suggested by existing theories, including changes in accuracy, effort, or subjective knowledge. Study 3 also suggests that the effect violates lay intuition.
An intuitively appealing explanation (Pulford & Colman, 1997) is that the decline reflects the ability of participants to self-monitor their own performance, learning over time that the task is more difficult, or their ability more limited, than they thought at first. Our results are largely inconsistent with this explanation. The persistence of the decline when facing a mixed set of stimuli (Study 4), the failure to increase confidence when underconfident (Study 5), the resilience of revisited confidence ratings (Study 6), and the disappearance of the effect when reporting confidence only once (Study 7) all suggest that the decline does not reflect a reappraisal of the overall task difficulty and one’s knowledge.
Instead, we suggest an alternative theory in two parts. First, individuals may feel more certain about their estimates on later reflection because contradictory information dissipates from memory more easily than the supporting information. Second, confidence in any given judgment is expressed in reference to confidence in prior judgments. Although the most influential point of comparison is the immediately preceding judgment, it seems likely that the entire set of expressed confidence ratings provides a context for participants’ meta-understanding of the precision of their beliefs. The combined effect is that more recent estimates seem less certain than preceding estimates and are rated lower by comparison not because participants accurately assess the task as more difficult but because they misperceive prior tasks as easier in hindsight than in the moment. Thus, we observe movement in the normatively correct direction resulting in improved calibration, but for the wrong reasons. In this case, two wrongs make a right.
Our work complements and extends earlier work on the dynamics of confidence. Although our findings appear at odds with the beginner’s bubble, Sanchez and Dunning (2018) suggest that task difficulty and familiarity are likely to be potential boundary conditions of their effect. Our task included stimuli that participants are likely to have encountered many times before. In effect, many participants began the study at the peak of the bubble.
If experience is enough to reduce overconfidence, how is it that the bias persists in so many domains among adults? Study 7 shows that the effect depends on repeated confidence assessments, something that most individuals outside of the laboratory might rarely explicitly engage in. Yet research should consider important exceptions of individuals who professionally make repeated judgments (e.g., diagnosticians, financial analysts, security analysts) and examine our phenomenon in those contexts. Future research inserting delays between estimates and exploring various levels of difficulty and expertise is also needed to determine the durability of the observed decline. In Study S2 in the Supplemental Material, we tested the effect of feedback (which, on a difficult task, is predominantly negative). We found that accurate feedback speeds the confidence decline.
Future work should further explore the behavioral consequences of our phenomenon. The BDM measure employed in Study 2 suggests that individuals are willing to act on their confidence ratings, since they chose to make real bets on the basis of their confidence. However, the speculative, probabilistic, and abstract nature of this incentive structure make it a less than ideal behavioral measure.
Whether the observed decline in reported confidence leads to behavioral implications or merely reflects a subjective and temporary assessment, knowledge of the phenomenon is important for contexts in which a person’s estimates are factors in others’ decision-making. We rely on such interpersonal expressions of confidence in many areas, such as medicine, criminal trials, sports betting, and intelligence analysis. The confidence levels that accompany judgments are generally considered as truly reflective of the rater’s beliefs. Our studies indicate that this assumption is somewhat erroneous.
Identifying circumstances in which confidence declines could prove useful in designing environments that calibrate decision makers for important tasks. Engaging in a series of warm-up estimates may provide a means of reducing overconfidence in concert with other proven methods, such as providing feedback, increasing the salience of unknown information, and consciously considering alternative viewpoints. Consumers of other people’s judgments should be aware of how the context of these judgments influences reports. Most importantly, the contextual nature of confidence revealed in these studies illustrates that expressed confidence is a dynamic process and ought to be studied as such.
Supplemental Material
Minson_OpenPracticesDisclosure_rev2 – Supplemental material for Confidence in Context: Perceived Accuracy of Quantitative Estimates Decreases With Repeated Trials
Supplemental material, Minson_OpenPracticesDisclosure_rev2 for Confidence in Context: Perceived Accuracy of Quantitative Estimates Decreases With Repeated Trials by Julia A. Minson and Christopher Umphres in Psychological Science
Supplemental Material
Minson_Supplemental_Material_rev – Supplemental material for Confidence in Context: Perceived Accuracy of Quantitative Estimates Decreases With Repeated Trials
Supplemental material, Minson_Supplemental_Material_rev for Confidence in Context: Perceived Accuracy of Quantitative Estimates Decreases With Repeated Trials by Julia A. Minson and Christopher Umphres in Psychological Science
Footnotes
Transparency
Action Editor: Timothy J. Pleskac
Editor: D. Stephen Lindsay
Author Contributions
Both authors contributed to the study design. Data were collected and analyzed by C. Umphres under the supervision of J. A. Minson. Both authors contributed to the writing of the manuscript and approved the final version of the manuscript for submission.
Notes
References
Supplementary Material
Please find the following supplemental material available below.
For Open Access articles published under a Creative Commons License, all supplemental material carries the same license as the article it is associated with.
For non-Open Access articles published, all supplemental material carries a non-exclusive license, and permission requests for re-use of supplemental material or any part of supplemental material shall be sent directly to the copyright owner as specified in the copyright notice associated with the article.