
Abstract

Lu, Lee, Gino, and Galinsky (2018) theorized and found that air pollution positively predicted unethical behavior and that state anxiety was a mediating mechanism. Following Kouchaki and Desai (2015), they reasoned that the anxiety induced by air pollution can lead individuals “to focus narrowly on their own basic needs and self-interest, which can cause them to be less mindful of principles that guide ethical and moral reasoning, thus leading them to behave unethically” (p. 360; see also Zhang, Shi, Zhou, Ma, & Tang, 2020). The present research extends Lu et al.’s (2018) work both theoretically and empirically.
Theoretically, it remains unclear whether the effect of air pollution on unethical behavior is more physiological or psychological—that is, whether the effect is driven more by actual or perceived air-pollution levels. Physiologically, air pollutants can “trigger anxiety by increasing oxidative stress and systemic inflammation” (Lu, 2020, p. 52); psychologically, perceived air pollution can make people anxious about their health and future (Sass et al., 2017). The current studies addressed this theoretical question in three ways. First, we found evidence that perceived air pollution mediates the effect of actual air pollution on state anxiety and thus unethical behavior (i.e., actual pollution → perceived pollution → state anxiety → unethical behavior). Second, whereas Lu et al. (2018) examined only the main effect of air pollution, we also considered the moderating effect of cloudiness: People tend to perceive the same level of actual pollution as heavier when the weather is cloudy than when it is sunny (because of lower visibility on cloudy days). That is, cloudiness may amplify the main effect of actual pollution, such that the effect of actual pollution may be stronger when it is cloudy than when it is sunny. Therefore, a significant moderating effect of cloudiness would suggest that the effect of air pollution on unethical behavior is driven more by perceived pollution than by actual pollution. Third, we employed a regression-discontinuity (RD) design in Study 2 to compare the levels of unethical behavior when air pollution is just above versus just below the category cutoffs (e.g., when pollution worsens from 100 to 101, it triggers an alert-category change from “moderate” to “unhealthy for sensitive groups”). An abrupt increase in unethical behavior at the cutoffs would suggest that the effect of air pollution is more psychological (owing to the signaling effects of health alerts), whereas a smooth, continuous relationship between air pollution and unethical behavior would suggest that the effect is more physiological.
Our studies also extended Lu et al.’s (2018) work empirically. First, whereas their archival study was at the city-year level, our studies were at the person-day level and thus provided greater analytical precision. Second, despite its many control variables, Lu et al.’s (2018) archival study was correlational. To strengthen causal inference, we provided quasiexperimental evidence obtained with an RD design. Third, we extended the findings of Lu et al. (2018) by examining how air pollution influences prevalent unethical workplace behaviors, such as cyber loafing and clock-out collusion.
Study 1: A Moderated Serial Mediation Model of Air Pollution and Unethical Behavior
In Study 1, we tested a moderated serial mediation model of the link between air pollution and unethical behavior (Fig. 1). Specifically, we tested the indirect effect from actual pollution to unethical behavior via perceived pollution and state anxiety. Moreover, we examined whether this indirect effect is moderated by cloudiness such that the same actual pollution level is perceived as more severe when the weather is cloudy than when it is not cloudy.
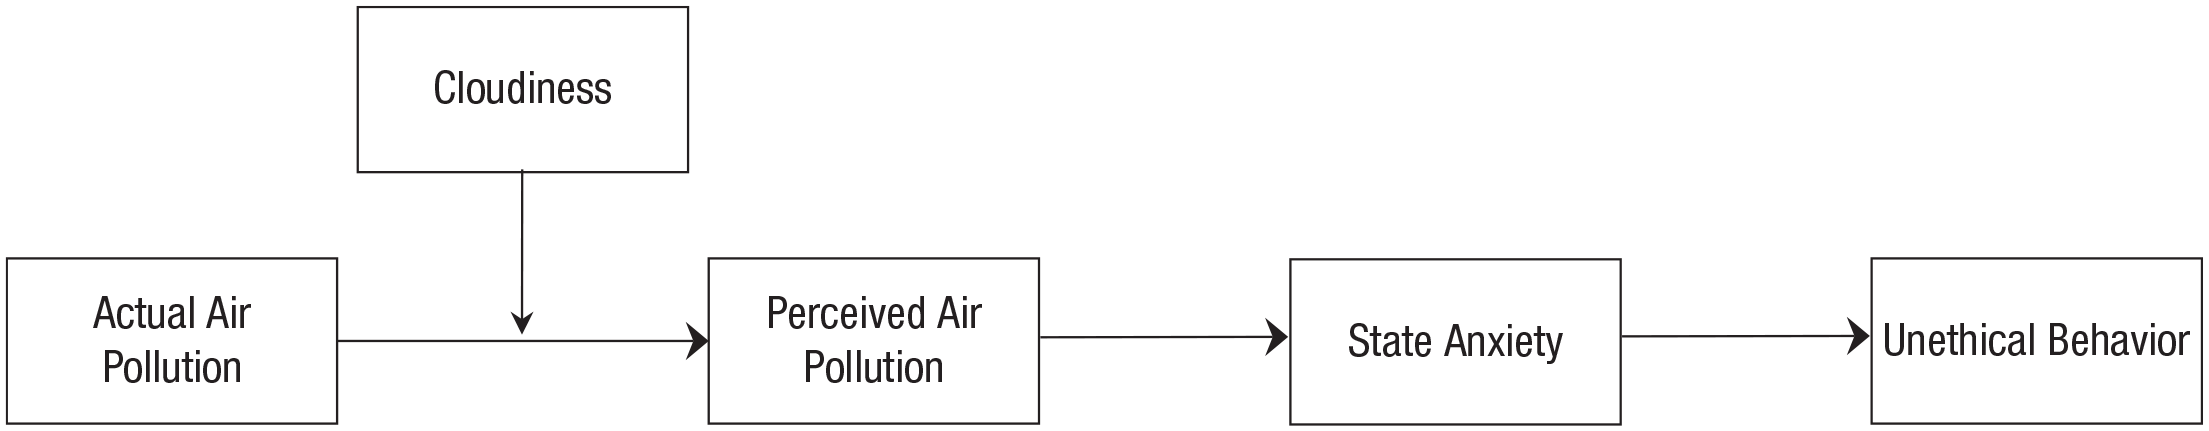
Conceptual model: the indirect effect from actual air pollution to unethical behavior via perceived air pollution and state anxiety, as moderated by cloudiness.
Participants
We used G*Power software (Faul, Erdfelder, Lang, & Buchner, 2007) to determine the sample size required for a small-sized effect f2 of .05 (two-tailed) in a between-subjects design: 312 participants were required for the study to be powered at 95%. To exceed this sample-size requirement, we aimed to recruit 500 full-time Chinese employees via www.credamo.com, a reliable Chinese data-collection platform similar to Qualtrics Online Sample. Participants qualified only if they had a stable full-time job, went to work on the day of our study, and completed both phases of the study. These criteria yielded 432 participants located in 87 Chinese cities for analysis (age: M = 30.07, SD = 6.12; 42.8% female); 44.4% were entry-level employees, 34.3% were junior managers, 19.4% were middle managers, and 1.9% were senior managers. The breakdown of their educational background was 1.6% middle school or below, 7.9% high school, 19.0% associate degree, 62.3% undergraduate degree, and 9.2% graduate degree.
Procedure
To reduce potential self-report biases, we used a two-phase study design to create temporal separation. In Phase 1 (~10 a.m.), participants answered questions about perceived air-pollution levels and demographics. In Phase 2 (~8 p.m.), participants answered questions about state anxiety and unethical behavior. The order of state anxiety and unethical behavior was counterbalanced: Half of the participants reported state anxiety first, and the other half reported unethical behavior first. We also included filler questions between the two measures. Following the norm at www.credamo.com, we compensated each participant 2 yuan for completing Phase 1 and another 3 yuan for completing Phase 2.
Measures
All measures were translated into Chinese following the translation and back-translation procedure (Brislin, 1970).
Actual air pollution
On the basis of participants’ locations, we sourced Air Quality Index (AQI) data from China’s Ministry of Environmental Protection (http://datacenter.mee.gov.cn). The AQI is the most common and authoritative measure of air quality and captures six major air pollutants: carbon monoxide (CO), nitrogen dioxide (NO2), ozone (O3), particulate matter PM2.5, particulate matter PM10, and sulfur dioxide (SO2). AQI scores correspond to six health-alert categories: good (0–50), moderate (51–100), unhealthy for sensitive groups (101–150), unhealthy (151–200), very unhealthy (201–300), and hazardous (301–500). The AQI ranged from 52 to 269 in Study 1.
Perceived air pollution
We measured perceived air pollution with three items adapted from Fehr, Yam, He, Chiang, and Wei (2017). Participants indicated the extent to which they agreed that air pollution was “severe,” “bad,” and “terrible” (1 = strongly disagree, 6 = strongly agree; α = .96).
State anxiety
Following Lu et al. (2018), we measured state anxiety with the six-item scale from the short Spielberger State–Trait Anxiety Inventory (Marteau & Bekker, 1992). Participants indicated the extent to which they felt “anxious,” “calm” (reverse coded), “neutral” (reverse coded), “relaxed” (reverse coded), “tense,” and “upset” during the day (1 = not at all, 6 = very much; α = .85).
Unethical behavior
We measured unethical behavior with eight items adapted from previous studies (Bennett & Robinson, 2000; Lu, Brockner, Vardi, & Weitz, 2017). Example items were “Today, I intentionally worked slower than I could have worked,” and “Today, I dragged out work in order to get overtime” (1 = strongly disagree, 6 = strongly agree; α = .84). 1
Cloudiness (moderator)
We coded whether a city was cloudy (1 = yes, 0 = no) according to the widely used Chinese weather website www.tianqihoubao.com.
Attention to air pollution
We assessed how much attention Chinese participants paid to air pollution in everyday life: (a) “Are you familiar with the Air Quality Index categories?” (1 = yes, 0 = no); (b) “In everyday life, how much attention do you pay to the Air Quality Index categories?” (1 = very little, 6 = very much); and (c) “How often do you check air quality on your phone?” (1 = almost never, 6 = multiple times per day).
Control variables
Temperature
Because temperature may be related to both air pollution and individuals’ unethical behavior, we controlled for temperature (degrees Celsius), which was sourced from www.tianqihoubao.com.
Demographics
Following prior research (Fehr et al., 2017; Lu et al., 2018), we also controlled for age, gender, education, and job rank.
Results
Descriptive statistics and bivariate correlations are displayed in Table S1 in the Supplemental Material available online. All regression results reported below included the control variables; these results were robust without the control variables.
State anxiety
When examined separately, both actual pollution (b = 0.003, SE = 0.0008, p < .001) and perceived pollution (b = 0.18, SE = 0.03, p < .001) significantly predicted state anxiety. However, when we entered both actual pollution and perceived pollution into the same regression, the effect of actual pollution on state anxiety became nonsignificant (b = 0.001, SE = 0.0008, p = .18), whereas the effect of perceived pollution remained significant (b = 0.16, SE = 0.03, p < .001). Consistent with our prediction, mediation analyses showed that perceived pollution mediated the effect of actual pollution on state anxiety (indirect effect: b = 0.002, p < .001, bootstrapped 95% confidence interval (CI) = [0.0009, 0.0024]).
Unethical behavior
When examined separately, both actual pollution (b = 0.002, SE = 0.0007, p = .035) and perceived pollution (b = 0.10, SE = 0.03, p < .001) significantly predicted unethical behavior. However, when we entered both actual pollution and perceived pollution into the same regression, the effect of actual pollution on unethical behavior became nonsignificant (b = 0.0006, SE = 0.0008, p = .44), whereas the effect of perceived pollution remained significant (b = 0.09, SE = 0.03, p = .003). Consistent with Lu et al.’s (2018) findings, mediation analyses showed that state anxiety mediated the effect of perceived pollution on unethical behavior (indirect effect: b = 0.001, p < .001, bootstrapped 95% CI = [0.0003, 0.0016]).
Cloudiness as a moderator
The effect of actual pollution on perceived pollution (b = 0.01, SE = 0.001, p < .001) was significantly moderated by cloudiness (b = 0.006, SE = 0.002, p = .007): The effect was stronger when the weather was cloudy (b = 0.01, SE = 0.001, p < .001) than when it was not cloudy (b = 0.005, SE = 0.002, p = .010).
Actual pollution (moderated by cloudiness) → perceived pollution → state anxiety → unethical behavior
To test our theoretical model (Fig. 1), we conducted moderated serial mediation analyses with the SPSS PROCESS macro (Hayes, 2018). Using PROCESS Model 6, we found that the indirect effect from actual pollution to unethical behavior via perceived pollution and state anxiety was significant (indirect effect: b = 0.0006, bootstrapped 95% CI = [0.0003, 0.0011]). Using PROCESS Model 83, we found that this indirect effect was significantly larger when it was cloudy (indirect effect: b = 0.0007, bootstrapped 95% CI = [0.0004, 0.0012]) than when it was not cloudy (indirect effect: b = 0.0003, bootstrapped 95% CI = [0.0001, 0.0007]; the difference between the conditional indirect effects was significant (bootstrapped 95% CI = [0.0001, 0.0008]).
Attention to air pollution
Most (90.7%) of the participants reported being familiar with AQI categories; 87.3% reported paying “some,” “much,” or “very much” attention to AQI categories in everyday life; and 70.6% reported checking air quality on their phone “multiple times a week,” “once a day,” or “multiple times a day.” These results indicate that Chinese participants are familiar with and frequently pay attention to AQI categories.
Discussion
Replicating and extending Lu et al.’s (2018) work, Study 1 provided evidence for a moderated serial mediation model of the link between air pollution and unethical behavior (Fig. 1). The effect of actual pollution on unethical behavior was mediated by perceived pollution and state anxiety and was moderated by whether or not the weather was cloudy. Together, these results suggest that the effect of air pollution on unethical behavior may be more psychological than physiological.
Study 2: RD Evidence for the Effect of Perceived Air Pollution on Unethical Behavior
Study 2 extended Study 1 in four ways. First, whereas we used a correlational design in Study 1, we used an RD design in Study 2 to strengthen causal inference. Second, whereas we relied on self-report measures of unethical behavior in Study 1, we used objective and unobtrusive measures in Study 2. Third, whereas we used a between-subjects design in Study 1, we used a within-subjects panel design in Study 2 to examine how day-to-day variation in air pollution influenced day-to-day variation in unethical behavior. Fourth, we tested whether the moderating effect of cloudiness was replicable in another context.
Participants
We analyzed a 19-month day-level panel data set of 712 anonymous employees (age: M = 40.47, SD = 9.32; 34.3% female) in a large state-owned enterprise in Chengdu, one of the most polluted Chinese cities. The breakdown of their educational background was 3.23% middle school or lower, 4.63% high school, 52.81% undergraduate degree, and 39.33% graduate degree; 80.62% were entry-level employees, 18.96% were section managers, and 0.42% were division managers.
Measures
Air pollution
For the period from January 18, 2016, to August 11, 2017, we obtained daily AQI data of Chengdu from China’s Ministry of Environmental Protection. As mentioned above, AQI scores correspond to six health-alert categories: good (0–50), moderate (51–100), unhealthy for sensitive groups (101–150), unhealthy (151–200), very unhealthy (201–300), and hazardous (301–500). The AQI ranged from 26 to 394 in Study 2. Because air pollution is such a devastating problem in Chengdu, people frequently monitor AQI scores on their mobile phones (see Fig. S1 in the Supplemental Material for examples of air-pollution alerts).
Unethical behavior
We studied two types of unethical behavior in the workplace: clock-out collusion and cyber loafing. Though prevalent in the workplace, these two unethical behaviors remain understudied because of a lack of reliable data.
Before signing the contract with the company, all employees agreed to the company’s employee code of conduct and consented to the anonymous and aggregate use of their work-related data for the purposes of research and improving the company’s management environment. Hence, the company was able to provide reliable data on employees’ clock-out collusion and cyber loafing.
Clock-out collusion
Clock-out collusion refers to collusion between employees in which one employee dishonestly clocks out for others to cover up their unexcused early departure. As a traditional state-owned enterprise, the company had a strict clock-out time of 5:00 p.m. If employees left work before 5:00 p.m. without an excuse, their pay would be docked. To cheat the system and dodge the penalty, some early-departure employees would leave their ID badges with their colleagues to fake the 5:00 p.m. clock-out. Although the company had not started punishing this unethical behavior, it was able to systematically identify which employees engaged in clock-out collusion by examining the records of clocking terminals and security systems. Using machine-learning algorithms, the company found that the time interval between two clock-outs is a reliable measure of clock-out collusion. Specifically, if two ID badges were successively tapped within a very short interval, it is almost certain that the employees engaged in a clock-out collusion. The company provided us with anonymous data on clock-out collusion (1 = engaging in a clock-out collusion on a given day, 0 = otherwise) from January 18, 2016, to August 11, 2017. After excluding weekends, holidays, and days with clocking-terminal dysfunctions, we had a total of 384 days of clock-out collusion data (N = 190,178). 2
Cyber loafing
Cyber loafing refers to employees’ voluntary use of the Internet for nonwork purposes during work hours. Whereas past studies on cyber loafing have relied on participants’ self-reports (Wagner, Barnes, Lim, & Ferris, 2012), our study uniquely leveraged unobtrusive records of cyber loafing. The company provided us with anonymous data on employees’ Internet browsing records on company-owned computers from April 1, 2017, to July 7, 2017. For every minute during work hours, the company’s information technology (IT) system recorded whether or not an employee surfed non-work-related websites. For example, if an employee watched a movie online for 55 min and shopped online for 30 min on a given day, then his or her total cyber-loafing time would be 85 min for that day. After excluding weekends, holidays, and days with IT system dysfunctions, we had a total of 62 days of Internet browsing records (N = 29,957).
Cloudiness (moderator)
As in Study 1, we collected data on whether a given day was cloudy (1 = yes, 0 = no) from www.tianqihoubao.com.
Control variables
Temperature
As in Study 1, we controlled for the daily temperature (degrees Celsius), which was also sourced from www.tianqihoubao.com.
Time fixed effects
To account for any unobserved time-specific characteristics (e.g., trend), we followed Zheng, Wang, Sun, Zhang, & Kahn (2019) and controlled for year (2016 vs. 2017), month, and day of the week.
Employee fixed effects
Following standard econometrics, we leveraged the panel structure of our data and included employee fixed effects as a conservative control, which was equivalent to including one dummy variable for each employee in our sample. The inclusion of employee fixed effects accounted for employee-specific characteristics (e.g., demographics and personality traits). Therefore, it was neither necessary nor feasible to control for demographic variables in addition to employee fixed effects.
Importantly, all results were robust when we conducted employee random-effects models (i.e., multilevel models in which days are nested within employees) with demographic control variables (age, gender, education level, and job rank). For detailed results, see Table S4 in the Supplemental Material.
Results
Descriptive statistics and bivariate correlations are displayed in Tables S2a and S2b in the Supplemental Material. The unit of analysis of our panel data was the employee-day. The panel structure of the data set enabled us to examine how day-to-day variation in air pollution influences within-employee day-to-day variation in workplace unethical behavior. Because cyber loafing (measured in minutes) is a positively skewed count variable that takes only nonnegative integer values, we conducted fixed-effects Poisson regressions; all results were robust when we conducted fixed-effects ordinary least squares regressions instead. Because clock-out collusion was a binary variable, we conducted fixed-effects logistic regressions.
Our empirical analysis consisted of two parts. First, we conducted regression analyses examining the effects of air pollution on clock-out collusion and cyber loafing, as well as the moderating effect of cloudiness (Tables S3 and S4 in the Supplemental Material). Second, we employed an RD design to provide quasiexperimental evidence for the effect of perceived air pollution on unethical behavior (Table S5 in the Supplemental Material).
Regression analyses
We present three models for each of the two unethical behaviors (see Table S3): Model 1 controlled for employee fixed effects and time fixed effects, Model 2 further controlled for cloudiness and temperature, and Model 3 tested the moderating effect of cloudiness.
Our analyses conceptually replicated Lu et al.’s (2018) results, showing that air pollution significantly predicted both clock-out collusion and cyber loafing across all models (all ps < .001; Table S3, Models 1 and 2). Importantly, this effect was significantly moderated by cloudiness (Table S3, Model 3: b = 0.002, SE = 0.0006, p < .001 for clock-out collusion; b = 0.006, SE = 0.00008, p < .001 for cyber loafing): The effects of air pollution on clock-out collusion and cyber loafing were stronger when the weather was cloudy than when it was not cloudy.
RD analyses
As a widely used quasiexperimental approach in the social sciences (Lee & Lemieux, 2010), RD design enabled us to test the effect of perceived air pollution on unethical behavior. Specifically, it compared the levels of unethical behavior when air pollution was just below versus just above the category cutoffs (e.g., AQI 100 = “moderate” vs. 101 = “unhealthy for sensitive groups”; see Fig. S1). If there were an abrupt increase in unethical behavior when air pollution jumped up a category, it would suggest that the effect of air pollution on unethical behavior is more psychological—that is, the signaling effect of air-pollution alerts plays an important role in triggering unethical behavior. By contrast, if the effect is more physiological, then there should be no abrupt increase in unethical behavior when air pollution jumps up a category.
We performed RD analyses for clock-out collusion (384 days) but not for cyber loafing because the cyber-loafing data were available only for 62 days. We followed previous research to assess RD in the presence of multiple cutoffs (Cattaneo, Keele, Titiunik, & Vazquez-Bare, 2016). First, we separately estimated the RD effect at each AQI cutoff of 50, 100, 150, and 200. Second, we pooled data across the cutoffs to estimate the average RD effect.
Figure 2 illustrates the RD results for separate estimates. Discontinuity is a dummy variable that takes a value of 1 when AQI is higher than a cutoff and a value of 0 when AQI is lower than or equal to a cutoff (Lee & Lemieux, 2010, p. 289). In addition, our models controlled for (AQI – cutoff) and Discontinuity × (AQI – cutoff), which allowed the slope to vary on each side of the cutoff (Lee & Lemieux, 2010, p. 318). All models controlled for employee fixed effects, time fixed effects, cloudiness, and temperature.

Illustration of regression-discontinuity results: clock-out collusion as a function of Air Quality Index score (Study 2). Gray lines are best-fitting regression lines. Red vertical lines represent “jumps” in clock-out collusion when air pollution jumped up an Air Quality Index category. Circle size represents the sample size at each Air Quality Index value.
As shown in Table S5, the individual RD effects were significant at the cutoffs of 100 (b = 0.195, SE = 0.067, p = .004), 150 (b = 0.529, SE = 0.112, p < .001), and 200 (b = 0.598, SE = 0.239, p = .012), but not at the lowest cutoff of 50 (b = 0.169, SE = 0.106, p = .111). The results were robust (b = 0.431, SE = 0.092, p < .001) when we combined “unhealthy” (AQIs between 150 and 200) and “very unhealthy” (AQIs greater than 200) into one category (because there were fewer AQI data points greater than 200). Moreover, the average RD effect was significant when we pooled across the cutoffs (b = 0.295, SE = 0.053, p < .001).
Discussion
By examining two novel measures of unethical behavior in Study 2, we revealed three important findings. First, we replicated Lu et al.’s (2018) effects with daily (rather than yearly) and individual-level (rather than city-level) measures of air pollution and unethical behavior. Second, we replicated our Study 1’s finding about the moderating role of cloudiness; specifically, the effect of air pollution on unethical behavior was stronger when the weather was cloudy than when it was not cloudy. Third, RD analyses revealed an abrupt increase in unethical behavior when air pollution jumped up an AQI category. Together, these results suggest that the effect of air pollution on unethical behavior is driven more by the subjective perception of increased air pollution rather than by actual increases in air pollution.
Conclusion
The current studies extended Lu et al.’s (2018) work both theoretically and empirically. Theoretically, we advanced a moderated serial mediation model of the link between air pollution and unethical behavior. People tend to feel more anxious and thus behave more unethically when they psychologically experience air pollution (e.g., when cloudy weather renders air pollution more severe; when health alerts indicate that the pollution level is unhealthy). Empirically, we strengthened causal inference with RD and used measures with greater construct validity and analytical precision. It is noteworthy that our two studies were conducted in China, where air pollution is part of everyday life and thus people are prone to perceive the same level of actual air pollution as heavier when the weather is cloudy than when it is sunny. Therefore, it is important for future research to examine whether our results are generalizable across different contexts (Lu, Lee, Gino, & Galinsky, 2020). Overall, our studies suggest that the effect of air pollution on unethical behavior may be more psychological than physiological.
Supplemental Material
Li_OpenPracticesDisclosure_rev – Supplemental material for Polluted Psyche: Is the Effect of Air Pollution on Unethical Behavior More Physiological or Psychological?
Supplemental material, Li_OpenPracticesDisclosure_rev for Polluted Psyche: Is the Effect of Air Pollution on Unethical Behavior More Physiological or Psychological? by Shiyang Gong, Jackson G. Lu, John M. Schaubroeck, Qian Li, Qiwei Zhou and Xiaoye Qian in Psychological Science
Supplemental Material
Li_Supplemental_Material_rev – Supplemental material for Polluted Psyche: Is the Effect of Air Pollution on Unethical Behavior More Physiological or Psychological?
Supplemental material, Li_Supplemental_Material_rev for Polluted Psyche: Is the Effect of Air Pollution on Unethical Behavior More Physiological or Psychological? by Shiyang Gong, Jackson G. Lu, John M. Schaubroeck, Qian Li, Qiwei Zhou and Xiaoye Qian in Psychological Science
Footnotes
Acknowledgements
We are grateful to Jimmy Hu, Peter Jin, Chaofan Li, Mingyue Pan, and Tianfang Yang for their feedback and research assistance.
Transparency
Action Editor: D. Stephen Lindsay
Editor: D. Stephen Lindsay
Author Contributions
S. Gong, J. G. Lu, and Q. Li contributed to the research concept and design. S. Gong, Q. Li, and X. Qian collected and analyzed the data. S. Gong and J. G. Lu drafted the manuscript, and J. M. Schaubroeck, Q. Li, and Q. Zhou provided critical revisions. The first two authors contributed equally to this research. All authors approved the final version of the manuscript for submission.
Notes
References
Supplementary Material
Please find the following supplemental material available below.
For Open Access articles published under a Creative Commons License, all supplemental material carries the same license as the article it is associated with.
For non-Open Access articles published, all supplemental material carries a non-exclusive license, and permission requests for re-use of supplemental material or any part of supplemental material shall be sent directly to the copyright owner as specified in the copyright notice associated with the article.