



Abstract
In this study, we monitored 470 university students’ smartphone usage continuously over 2 years to assess the relationship between in-class smartphone use and academic performance. We used a novel data set in which smartphone use and grades were recorded across multiple courses, allowing us to examine this relationship at the student level and the student-in-course level. In accordance with the existing literature, our results showed that students’ in-class smartphone use was negatively associated with their grades, even when we controlled for a broad range of observed student characteristics. However, the magnitude of the association decreased substantially in a fixed-effects model, which leveraged the panel structure of the data to control for all stable student and course characteristics, including those not observed by researchers. This suggests that the size of the effect of smartphone usage on academic performance has been overestimated in studies that controlled for only observed student characteristics.
Keywords
Smartphones have become pervasive in learning environments. A recent survey study found that 96% of U.S. college students own a smartphone (Brooks & Pomerantz, 2017), and additional evidence suggests that in-class mobile-device use has become common (Felisoni & Godoi, 2018; Ravizza, Uitvlugt, & Fenn, 2017). These devices enable students to engage in potentially learning-enhancing activities, such as taking notes, participating in online quizzes, or looking up pertinent facts on the Internet. However, the very same devices also connect students to an enticing menu of nonacademic stimuli that may distract from the learning processes taking place in their immediate learning environments (Stokols, 2018). Aside from diverting attention, device use may also inhibit other cognitive pathways involved in learning, including memory and reward processing (Chen & Yan, 2016; Uncapher & Wagner, 2018; Wilmer, Sherman, & Chein, 2017). However, recent research also emphasizes that the results of studies on the effects of digital-device use might depend heavily on the usage context from which the data are gathered and the subsequent methods of analysis chosen by the researchers (Adelantado-Renau et al., 2019; Orben, Dienlin, & Przybylski, 2019; Orben & Przybylski, 2019; Whitlock & Masur, 2019).
In a nascent body of experimental and observational research, psychologists have started to investigate the impact of portable-device use on student learning within the classroom setting using both self-reported and directly recorded measures. Experimental studies based on brief interventions have established that in-class multitasking with electronic devices can limit short-term knowledge retention (Mendoza, Pody, Lee, Kim, & McDonough, 2018; Risko, Buchanan, Medimorec, & Kingstone, 2010; Wood et al., 2012). Because of the short testing periods and possible presence of experimental-demand characteristics, these experiments do not necessarily generalize to the real-world learning environments and longer evaluation cycles found in educational institutions. Observational studies, although unable to demonstrate causality, overall have found similar negative links between portable-device use and academic performance (Fried, 2008; Grace-Martin & Gay, 2001; Kim et al., 2019; Kirschner & Karpinski, 2010; Kraushaar & Novak, 2010; Lepp, Barkley, & Karpinski, 2014; Ravizza et al., 2017; Uzun & Kilis, 2019).
Most prior observational studies have relied heavily on self-reported or self-initiated measures of device use. However, self-reports of digital-device use have been found to be inaccurate, exhibiting little relation to true usage (Andrews, Ellis, Shaw, & Piwek, 2015; Kim et al., 2019; Kraushaar & Novak, 2010; Orben & Przybylski, 2019). Only a small subset of the observational studies measured usage directly by digitally tracking students’ device behaviors and did so for only a few weeks, a single course, or over a single term (Felisoni & Godoi, 2018; Grace-Martin & Gay, 2001; Kraushaar & Novak, 2010; Ravizza et al., 2017). Participants in the study by Ravizza et al. (2017) were required to manually activate an online Web-activity logger at the start of every class. This approach overcomes problems of self-reporting but may inadvertently prime students by periodically drawing their attention to their device use at the start of every class measurement period. Self-activated tracking may also bias participation in the study through selective logging and errors of omission. By comparison, the recent advent of smartphone-activity tracking apps provides a less invasive approach to collecting device interactions in the background (Felisoni & Godoi, 2018; Kim et al., 2019).
Existing studies have focused on the relationship between academic performance and device use during a single course or collected average measurements across several courses (Chen & Yan, 2016). Because these cross-sectional studies included only a single row of measurements for each participating student, they could not control for unobserved variables that might jointly determine device use and academic performance. Some studies directly measure and control for specific student traits that could confound the estimated effects—including intelligence, motivation, and interest (Ravizza, Hambrick, & Fenn, 2014; Ravizza et al., 2017)—but other student characteristics may act as confounding factors. For instance, students with low levels of self-control may use their phone more often in class, study less intensively outside of class, and perform worse on academic outcomes, with phone use a symptom of limited self-control rather than a cause of lower grades (Wilmer & Chein, 2016). Likewise, grades and smartphone use may jointly reflect contextual factors at the course level, such as topic, instructor, room, and class characteristics, which may limit the external validity of prior research reliant on single-course observations.
In the present study, we used a mobile app to unobtrusively log students’ complete attendance and smartphone use across multiple courses over a period spanning 2 academic years. This enabled us to examine the link between students’ average smartphone use and average grade as well as the relationship between students’ course-specific use and performance. Additionally, we combined these data with a wide range of individual background controls, including administrative data on high school academic performance, socioeconomic background, and surveyed personality measures. We employed a novel measure of in-class smartphone use to investigate the primary hypothesis that higher nonacademic device use during class is associated with worse student performance. We expected to find a moderate to large negative relationship between students’ smartphone use and grades both when estimating with a cross-sectional model, consistent with the existing literature, and when estimating with a fixed-effects model that leveraged the dynamic nature of our panel data to control for unobserved student and course characteristics.
Method
Participants
We collected data from September 2013 to September 2015 as part of the Copenhagen Networks Study (Stopczynski et al., 2014). Our study used data from 470 students at the Technical University of Denmark. Students volunteered to receive a smartphone that continuously recorded various behavioral measures over a 2-year period, including location, social interactions among participants, and whether the phone screen was turned on. The study was approved by the Danish Data Supervision Authority in 2013 and involved dynamic informed consent. After consenting to participate in the study, students had access to download their own logged data and could withdraw from the study and have their data deleted at any time (see Stopczynski et al., 2014). We planned to terminate data collection after 2 years because of the anticipated costs of maintaining data collection, replacing broken phones, and attrition over time. The size of our sample far exceeds those of earlier observational studies using smartphones in terms of both individuals followed and data points per individual (Felisoni & Godoi, 2018; Kim et al., 2019). Table 1 displays descriptive statistics for the 470 students meeting the inclusion criteria, outlined below, at the start of the study in September 2013.
Descriptive Statistics for the 470 Students in the Sample
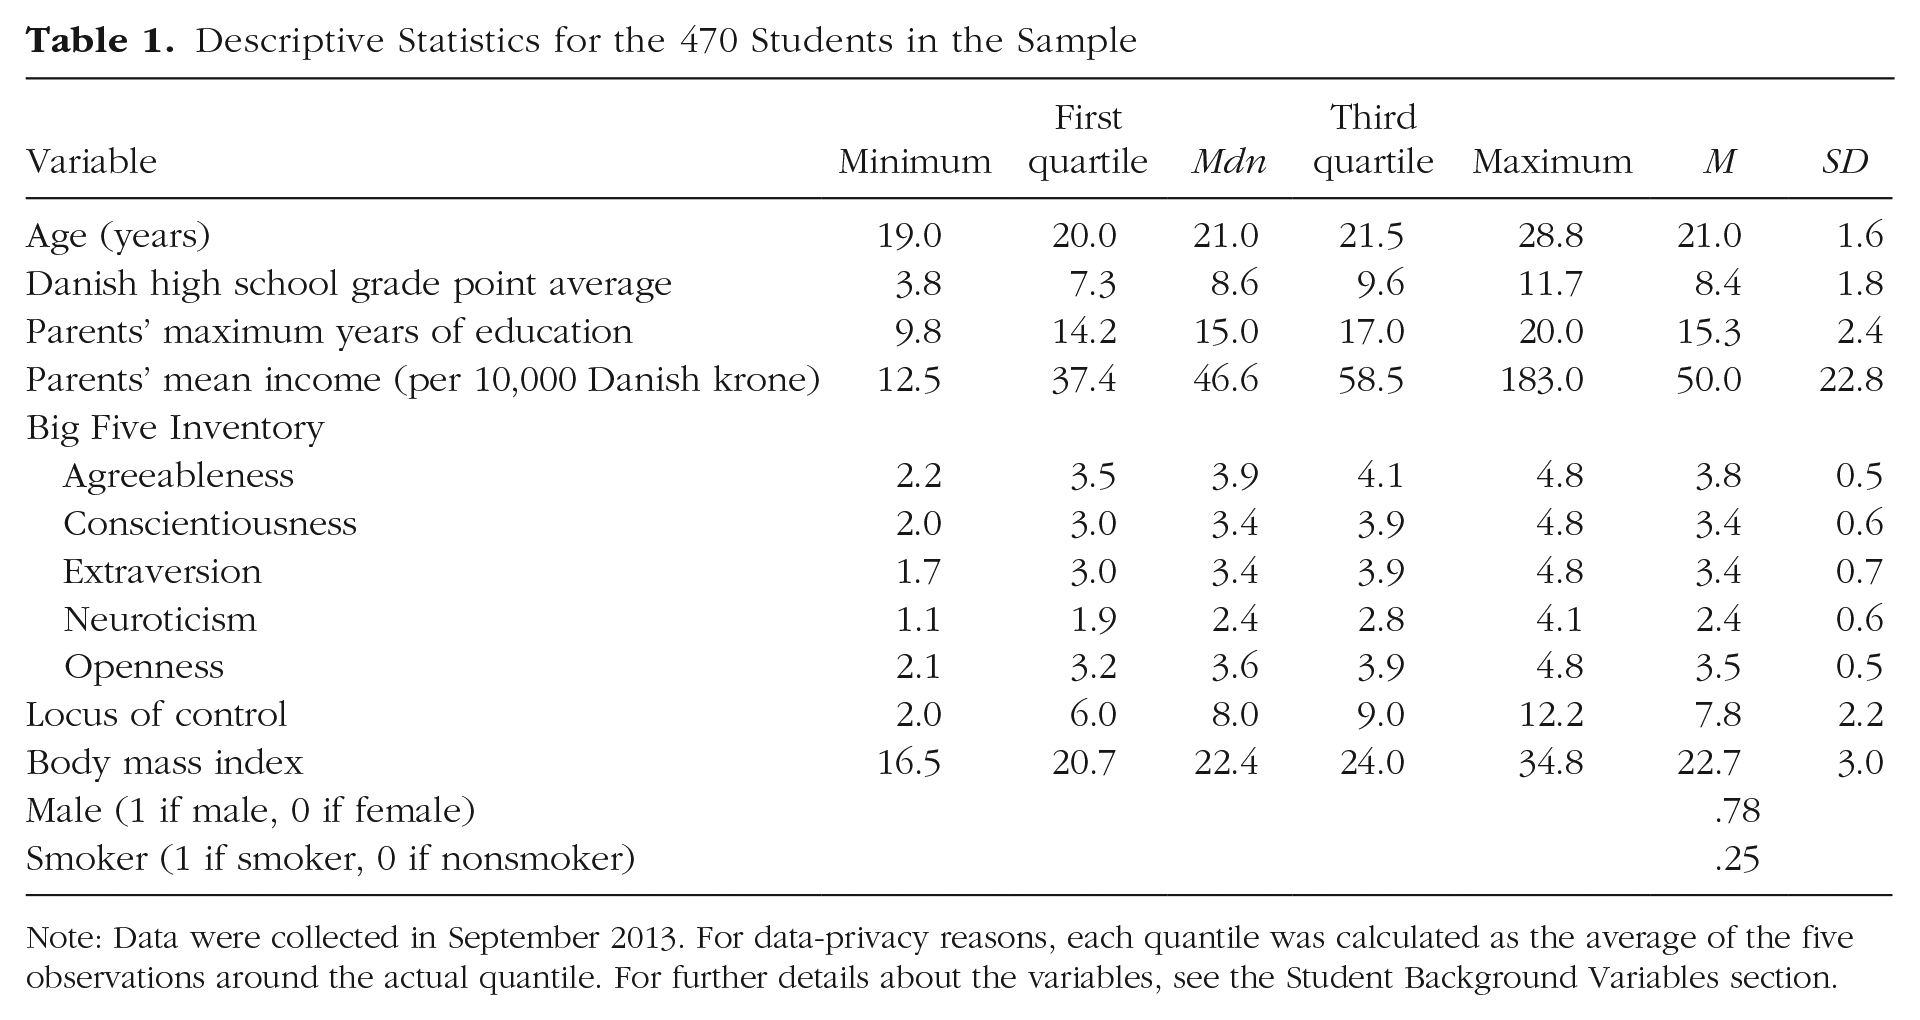
Note: Data were collected in September 2013. For data-privacy reasons, each quantile was calculated as the average of the five observations around the actual quantile. For further details about the variables, see the Student Background Variables section.
Students in the Copenhagen Networks Study were excluded from the analysis if they met any of the following criteria: They had no grade data (76 students), attended fewer than 10 hr of course classes (60 students), were missing background variables (157 students), were enrolled in only one graded course (44 students), or were enrolled in courses with no other participants of our study (three students). After applying these criteria to the initial sample of 810 students, we excluded 340 students. Additional details of the data-filtering process are described in the Supplemental Material available online, in which we also confirm that our results are robust to including the students with minimal class attendance and the students with missing background variables in the analysis.
Measures
Smartphone use
For each student, we computed a measure of phone usage at the 15-min level by aggregating the time during which the screen of the student’s phone was turned on during each 15-min time bin of the experiment. We also measured each student’s attendance in scheduled classes by merging administrative data from the Technical University of Denmark about the location of the student’s scheduled classes with mobile-device geolocation data (for details about how we inferred attendance, see Kassarnig, Bjerre-Nielsen, Mones, Lehmann, & Lassen, 2017). We combined these two measures to compute in-class smartphone use. This variable measured—for each course in which a student was enrolled—the percentage of attended class time that the student spent with his or her phone screen turned on (for details about how we addressed breaks between classes, see the Supplemental Material). As an example, let sij denote the value of in-class smartphone use for student i in course j: If sij is equal to 5, it means that student i’s phone screen was turned on 5% of the time that he or she attended classes in course j. In our cross-sectional analysis, we employed each student’s average in-class smartphone use across all attended courses as our measure of smartphone use. We also computed out-of-class smartphone use, which measured the percentage of time between 6 a.m. and 1 a.m. that a student’s mobile-device screen was turned on and the student was not attending class. Table 2 displays descriptive statistics for the smartphone-use measures.
Descriptive Statistics for the Variables Collected During the Study
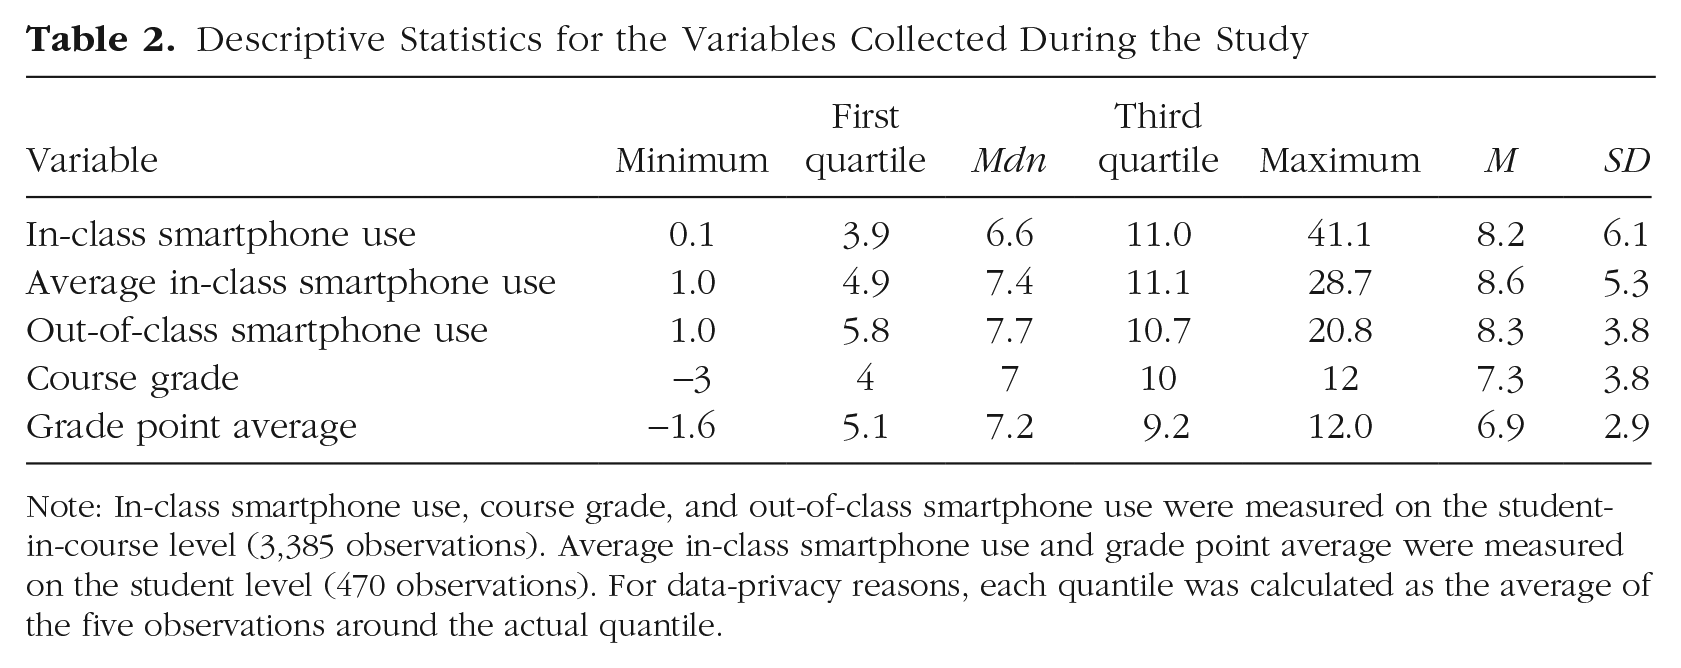
Note: In-class smartphone use, course grade, and out-of-class smartphone use were measured on the student-in-course level (3,385 observations). Average in-class smartphone use and grade point average were measured on the student level (470 observations). For data-privacy reasons, each quantile was calculated as the average of the five observations around the actual quantile.
When activated by an event, such as receiving a text message or pressing a button, smartphones have a default period of time before the screen turns off. Our measure of smartphone use could therefore include time intervals in which the student’s attention was not directed toward the phone, but the screen was still turned on. Our data suggest that the most prevalent default turn-off times are 10 s and 30 s (for details, see the Supplemental Material). Because almost all of the smartphone use in our sample was in sessions longer than 35 s, and intermittent periods of screen activation can still captivate attention, we assumed that our measure of smartphone use exclusively recorded time when the student was attending to his or her phone.
We did not observe what kind of phone activity the students engaged in. Thus, our measure of smartphone use did not divide device activity into academic and nonacademic use. Although this is a limitation of the tracking app used in this study, prior research indicates that the majority of in-class device use typically consists of nonacademic activities, such as texting and social media (Appel, Marker, & Gnambs, 2020; Gehlen-Baum & Weinberger, 2014; Ravizza et al., 2017). Furthermore, in contrast to the online-activity measures used in previous studies, our measures captured all smartphone screen exposure, including both online and off-line (e.g., app based and system based) mobile-device interactions, all of which can occupy attention.
Academic performance
We obtained the students’ course grades and study programs from university administrative records. Grades were given on the Danish grading scale and consisted of seven possible values: −3, 0, 2, 4, 7, 10, and 12. In our cross-sectional analysis, we used each student’s average grade across all courses, whereas the panel analysis employed the course-specific grades. Table 2 displays descriptive statistics for the course grades and grade point averages (GPAs).
Student background variables
We obtained various student characteristics for our sample by merging it with two sources. First, we obtained surveyed personality measures (the Big Five Inventory and locus of control) and health status (body mass index and whether the student smoked cigarettes) from the Copenhagen Networks Study itself. The Big Five Inventory and locus of control were measured with the standard survey items administered at the beginning of the study period (Goldberg, 1993; Rotter, 1993). The distribution of personality traits in the Copenhagen Networks Study was previously shown to be unbiased with regard to the general population of Western Europe (Stopczynski et al., 2014). Second, these data were anonymized and merged with national registries on secure servers with limited access at Statistics Denmark. Here, we obtained student age, gender, and high school GPAs as well as mean annual income and maximum number of years of education of students’ parents. Parental mean annual income was measured in units of 10,000 Danish krone. As a proxy for intelligence, high school GPAs were computed from grades on the same scale as the university grades (Roth et al., 2015).
Structure of the data
The filtered data had 3,385 observations, each containing the grade, in-class smartphone use, and student background variables of a specific student in a specific course. Each observed student participated in multiple courses, and each observed course had multiple students who were part of our experiment. However, each student did not participate in all observed courses, and each course did not contain all observed students as participants. Thus, our data were structured as an unbalanced panel (Wooldridge, 2010). The median number of recorded courses per student was seven, and the median number of observed students per course was six. The data contained 470 unique students and 401 unique courses.
We used our panel data to construct cross-sectional data by averaging each student’s grades and in-class smartphone use across all the student’s courses. The resulting data set had 470 observations, each containing the average grade, average in-class smartphone use, and background variables of a specific student. We refer to models estimated on the panel data set as panel models and to the models estimated on the cross-sectional data set as cross-sectional models. An advantage of the panel models relative to cross-sectional models is that they allow for estimation of within-student effects instead of only between-student effects (Orben et al., 2019).
Sample-size determination
Our data were collected as part of the longitudinal Copenhagen Networks Study (Stopczynski et al., 2014), which was conducted prior to the formulation of our research question. Thus, as in other recent research employing digital traces from large behavioral data sets (Rafaeli, Ashtar, & Altman, 2019), our sample size was not predetermined by our research question or expected effect size. However, compared with the sample size and observation period in previous similar observational studies (see the introduction), those in the present study were respectively larger and longer. Moreover, we did select our models and construct our variables prior to seeing the results of the models.
Models
Models using panel data
Table 3 displays the specifications of the models that we estimated on our panel data. The grade and in-class smartphone use of student i in course j are denoted by gij and sij, respectively. All the models estimated linear associations between course grades and smartphone use, but each model controlled for a different set of additional explanatory variables. We considered Model 1e the most accurate estimator of the linear effect of in-class smartphone use on grades because the student- and course-specific intercepts μ i and η j controlled for all student and course characteristics that remained fixed during the study. Examples of such student characteristics are gender, age at baseline, intelligence, stable personality traits, impulsivity, persistent anxiety, and the socioeconomic conditions of the student’s upbringing. Examples of such course characteristics include quality of the teacher, difficulty of the course material, class size, and room layouts. We therefore considered Model 1e to be our main model, and we estimated the other models only to enhance our understanding of it. In this section, we therefore first present Model 1e, and then we explain why each of the other models is interesting as a point of comparison.
Panel-Model Specifications
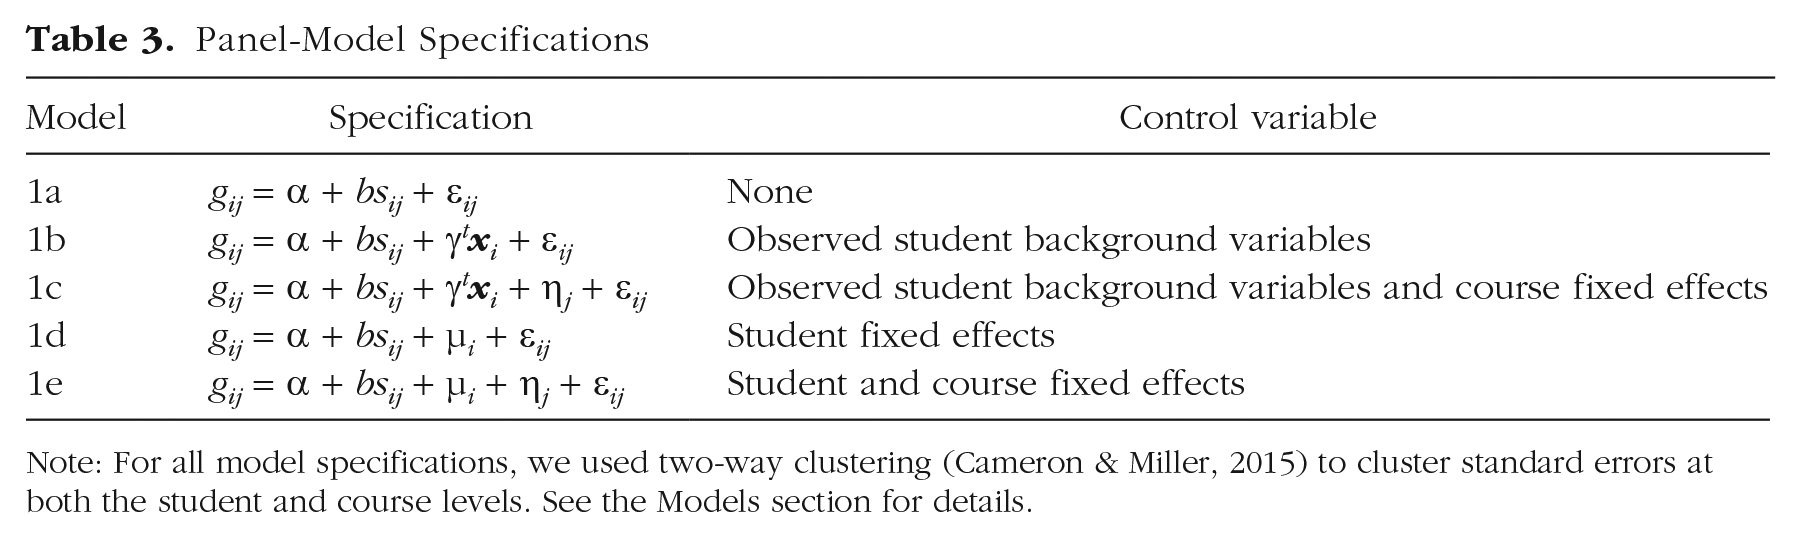
Note: For all model specifications, we used two-way clustering (Cameron & Miller, 2015) to cluster standard errors at both the student and course levels. See the Models section for details.
Model 1e is an example of a type of panel model called a fixed-effects model (McNeish & Kelley, 2019; Wooldridge, 2010), and the student- and course-specific intercepts μ i and η j , respectively, are called the student and course fixed effects. Estimation is possible with a standard linear regression, where μ i and η j are estimated by encoding each student and course as a dummy variable. The main advantage of a fixed-effects model is consistent estimation of model parameters under weaker assumptions about the data, whereas mixed-effects models, traditionally more prevalent in psychological research for clustered data, rely on stronger statistical assumptions in order to be consistent (McNeish & Kelley, 2019; Wooldridge, 2010). The key additional assumption of mixed-effects models is the exogeneity assumption, which requires that the student- and course-specific intercepts be random and thus uncorrelated with in-class smartphone use (McNeish & Kelley, 2019; Wooldridge, 2010). This assumption is more justifiable in experimental studies, in which the variable of interest can be random by design. However, in observational studies such as ours, this strong assumption was likely to be violated (McNeish & Kelley, 2019) because unobserved individual and course characteristics were almost certainly correlated with in-class smartphone use. For example, low teacher quality, which was unobserved, could have affected both smartphone use and grades. Indeed, we view the strength of our panel-data approach as residing in the fact that it could control for such confounding student and course characteristics even when they were unobserved. In addition to these theoretical considerations, our choice of a fixed-effects model over a mixed-effects model was also supported by a Hausman specification test, χ2(1, N = 3,385) = 8.48, p = .004, which is the standard statistical test used to assess the consistency of a null model with random effects against the corresponding fixed-effects model (Wooldridge, 2010).
To make our results comparable with those of the existing observational studies, we estimated Model 1b, which is a pooled model. This model was simply a linear regression of course grade on observed student characteristics, similar to the cross-sectional model below but with an observation per student-in-course combination (thus, multiple observations per student). Therefore, Model 1b ignored the panel structure of the data and thus had neither mixed nor fixed effects. The vector xi in the model specification (see Table 3) contains the values of the observed background variables 1 for student i. Similar to the models in existing observational studies, Model 1b controlled only for observed student characteristics when assessing the association between device use and academic performance. Consequently, its estimate of b is inconsistent if grades and in-class smartphone use are confounded by variables omitted by the researcher (Wooldridge, 2010). Substantial differences between the estimates of b in Models 1b and 1e thus suggest that there are important confounding factors that were not captured by our background variables.
We estimated Models 1a, 1c, and 1d to investigate how the estimated coefficient of in-class smartphone use responded to the addition of different controls. Model 1a provided a baseline without any controls. Model 1c controlled for observed student characteristics and course fixed effects but not student fixed effects. Model 1d controlled for student but not course fixed effects.
To account for the fact that two or more data points belong to the same individual or course (i.e., the panel structure), we adjusted the standard errors. This is analogous to the procedure for random effects, in which standard errors are computed such that they reflect sampling clusters, which in our case were students and courses. We followed Cameron and Miller (2015) and used two-way clustering to cluster standard errors at both the student and course levels. This clustering of standard errors accounts for possible correlation of error terms within individuals and courses (Cameron & Miller, 2015).
Cross-sectional model
To make our research comparable with the existing literature, we also estimated a linear regression model with the cross-sectional data (Model 2), which had the following specification:
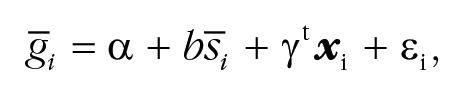
where
Results
We first report correlation measures, proceed with the output of the panel models (Models 1a–1e in Table 3), and finish by comparing these with the output of our cross-sectional model (Model 2).
Correlations
To make our study more comparable with prior investigations, we compared our estimated correlation coefficient between students’ average smartphone use across courses and GPAs with estimates from earlier observational studies (see Table 4). Our estimated correlation (r = −.32) is similar in magnitude to most previously found correlations. Its 95% confidence interval (CI), [−.40, −.24], contains correlations from four of the six earlier studies. The CI was estimated from 10,000 bootstrap samples.
Correlation Coefficients Between Measures of In-Class Multitasking and Measures of Academic Performance From Previous Observational Studies and the Present Study

Note: GPA = grade point average.
Figure 1 shows the pairwise correlations between students’ background variables and their GPA, average in-class smartphone use across all attended courses, and out-of-class smartphone use. The left-hand plot shows that students’ GPA was more strongly correlated with in-class smartphone use than with any of the student background variables, except for high school GPA. This shows that there is a substantial negative association between smartphone use and GPA, although it might not be a causal relationship. The center plot shows that in-class smartphone use was almost as strongly correlated with high school GPA as with university GPA. One explanation for this is that students with high smartphone use in university courses may also have been heavy smartphone users in high school, which could conceivably have contributed to a lower high school GPA. Another explanation, however, is that both correlations are caused by underlying student characteristics that confound smartphone behavior and academic performance in both high school and university learning environments. Further, the figure shows that a number of the background variables were positively correlated with in-class smartphone use but negatively associated with GPA and vice versa. This suggests that at least part of the observed correlation between smartphone use and GPA is explained by confounding factors measured by the subset of background variables that we observed. Finally, the right-hand plot shows that in-class smartphone use and out-of-class smartphone use were highly correlated (r = .66). However, compared with in-class use, out-of-class use was a weaker predictor of GPA.

Correlations and between-group differences for grade point average, average in-class smartphone use, and average out-of-class smartphone use. The top row shows correlations between students’ background variables and each of the three key variables. The bottom row shows mean differences between gender (men – women) and between smokers (smokers – nonsmokers), separately for each of the three key variables. Error bars show 95% confidence intervals. We calculated the confidence intervals by bootstrapping the data 10,000 times, determining the values on each of the bootstrapped samples, and taking the 5th and 95th percentiles as the end points of the intervals.
Models using panel data
Table 5 reports the results of our models based on panel data. Model 1e’s estimate of b is around one third of the estimate found by Model 1b, and Model 1e’s CI for b does not include the estimate found by Model 1b. As explained in the Method section, this suggests that the estimate found by Model 1b was severely biased because of confounders that were not fully captured by the student background variables. The majority of the bias is explained by the student fixed effects—this is seen in the substantial difference when the model controlled for all stable student traits (including latent characteristics) compared with only the measured student background variables (compare either the results of Model 1d with Model 1b or the results of Model 1e with Model 1c). The fixed course control accounted for the remaining drop in coefficient size (compare either the results of Model 1e with Model 1d or the results of Model 1c with Model 1b). This suggests that latent confounders primarily consisted of student traits, followed by contextual course characteristics. In the Discussion section, we consider why students’ disposition of self-control (Ridder, Lensvelt-Mulders, Finkenauer, Stok, & Baumeister, 2012) is one candidate for such an unobserved confounding student trait, among others.
Estimated Effect of In-Class Smartphone Use on Student Course Grades

Note: The specifications of the models can be found in Table 3. The
Finally, we note that—like the rest of our panel models—Model 1e’s estimate of b is negative and its CI contains mostly negative values. This suggests that higher in-class smartphone use is associated with lower course grades, even when models control for all fixed student and course traits. However, the estimated association is quite small; the standardized coefficient shows that increasing smartphone use by 1 standard deviation (6.1%) is associated with only a 0.045 decrease in standardized grades. The CI includes zero, but only barely. Thus, if our results were to be interpreted as a failure to reject the null hypothesis that there is no effect of in-class smartphone use, this conclusion would be very sensitive to choice of confidence band. 2
Cross-sectional model
As expected, the estimate of b found by the cross-sectional model (Model 2) was close to the estimate found by the panel model that controlled for only observed background variables (Model 1b in Table 5), and the two models had largely overlapping CIs for b. Thus, the cross-sectional model estimated the regression coefficient of average in-class smartphone use as −0.099 (95% CI = [−0.142, −0.056]). Estimating the cross-sectional model with standardized grades and standardized average in-class smartphone use yielded a regression coefficient of −0.181 for smartphone use. Thus, a 1-standard-deviation increase (5.3%) in students’ average in-class smartphone use predicts that the student’s GPA is 0.181 standard deviations lower under the cross-sectional model. In summary, the cross-sectional model reproduces the findings of existing cross-sectional studies, showing a negative and moderate association between students’ in-class device use and academic performance, even when controlling for a broad range of student background variables. However, this association should not be interpreted as a substantive causal relation because the results of our panel models suggest that such estimates are likely biased away from zero because of unobserved confounders. A full regression table for the cross-sectional model can be found in the Supplemental Material.
Discussion
Unlike previous research, the present study inspected the influence of directly recorded in-class mobile-device use and academic performance across multiple courses and years for a large cohort of university students. When we modeled a cross-sectional analysis (Model 2) on a data set with one observation per individual—in accordance with the existing literature—we confirmed the hypothesis that higher in-class smartphone use, averaged across courses, was associated with a substantially lower average grade, even when controlling for a broad range of observed background variables. As expected, a similar association between students’ course grades and smartphone use was found on a data set with multiple observations per individual in a model with the same set of measured control variables (Model 1b). However, when we leveraged the panel data to control for all fixed student and course characteristics (Model 1e), we found that the magnitude of the estimated association decreased substantially, and although it remained mostly negative, its CI included zero. As discussed in the Results section, this difference suggests that the association between grades and in-class smartphone use was confounded both by student characteristics that were not captured by our student background variables and by contextual effects from course characteristics.
Students’ disposition of self-control (Ridder et al., 2012) is one possible candidate for a confounding student trait that we did not directly observe in our data. Recent studies found that—after controlling for Big Five Inventory personality domains—self-control capacity explained behavioral differences in delaying immediate device use (Berger, Wyss, & Knoch, 2018; Wilmer & Chein, 2016), and a recent review found that self-control positively predicts academic performance (Duckworth, Taxer, Eskreis-Winkler, Galla, & Gross, 2019). Thus, high levels of in-class smartphone use might primarily be a signal of low self-control and not itself a substantial cause of lower academic performance. Notably, our extensive set of measured background control variables (Model 1b) did include behavioral and cognitive correlates of self-control (body mass index, smoking status, locus of control, and personality domains). However, adding fixed effects to control for all stable student and course characteristics (Model 1e) yielded both a substantial additional increase in variance explained and a drop in the estimated coefficient of smartphone use, suggesting two candidate possibilities. First, these observed controls may function as poor proxies for the full set of latent cognitive and neurobehavioral characteristics that compose the construct of self-control. Second, other unmeasured or as-of-yet unidentified student traits may further confound the association between in-class smartphone use and performance. Given the magnitude of additional variance explained and the decline in the coefficient of smartphone use by the inclusion of student and course fixed effects, it is very possible that one or more unobserved individual and contextual traits jointly influence smartphone use and academic performance. In this regard, our results also suggest that research on device use and learning should not neglect the role of contextual course-level factors that may influence learning and device use (Stokols, 2018). Researchers who control for—or directly investigate—the influence of both course-specific traits (teaching style, teacher engagement, course topic, student density, student-teacher visual access) and place-based characteristics (lighting, noise levels, classroom size, seating arrangements) can contribute practical insights about the context of in-class smartphone use. Thus, in the future, researchers investigating device use and performance should try to explore these psychological and contextual frontiers. To this end, panel models can provide a pragmatic tool for comparing models that control for all unobserved stable individual or contextual characteristics with models without fixed effects that control for only the limited subset of measured confounds. Contrasting the variance explained and the magnitude of drop in coefficient size between models with and without fixed effects can help to assess omitted variable bias. Our results strongly suggest that our uncertainty about not-well-understood psychological and environmental mechanisms that may jointly influence smartphone use and academic performance should be considerable.
Our findings seem at odds with the randomized controlled trials that found that nonacademic device use causes demonstrably worse performance (Risko et al., 2010; Wood et al., 2012). Apart from the aforementioned concerns of external validity, one possible explanation for this discrepancy might be that students’ in-class smartphone use has little to no variation across courses, making it impossible to disentangle its influence from confounding factors (e.g., self-control) in a model that included student-specific intercepts. We address this concern in the Multicollinearity in Fixed Effects Models section in the Supplemental Material. Another explanation is that our measurement of mobile-device use did not include adjacent laptop use. If students switch nonacademic device use from smartphone to laptop in some courses but not others, the student-level variation of in-class smartphone use could contain noise, and such noise could potentially account for finding little or no correlation between course-specific in-class smartphone use and grades. However, another advantage of using course fixed effects is that they remove such noise at the aggregate level, including systematic switching between smartphones and laptops caused by teaching style, teacher quality, availability of the Internet, and lack of battery in afternoon classes. What is left are students’ idiosyncratic differences across courses, which is likely to be less of a problem.
Still, one limitation of this study is that we observed only in-class device use for smartphones. As already discussed in the Measures section, another caveat is that we did not observe the specific mobile phone apps and on-screen activities that constituted overall device use. An additional limitation is that our sample consisted of Danish university students who selected to participate. Some selection was internal to the student body. We can see that nonparticipants had a slightly lower GPA (Kassarnig et al., 2018), so our results speak for the subpopulation tracked.
In conclusion, results from our panel-data analysis of 2 years of student smartphone activity challenge the interpretation of existing empirical results on digital-device use and academic outcomes. Our results suggest that there are individual and course traits that confound the relationship between in-class device use and academic performance and that these are difficult to control for with salient background covariates. Critically, our results indicate that controlling for all fixed individual and course factors reduces the estimated negative effect of in-class smartphone use on academic performance by almost two thirds (see Table 5). Researchers and educators should therefore exercise caution when estimating correlations between in-class device use and academic performance from cross-sectional data, even with a rich set of controls. In particular, they should avoid making causal claims from this type of observational data. Instead, individuals seeking to establish causality in real-world learning settings should pursue observational or quasiexperimental studies with research designs that are more suited for robust causal inference than cross-sectional studies. These studies should ideally unobtrusively observe all of students’ electronic-device activity across courses and over several terms.
Supplemental Material
Bjerre-Nielsen_Supplemental_Material_rev – Supplemental material for The Negative Effect of Smartphone Use on Academic Performance May Be Overestimated: Evidence From a 2-Year Panel Study
Supplemental material, Bjerre-Nielsen_Supplemental_Material_rev for The Negative Effect of Smartphone Use on Academic Performance May Be Overestimated: Evidence From a 2-Year Panel Study by Andreas Bjerre-Nielsen, Asger Andersen, Kelton Minor and David Dreyer Lassen in Psychological Science
Footnotes
Acknowledgements
We thank Robert Böhm for helpful suggestions. We also thank participants at the Center for Economic Behavior and Inequality for helpful discussion and comments.
Transparency
Action Editor: Bill von Hippel
Editor: D. Stephen Lindsay
Author Contributions
A. Bjerre-Nielsen developed the study concept. A. Bjerre-Nielsen and D. D. Lassen designed the study, with contributions from K. Minor and A. Andersen. A. Andersen preprocessed the data under the guidance of A. Bjerre-Nielsen. A. Andersen and A. Bjerre-Nielsen analyzed the data, and all the authors interpreted the results. A. Andersen, A. Bjerre-Nielsen, and K. Minor drafted the manuscript. All the authors provided critical revisions and approved the final manuscript for submission.

Notes
References
Supplementary Material
Please find the following supplemental material available below.
For Open Access articles published under a Creative Commons License, all supplemental material carries the same license as the article it is associated with.
For non-Open Access articles published, all supplemental material carries a non-exclusive license, and permission requests for re-use of supplemental material or any part of supplemental material shall be sent directly to the copyright owner as specified in the copyright notice associated with the article.
