
Abstract
Previous research suggests that choice causes an illusion of control—that it makes people feel more likely to achieve preferable outcomes, even when they are selecting among options that are functionally identical (e.g., lottery tickets with an identical chance of winning). This research has been widely accepted as evidence that choice can have significant welfare effects, even when it confers no actual control. In this article, we report the results of 17 experiments that examined whether choice truly causes an illusion of control (N = 10,825 online and laboratory participants). We found that choice rarely makes people feel more likely to achieve preferable outcomes—unless it makes the preferable outcomes actually more likely—and when it does, it is not because choice causes an illusion but because choice reflects some participants’ preexisting (illusory) beliefs that the functionally identical options are not identical. Overall, choice does not seem to cause an illusion of control.
Choice confers obvious benefits: It allows people to acquire either objectively better or subjectively more preferred options rather than worse, less preferred options. In addition, research suggests that choice confers nonobvious benefits as well. Decades of evidence suggest that even when all options are functionally identical (e.g., lottery tickets with an identical chance of winning), having a choice imbues people with an illusory sense of control, a feeling that they are more likely to achieve preferable outcomes (e.g., winning a lottery; Langer, 1975; Nichols, Stich, Leslie, & Klein, 1996; Wohl & Enzle, 2002; Wortman, 1975). Although such an illusory sense of control can distort people’s judgments or decisions, it has also been hypothesized to provide numerous psychological and physiological benefits (Plous, 1993; Taylor & Brown, 1988). Accordingly, this research has been taken as evidence that choice can have significant welfare effects, even when it is trivial, incidental, or illusory and does not necessarily allow people to acquire better, more preferred options (Botti & Iyengar, 2004; Huang, Wang, & Shi, 2009; Iyengar & Lepper, 2000; Leotti & Delgado, 2011; Patall, 2019).
The claim that choice causes an illusion of control has its roots in studies investigating lotteries, in which all options have an identical chance to win. Langer (1975) famously reported that people who chose their own lottery ticket were more reluctant to sell or exchange their ticket than people who were assigned a ticket, suggesting that choice made people feel more likely to win the lottery. This finding has been highly influential, as reflected in its high citation count (i.e., > 5,000 on Google Scholar) and its acceptance among many scholars as an empirical fact. For example, the seminal article by Iyengar and Lepper (2000) references this work and says “many important theories in social psychology . . . all presume that even purely illusory perceptions of choice will have powerful effects” (p. 995). The influential textbook by Aronson (2012) also states that “the illusion of control . . . is a powerful one. It is small wonder that most state lotteries allow us to select our own numbers” (p. 169). Likewise, when we started this research, we had every expectation that the effect would be robust.
However, our investigation has led us to a different conclusion. In this article, we suggest that (a) some of the most-cited evidence for this notion is susceptible to alternative explanations, (b) the phenomenon rarely occurs in well-controlled experiments, and (c) when it does, it is not because choice causes an illusion of control but rather because choice reflects some participants’ preexisting beliefs that functionally identical options are not actually identical.
Reexamining Past Research Evidence
Although Langer’s (1975) studies are widely cited as showing that choice causes an illusion of control, those findings on reluctance to sell or exchange one’s lottery ticket are susceptible to alternative explanations. First, because the lottery tickets in these studies featured different football players, letters, or symbols, participants who chose their ticket may have simply liked their ticket more for featuring their preferred player, letter, or symbol. Second, given that active decisions tend to trigger greater anticipated regret, participants who actively chose their ticket may have anticipated greater regret from forgoing their ticket and seeing it win (Kahneman & Miller, 1986; Risen & Gilovich, 2007; van de Ven & Zeelenberg, 2011). Thus, participants who chose their ticket may have been more reluctant to sell or exchange their ticket without necessarily feeling that their ticket was more likely to win. Similarly, other researchers have suggested that some patterns that appear consistent with a choice-driven illusion of control could also result from alternative factors (e.g., other forms of active involvement, enjoyment associated with “special numbers,” or regressive estimates of one’s control) or are not always replicable (Filippin & Crosetto, 2016; Gino, Sharek, & Moore, 2011; Goodman & Irwin, 2006; Kühberger, Perner, Schulte, & Leingruber, 1995; Martinez, Bonnefon, & Hoskens, 2009).
There is also a separate, more subtle problem with research on the choice-driven illusion of control: Some participants who are faced with functionally identical options may not believe that the options are functionally identical. To illustrate, imagine that people are asked to choose among three lottery tickets and that they are told that all three are equally likely to win. Also imagine that, despite that instruction, some participants incorrectly believe that the ticket presented in the middle is more likely to win. If given a choice, those participants will choose the middle ticket and, consistent with their prior beliefs, will indicate that it is more likely to win. However, if instead they are randomly assigned a ticket, the majority of those participants will not be assigned the middle ticket and thus will not indicate that their ticket is more likely to win. Overall, then, participants who choose their tickets will judge their ticket to be more likely to win than those who are assigned their ticket. However, this is not because choice causes an illusion of control but rather because choice reflects a preexisting belief that some options are more likely to win than the others, despite instructions to the contrary.
Statement of Relevance
Does choice cause an illusion of control? Our literature and textbooks say “yes.” They say that having a choice makes people feel more likely to achieve preferable outcomes, even when they are selecting among functionally identical options (e.g., lottery tickets that have identical odds of winning). To test whether choice truly causes an illusion of control, we conducted 17 experiments with more than 10,000 participants. We found that having a choice did not make people feel (or act as if they felt) more likely to achieve preferable outcomes when the options were functionally identical. Even when choice seemed to have such effects, the underlying cause was not choice but people’s preexisting beliefs that the functionally identical options were not identical (i.e., they falsely believed that some lottery options were more likely to win). Overall, our evidence suggests that choice does not cause an illusion of control. Rather, its effect is simple: It allows people to get what they want.
Thus, to establish evidence that choice causes an illusion of control, researchers need to demonstrate two things, in a context in which all options are functionally identical: (a) Choosers feel more likely to achieve preferable outcomes than do nonchoosers, and (b) this is caused by the choice and is not reflective of preexisting beliefs.
The Present Research
In this article, we report the results of 17 highly powered preregistered studies (total N = 10,825) that examined whether choice causes an illusion of control. Specifically, these studies tested whether people faced with a choice among functionally identical options feel—or act as if they feel—more likely to achieve preferable outcomes than those without such a choice, and, if they do, whether choice causes this illusion. All of our study materials, data, and code are available on OSF at https://osf.io/g2cbe/, and the links to our preregistrations are provided in the Open Practices section below.
Studies 1 to 9
Method
Participants
We conducted Studies 1 to 7 on Amazon Mechanical Turk (MTurk), using lotteries as stimuli. We requested 800 participants per study for Studies 1 and 2, 400 per study for Studies 3 and 4, 800 for Studies 5 and 6, and 400 for Study 7. In this research, we selected these large samples of up to 200 participants per condition to achieve better statistical power and reliability. In Studies 1 to 7, we excluded responses from participants who did not complete the entire survey or who did not submit their work on MTurk with the correct completion code. In case any participant completed the survey more than once, we excluded responses with later start times. Across Studies 1 to 7, we excluded 138 incomplete and 14 complete responses, and achieved sample sizes that closely approximated our plans (Table 1). In Studies 1 to 7, the average age ranged from 36 to 40 years, and the percentage of women ranged from 41% to 60%.
Summary of the Results From Studies 1 to 9

Note: DV = dependent variable.
There was no significant interaction effect between choice and timing of choice in either Study 1, b = 0.09, t(790) = 0.39, p = .700, or Study 2, b = 0.01, t(796) = 0.06, p = .953.
There was a significant interaction effect between choice and baseline liking for dark chocolates (mean-centered) on predicted satisfaction, b = −0.23, t(297) = −2.85, p = .005, indicating that the effect of baseline liking on predicted satisfaction was smaller in the choice condition than in the no-choice condition. There was no significant interaction effect between choice and baseline liking on actual satisfaction, b = −0.10, t(297) = −0.98, p = .327. Including or excluding baseline liking did not substantively change the effects of choice on either predicted or actual satisfaction.
This DV was not preregistered.
We conducted Study 8 on MTurk and Study 9 in the Wharton Behavioral Lab at the University of Pennsylvania, using chocolates as stimuli. We requested 400 participants in Study 8 and at least 450 in Study 9. In Study 8, we applied the same exclusion criteria as in Studies 1 to 7 and accordingly excluded one incomplete and two complete responses. In Study 9, we excluded 15 incomplete and no complete responses. In both studies, we achieved sample sizes that closely approximated our plans (see Table 1). In Study 8, the average age was 36 years, and the percentage of women was 47%. In Study 9, the average age was 23 years, and the percentage of women was 68%.
Procedure
In Studies 1 and 2, participants played a lottery, following common paradigms in previous research (Charness & Gneezy, 2010; Dixon, 2000; Dunn & Wilson, 1990; Fellner, 2009; Koehler, Gibbs, & Hogarth, 1994; Langer, 1975; Nichols et al., 1996). In these studies, each participant was randomly assigned to one of four conditions in a 2 × 2 design: Choice (choice vs. no choice) × Timing of Choice (choice first vs. choice last). Participants in the choice condition chose three different integers from 1 to 6, whereas participants in the no-choice condition were assigned three different randomly selected integers from 1 to 6. In addition to this choice manipulation, we also varied the timing of choice. Specifically, participants in the choice-first condition chose or were assigned the numbers before the lottery’s winning number was determined, whereas participants in the choice-last condition chose or were assigned the numbers after the winning number had already been determined but before it was revealed. Motivated by research showing that people tend to believe that they have more control over future than past outcomes (Williams & LeBoeuf, 2020), we hoped to examine whether the timing of choice moderates the effects of choice on the illusion of control. The winning number in these studies was randomly selected by the computer for each participant. If a participant’s three numbers included the winning number, then the participant would win the lottery and receive a $0.20 bonus. We used this small bonus amount because past studies have suggested that the illusion of control was more likely to be in evidence for smaller stakes than larger stakes (e.g., $0.50 vs. $5.00; Dunn & Wilson, 1990).
After participants’ numbers were chosen or assigned, we assessed participants’ subjective likelihood of winning. In Study 1, we asked participants, “How likely do you feel you are to win this lottery?” They responded on a 9-point scale ranging from 1 (extremely unlikely) to 9 (extremely likely). In Study 2, we used a more feeling-based measure of subjective likelihood. First, we asked participants, “How do you feel about your numbers?” They responded on a 7-point scale ranging from 1 (I feel like my numbers have a very poor chance of winning) to 7 (I feel like my numbers have a very good chance of winning). Then, we asked them, “How confident/unconfident do you feel that you will win this lottery?” They responded on a 7-point scale ranging from 1 (extremely unconfident) to 7 (extremely confident). The two measures were highly correlated, r(798) = .77, p < .001, and we averaged them to create a measure of subjective confidence.
In Study 3, participants played a similar lottery, but the key dependent variable was incentive compatible: the amount wagered on the outcome of the lottery (Dunn & Wilson, 1990). In this study, each participant was randomly assigned to either the choice or the no-choice condition. Participants in the choice condition chose an integer from 1 to 6, whereas participants in the no-choice condition were randomly assigned one of the six numbers. Then participants received a $0.50 bonus and decided how much of it to bet on their number. If their number matched the winning number—which the computer randomly selected from 1 to 6 for each participant—they would receive 6 times the amount they wagered. Otherwise, they would simply lose the amount they wagered.
In Study 4, we gave participants the same lottery as in Study 3 but in a different format. In particular, we replaced the six numbers with six different colors on a roulette wheel: red, orange, yellow, green, blue, and purple. We also showed participants an example of the roulette wheel spinning and stopping before the choice manipulation. In this study, participants completed all outcome measures from Studies 1 to 3.
In Studies 5 to 7, we tried to see whether choice would induce an illusion of control when participants could not easily compute the probability of winning (Study 5) or when the probability of winning was truly ambiguous (Studies 6 and 7). In these three studies, we used wager amount as our primary dependent variable, and we also measured subjective confidence (using 7-point scales in Studies 5 and 6 and a 10-point scale in Study 7). In Study 5, the lottery involved harder-to-compute compound risk: Participants had to have two winning numbers to win. Specifically, participants were presented with six numbers, and they were told that half of them would be “winning numbers” and half would be “losing numbers.” They either chose or were randomly assigned two numbers out of the six. If both of their numbers were winning numbers, they would win the lottery and receive 6 times the amount they wagered. In Studies 6 and 7, the lottery offered truly ambiguous odds of winning. In Study 6, participants either chose or were randomly assigned a number from 1 to 6, and they were told that “at least one and at most five of them” were “winning numbers.” If their number was selected to be a winning number, they received 6 times the amount that they wagered. In Study 7, participants either chose or were randomly assigned a number from 1 to 10, and they were told that some of these numbers were winning numbers. If their number was selected to be a winning number, they received twice the amount that they wagered.
In Studies 8 and 9, we used chocolates as stimuli in an attempt to test whether the hypothesized effect might manifest for more subjective, preference-based stimuli (Botti & McGill, 2006). In Study 8, participants saw a picture of six identical-looking chocolates on their computer screen. Participants were told that although the chocolates looked identical on the outside, they had different flavors. In this hypothetical task, participants in the choice condition imagined choosing one of the chocolates themselves, whereas participants in the no-choice condition imagined receiving a randomly selected chocolate. Participants then responded to two questions: “How happy do you think you will be with the chocolate you chose/were given?” and “How tasty do you think the chocolate will be?” Responses were made on 9-point scales ranging from 1 (not at all) to 9 (extremely).
In Study 9, we replicated Study 8 in the laboratory using real chocolates. Participants were presented with four identical-looking chocolates in small clear cups with lids in front of them. They were told that the chocolates might have different flavors, although, in reality, all chocolates had the same flavor (i.e., plain dark chocolate). In this study, each participant was randomly assigned to the choice or no-choice condition. 1 Participants in the choice condition chose a chocolate to eat themselves, whereas those in the no-choice condition were randomly assigned a chocolate. After choosing or being assigned a chocolate, participants rated their predicted satisfaction with their chocolate: an average of how satisfied they would be with their chocolate and how much they would enjoy their chocolate. They made their responses on 9-point scales ranging from 1 (not at all) to 9 (extremely). In addition, participants rated their actual satisfaction with the chocolate after tasting it, using identical scales. To increase statistical power, we preregistered our plan to ask participants to indicate how much they like or dislike dark chocolate in general at the very beginning of the survey, on a scale ranging from 1 (dislike extremely) to 7 (like extremely). We included this variable as a covariate after mean-centering it.
Results
We analyzed participants’ responses using either ordinary least squares (OLS) regressions (choice: +.5 vs. no choice: −.5; choice first: +.5 vs. choice last: −.5) or independent-samples t tests, following our preregistered analysis plans. Table 1 displays the results. In Studies 1 to 7, participants who chose their own lottery options did not feel more likely to win than participants who were assigned lottery options. In Studies 8 and 9, participants who were given a choice among chocolates neither predicted nor experienced greater satisfaction with their chocolate than did participants who were given no choice. In other words, we did not find evidence that participants who had a choice felt more likely to achieve preferable outcomes than participants who had no choice.
In these studies, we found no effects of choice on participants’ subjective likelihood of achieving preferable outcomes. However, perhaps our outcome measures were not sensitive enough to pick up any difference that exists in reality. This seems unlikely because (a) many of these outcome measures mirrored those used in past research on the illusion of control, and (b) the estimated coefficients did not consistently have a positive sign. Nevertheless, to investigate this possibility, we conducted Studies 10 to 11, in which we examined whether our outcome measures responded to choice when it actually made preferable outcomes more likely.
Studies 10 and 11
Method
Participants
We conducted Studies 10 and 11 on MTurk. We requested 800 participants per study. In these studies, we applied the same exclusion criteria as in Studies 1 to 7. Across these two studies, we excluded 17 incomplete and 11 complete responses and achieved sample sizes that closely approximated our plans. The final sample size was 796 in Study 10 and 794 in Study 11. The average age was 39 years in both samples, and the percentage of women was 53% in Study 10 and 55% in Study 11.
Procedure
In Study 10, participants played a lottery, similar to those in Studies 1 to 7. In this study, we not only manipulated choice but also manipulated whether the choice actually made preferable outcomes more likely. Specifically, each participant was randomly assigned to one of four conditions in a 2 × 2 design: Choice (choice vs. no choice) × Control (illusory control vs. actual control). As in Studies 1 to 7, participants in the choice condition could choose one of six numbers, whereas those in the no-choice condition were randomly assigned a number. In the illusory-control condition, all six numbers had an identical 35% chance of winning. Once participants either chose or received their number, the computer randomly determined whether their number won, so all participants independently had a 35% chance of winning. As a result, participants who had a choice could not increase their chance of winning. However, in the actual-control condition, the six numbers had different probabilities of winning: Each number from 1 to 6 independently had a 10%, 20%, 30%, 40%, 50%, and 60% chance of winning, respectively. Once participants either chose or received their number, the computer randomly determined whether their number won, so those whose number was 1 had a 10% chance of winning, those whose number was 2 had a 20% chance of winning, and so on. Therefore, participants who had a choice could select the numbers that were more likely to win and increase their chance of winning. Before these outcomes were revealed, participants received a $0.50 bonus and decided how much of it to bet on their number. If their number won, they would receive 3 times the amount they wagered. Otherwise, they would lose the amount they wagered.
If this incentive-compatible measure showed no difference between the choice and the no-choice conditions in both the illusory-control and the actual-control conditions, it would suggest that our outcome measure was simply not sensitive enough to pick up any real difference. In contrast, if this outcome measure showed no difference in the illusory-control condition but showed a significant difference in the actual-control condition, that would indicate that the null effects in earlier studies did not simply result from the insensitivity of our outcome measures.
In Study 11, we tested the same hypothesis but using pictures of chocolates as stimuli, following similar procedures as in Study 8. Each participant was randomly assigned to one of four conditions in a 2 × 2 design: Choice (choice vs. no choice) × Control (illusory control vs. actual control). Participants in the choice condition imagined choosing a chocolate themselves, whereas those in the no-choice condition imagined receiving a randomly selected chocolate. In the illusory-control condition, participants saw a picture of six identical-looking chocolates that were unlabeled. Therefore, even though these participants were told which flavors were present in the set, having a choice would not make them more likely to select the preferable flavors. In the actual-control condition, participants saw the identical picture, but the chocolates were labeled with their flavors. As a result, having a choice would allow participants to select their preferred flavor. We assessed participants’ predicted satisfaction with their chocolate by asking and averaging how happy they thought they would be with their chocolate and how tasty they thought their chocolate would be. Responses were made on 9-point scales ranging from 1 (not at all) to 9 (extremely). Again, if this measure showed no difference between the choice and the no-choice participants in both the illusory-control and the actual-control conditions, that would indicate that our outcome measure was not sensitive enough. In contrast, if this measure showed no difference in the illusory-control condition but showed a significant difference in the actual-control condition, that would indicate that null effects did not simply arise from insensitive measures.
Results
In Study 10, we analyzed participants’ wagers using an OLS regression with the choice condition (choice: +.5 vs. no choice: −.5), control condition (actual control: +.5 vs. illusory control: −.5), and their two-way interaction. We found a significant interaction between the choice and the control conditions, t(792) = 2.04, p = .042 (see Fig. 1). Specifically, choice did not increase participants’ wagers when the lottery numbers had an identical probability of winning (choice: M = $0.18, SE = $0.01; no choice: M = $0.18, SE = $0.01), t(395) = 0.35, p = .724, d = 0.04, 95% CI = [−0.16, 0.23]. However, it did increase wagers when the numbers had different probabilities of winning (choice: M = $0.25, SE = $0.01; no choice: M = $0.20, SE = $0.01), t(397) = 3.15, p = .002, d = 0.31, 95% CI = [0.12, 0.51].
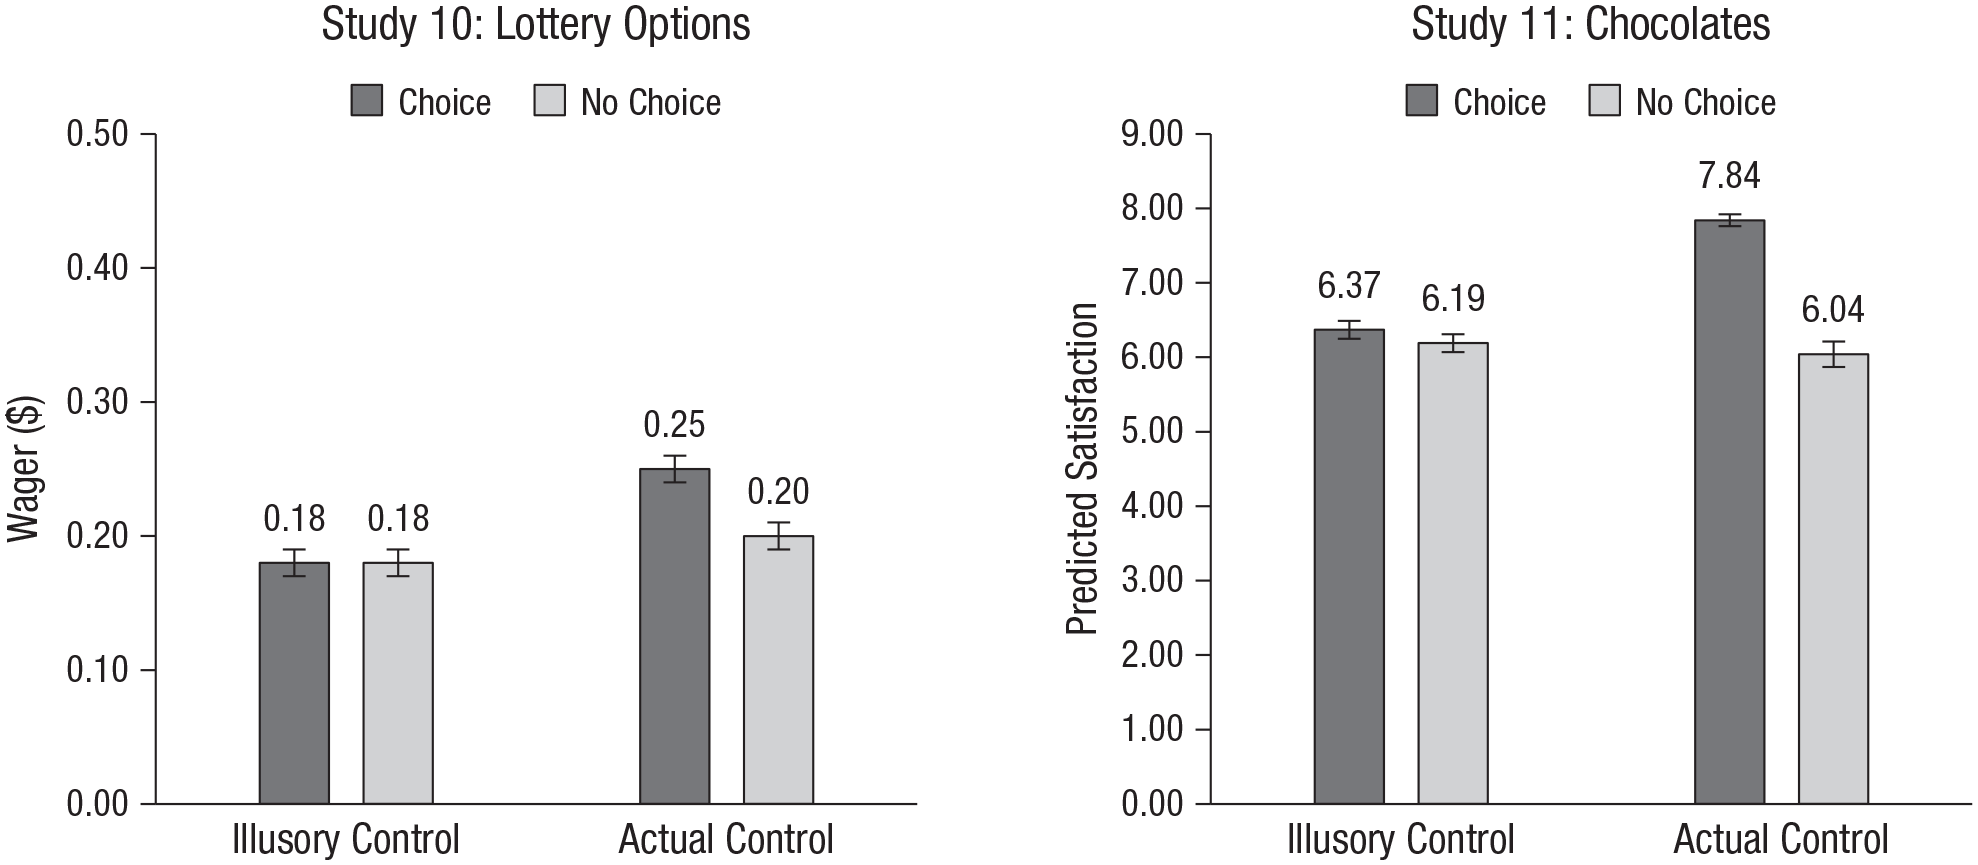
Mean wager (Study 10) and predicted satisfaction (Study 11) in the choice and the no-choice conditions, separately for the illusory-control and the actual-control conditions. Error bars indicate standard errors.
In Study 11, we analyzed participants’ predicted satisfaction with their chocolate using an OLS regression with the choice condition (choice: +.5 vs. no choice: −.5), control condition (actual control: +.5 vs. illusory control: −.5), and their two-way interaction. Again, we found a significant interaction between the choice and the control conditions, t(790) = 6.38, p < .001 (see Fig. 1). Choice did not increase participants’ predicted satisfaction with their chocolate when the chocolates were unlabeled (choice: M = 6.37, SE = 0.12; no choice: M = 6.19, SE = 0.12), t(396) = 1.02, p = .308, d = 0.10, 95% CI = [−0.09, 0.30], but it did when the chocolates were clearly labeled (choice: M = 7.84, SE = 0.08; no choice: M = 6.04, SE = 0.17), t(394) = 9.42, p < .001, d = 0.95, 95% CI = [0.74, 1.15].
Together, these results indicate that choice does not make people feel more likely to achieve preferable outcomes if all options are functionally identical. Yet it does confer such an advantage when the options are meaningfully differentiated, making choosers actually more likely to achieve the preferable outcomes. These findings rule out the alternative explanation that the null effects obtained across the 11 studies simply result from insensitive outcome measures.
Although we did not find evidence consistent with a choice-driven illusion of control across these contexts, there was at least one outcome measure we had not yet tried. We had not yet asked participants to estimate their probability of winning (Sloof & von Siemens, 2017). We had not used this measure because we thought that participants would feel compelled to report the true, objective probability of winning, causing the measure to be too insensitive to capture a choice-driven illusion of control. Nevertheless, after 11 failed attempts, we decided to try it.
Studies 12 to 15
Method
Participants
We conducted Studies 12 to 15 on MTurk. We requested 800 participants per study in Studies 12 to 14 and 1,200 in Study 15. In these studies, we excluded responses from participants who did not complete the entire survey or did not submit their work on MTurk to receive compensation. In case any participant completed the survey more than once, we excluded responses with later start times. Across Studies 12 to 15, we excluded 62 incomplete and nine complete responses, and we achieved sample sizes that closely approximated our plans (Table 2). In these studies, the average age ranged from 37 to 40 years, and the percentage of women ranged from 53% to 55%.
Summary of the Results From Studies 12 to 15
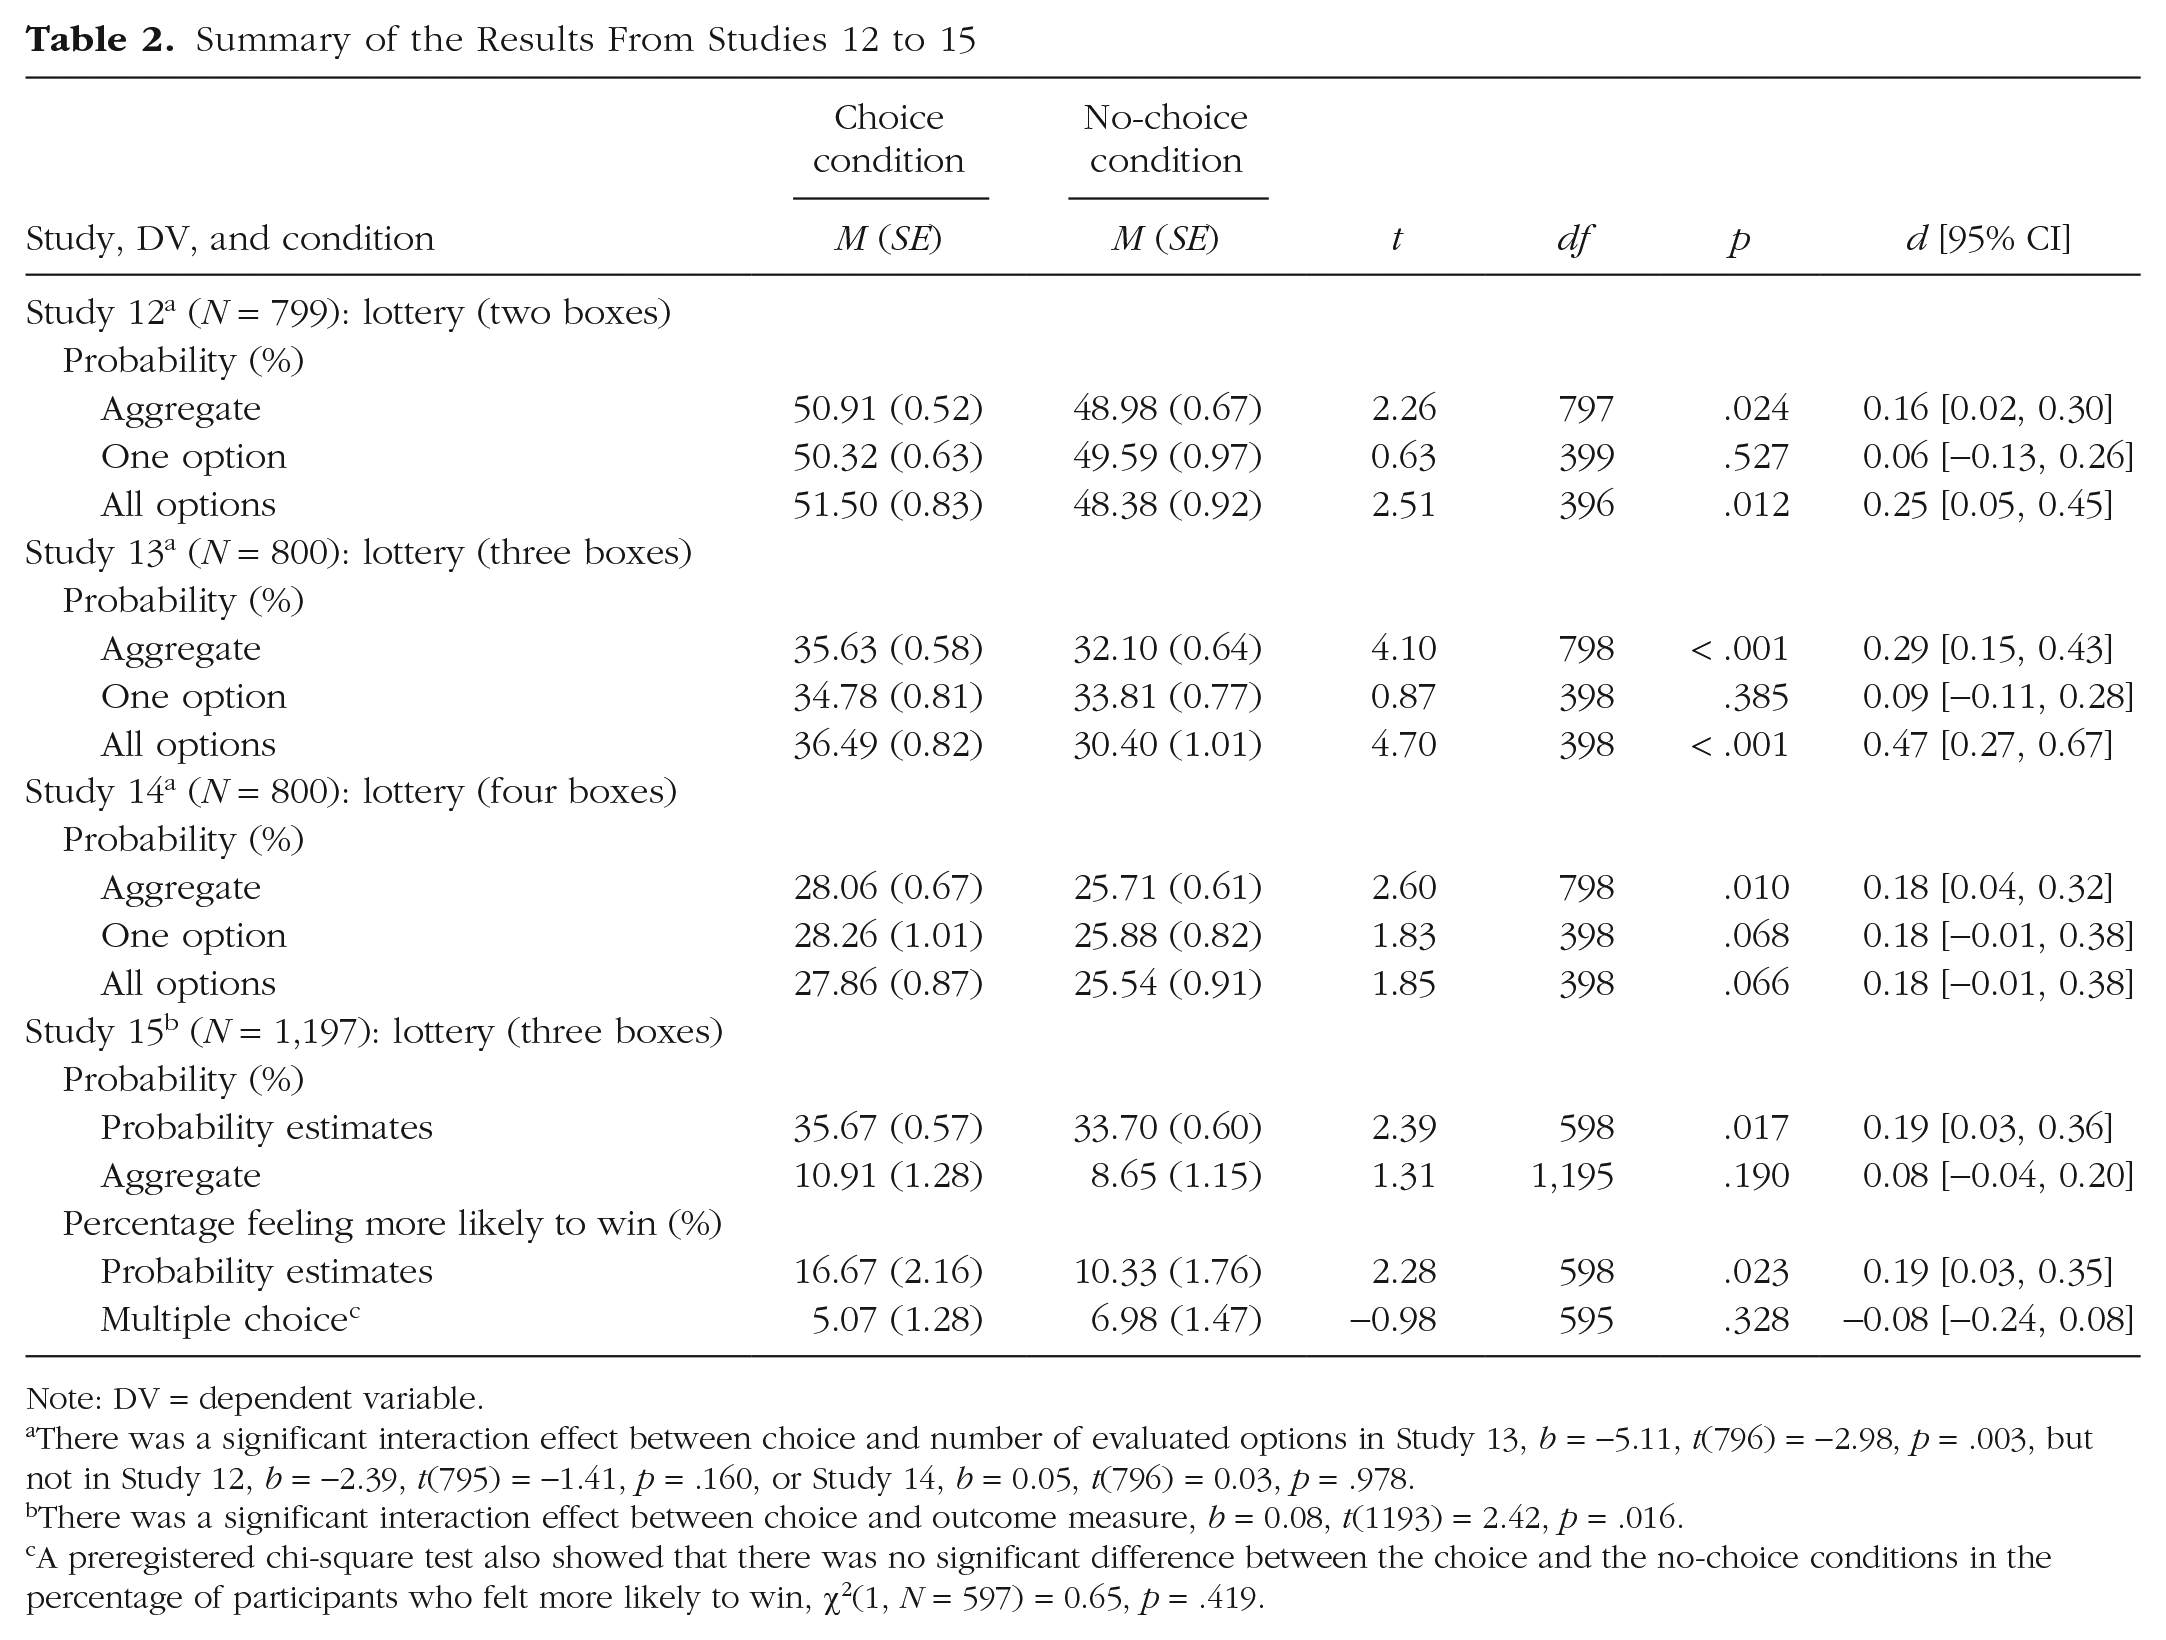
Note: DV = dependent variable.
There was a significant interaction effect between choice and number of evaluated options in Study 13, b = −5.11, t(796) = −2.98, p = .003, but not in Study 12, b = −2.39, t(795) = −1.41, p = .160, or Study 14, b = 0.05, t(796) = 0.03, p = .978.
There was a significant interaction effect between choice and outcome measure, b = 0.08, t(1193) = 2.42, p = .016.
A preregistered chi-square test also showed that there was no significant difference between the choice and the no-choice conditions in the percentage of participants who felt more likely to win, χ2(1, N = 597) = 0.65, p = .419.
Procedure
In Studies 12, 13, and 14, participants played a lottery with two, three, and four identical-looking boxes, respectively (Sloof & von Siemens, 2017). In these studies, each participant was randomly assigned to one of four conditions in a 2 × 2 design: Choice (choice vs. no choice) × Number of Evaluated Options (one option vs. all options; see Fig. 2). Participants saw a picture of identical-looking boxes and learned that one of the boxes contained a $1.00 bonus. Participants in the choice condition chose one of the boxes, but participants in the no-choice condition were randomly assigned one of the boxes. If their box contained the bonus, they would receive the bonus. In addition to the choice manipulation, we also varied the number of options evaluated by participants (i.e., one vs. all) to see whether this might moderate the effects of choice. Specifically, participants in the one-option condition saw a picture of the identical-looking boxes, with their chosen or assigned box highlighted, and read the following: “Please let us know how likely it seems, to you, that this box contains the $1.00 bonus.” They responded to this question by entering a probability estimate for their box, which could range from 0% to 100%. Participants in the all-options condition saw a picture of the identical-looking boxes, with their chosen or assigned box highlighted, and read the following: “Please let us know how likely it seems, to you, that each of these boxes contains the $1.00 bonus.” They responded to this question by entering a probability estimate for each of the boxes, which could individually range from 0% to 100% but collectively had to add up to 100%. The dependent variable in these studies was the probability estimate for one’s own box, representing one’s subjective probability of winning the lottery.

Summary of the 2 × 2 design in Study 12: Choice (choice vs. no choice) × Number of Evaluated Options (one option vs. all options). Participants in the choice condition chose one of the boxes, whereas participants in the no-choice condition were randomly assigned one of the boxes. In all conditions, participants saw a picture of identical-looking boxes, with their chosen or assigned box highlighted. In the one-option condition, they responded to the question at the bottom of the screen by entering a probability estimate for their box, which could range from 0% to 100%; in the all-options condition, they responded to the question by entering a probability estimate for each of the boxes, which could individually range from 0% to 100% but collectively had to add up to 100%.
In Study 15, we used a similar lottery with three boxes but with two changes. First, we emphasized the randomness of the lottery by explicitly informing participants that “the computer will randomly select the winning box” and that “each box will have an equal chance of being selected as the winning box.” Second, we formatted the response options in two ways. Specifically, each participant in this study was randomly assigned to one of four conditions in a 2 × 2 design: Choice (choice vs. no choice) × Outcome Measure (probability estimates vs. multiple choice). Participants in the choice and no-choice conditions received the same choice manipulation as in Studies 12 to 14. Participants in the probability-estimates condition saw a picture of the three boxes, with their box highlighted, and read the following: “How likely does it seem to you that each of these boxes will be randomly selected as the winning box?” They answered this question by entering a probability estimate for each of the three boxes, which could individually range from 0% to 100% but collectively had to add up to 100%. Participants in the multiple-choice condition saw a picture of the three boxes, with their box highlighted, and read the following: “How likely does it seem to you that this box will be randomly selected as the winning box?” They answered this question by choosing one of three options: more likely, equally likely, or less likely to be selected, compared with the other boxes. In this study, we preregistered our plan to analyze the dependent variables in three different ways. First, to compare the choice and the no-choice conditions within the probability-estimates condition, we analyzed participants’ probability estimate for their selected box. Second, to compare the choice and the no-choice conditions within the multiple-choice condition, we analyzed the percentage of participants who indicated that their box was more likely to be selected than the other boxes. Third, to analyze the data all together under one measure, we transformed the probability estimates such that any estimate greater than 34% was recorded as “more likely to be selected as the winning box.” Then we analyzed the percentage of participants who indicated that their box was more likely to be selected across all four conditions.
Results
Table 2 summarizes the results across Studies 12 to 15. We analyzed participants’ responses using OLS regressions (choice: +.5 vs. no choice: −.5; one option: +.5 vs. all options: −.5; probability estimates: +.5 vs. multiple choice: −.5), following our preregistered analysis plans. Across Studies 12 to 15, we found that participants who chose their own box estimated a higher probability of winning for their box than participants who were randomly assigned a box, which appears consistent with a choice-driven illusion of control. This pattern occurred more consistently when participants evaluated all options rather than a single option (Studies 12–14) and with only a probability-estimate measure and not an equivalent multiple-choice measure (Study 15).
It is worth noting that although these effects appear significant in aggregate, they do not represent the majority of the participants’ beliefs. In fact, 85%, 76%, 85%, and 80% of all participants in Studies 12 to 15 responded that their selected box was no more or less likely to win than would be expected by chance. In addition, 84%, 73%, 82%, and 77% of participants who estimated the probability for each and every box in the all-options or the probability-estimates conditions in Studies 12 to 15 indicated that all boxes were equally likely to win. In other words, these effects were driven by a small subset of the participants who believed that some boxes were more or less likely to win than expected by chance.
Nevertheless, because we found evidence that participants who had a choice estimated a higher probability of winning than those who did not have a choice in aggregate, we next sought to determine whether choice caused this illusion or simply reflected participants’ preexisting beliefs. To understand the difference, consider the two possible cases in Figure 3. If participants initially believe that all options are equally likely to win but later come to believe that their selected option is more likely to win after choosing it, then one could argue that choice causes an illusion of control (Fig. 3a). Alternatively, if participants incorrectly believe from the beginning that some options are more likely to win, and hence feel more likely to win after choosing—because they get to select the option they consider more likely to win—then choice would be merely reflecting preexisting beliefs (Fig. 3b).
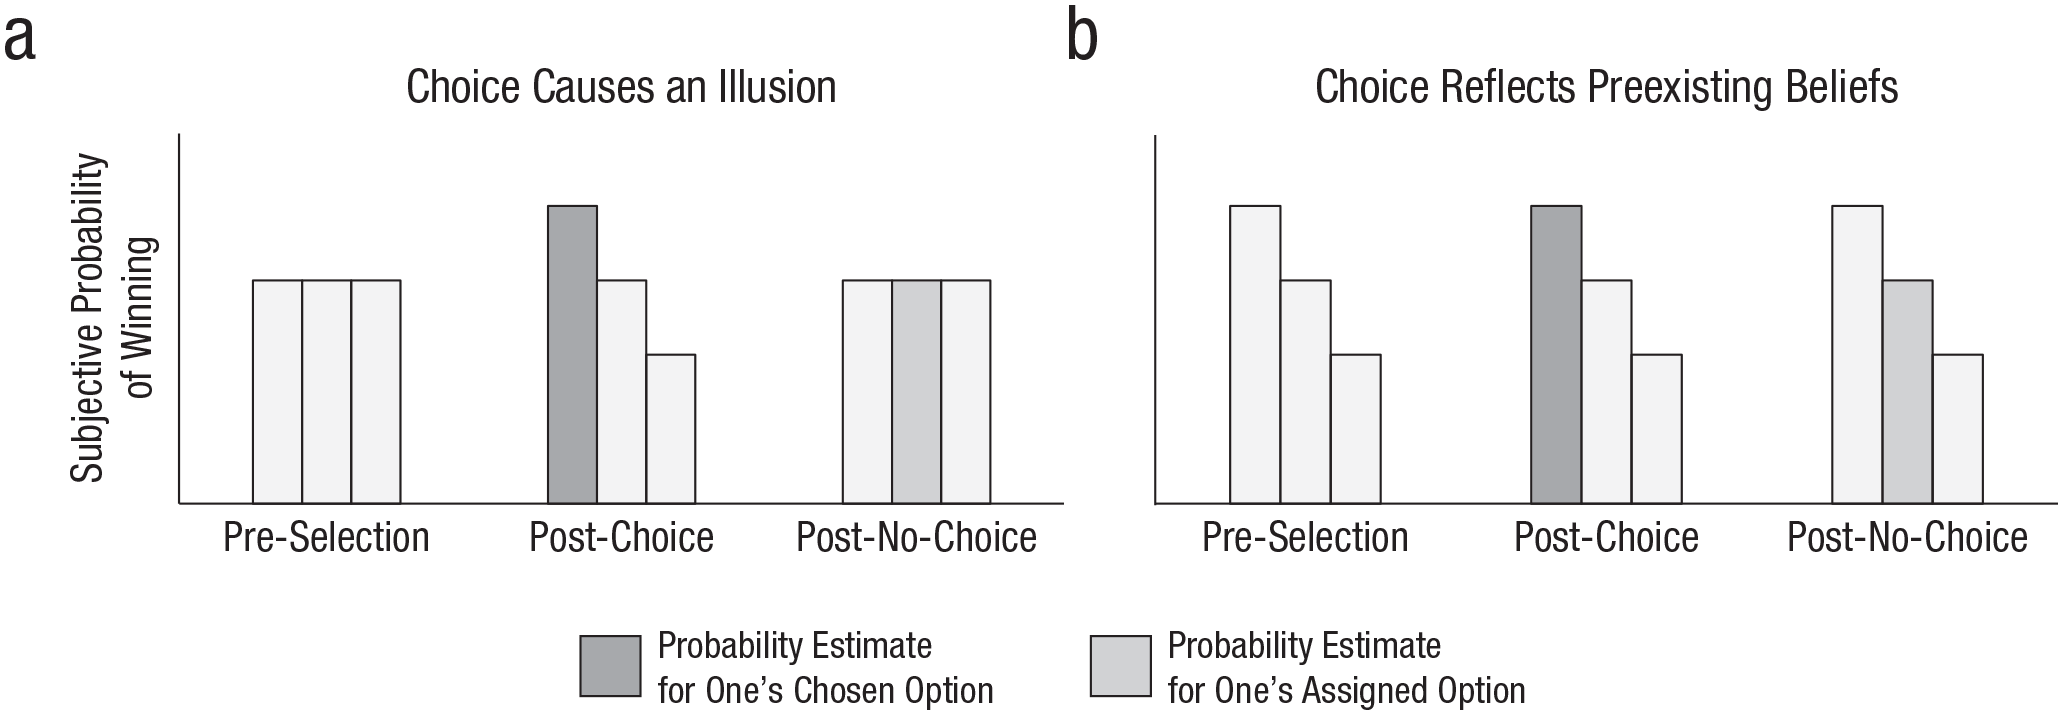
Two possible effects of choice: (a) choice causes an illusion, and (b) choice reflects preexisting beliefs. The three bars in each group represent the probability estimates for the options that one considers most likely, second most likely, and least likely to win among three lottery options, in succession from left to right. Predictions are shown separately for the pre-selection, post-choice, and post-no-choice conditions.
As shown in Figure 3, we cannot distinguish these two cases by simply comparing the probability estimates for participants’ chosen versus assigned options, because they can lead to the exact same patterns. Instead, we need to compare the probability estimate for the option that each participant considers most likely to win in the pre-selection, post-choice, and post-no-choice conditions (i.e., the leftmost bar in each group). If choice causes an illusion of control, this probability should be higher in the post-choice condition than in the other two conditions. If choice merely reflects a preexisting illusion, this probability will not be higher than in the other two conditions.
In Studies 12 to 15, participants assigned to the all-options condition or the probability-estimates condition estimated the winning probability for each and every box. This allowed us to explore whether the average probability estimate for the box that each participant considered most likely to win was higher in the choice condition than in the no-choice condition. As shown in Figure 4, we found no evidence for this: In none of these studies was this probability higher in the choice condition than in the no-choice condition—t(396) = −1.00, p = .320, d = −0.10, 95% CI = [−0.30, 0.10] in Study 12; t(398) = −2.44, p = .015, d = −0.24, 95% CI = [−0.44, −0.05] in Study 13; t(398) = −1.20, p = .230, d = −0.12, 95% CI = [−0.32, 0.08] in Study 14; and t(598) = 0.19, p = .850, d = 0.02, 95% CI = [−0.14, 0.18] in Study 15. In Study 13, the opposite was true, though it did not replicate in other studies. These exploratory analyses suggest that choice is reflective of some participants’ preexisting beliefs rather than a cause of an illusion of control.
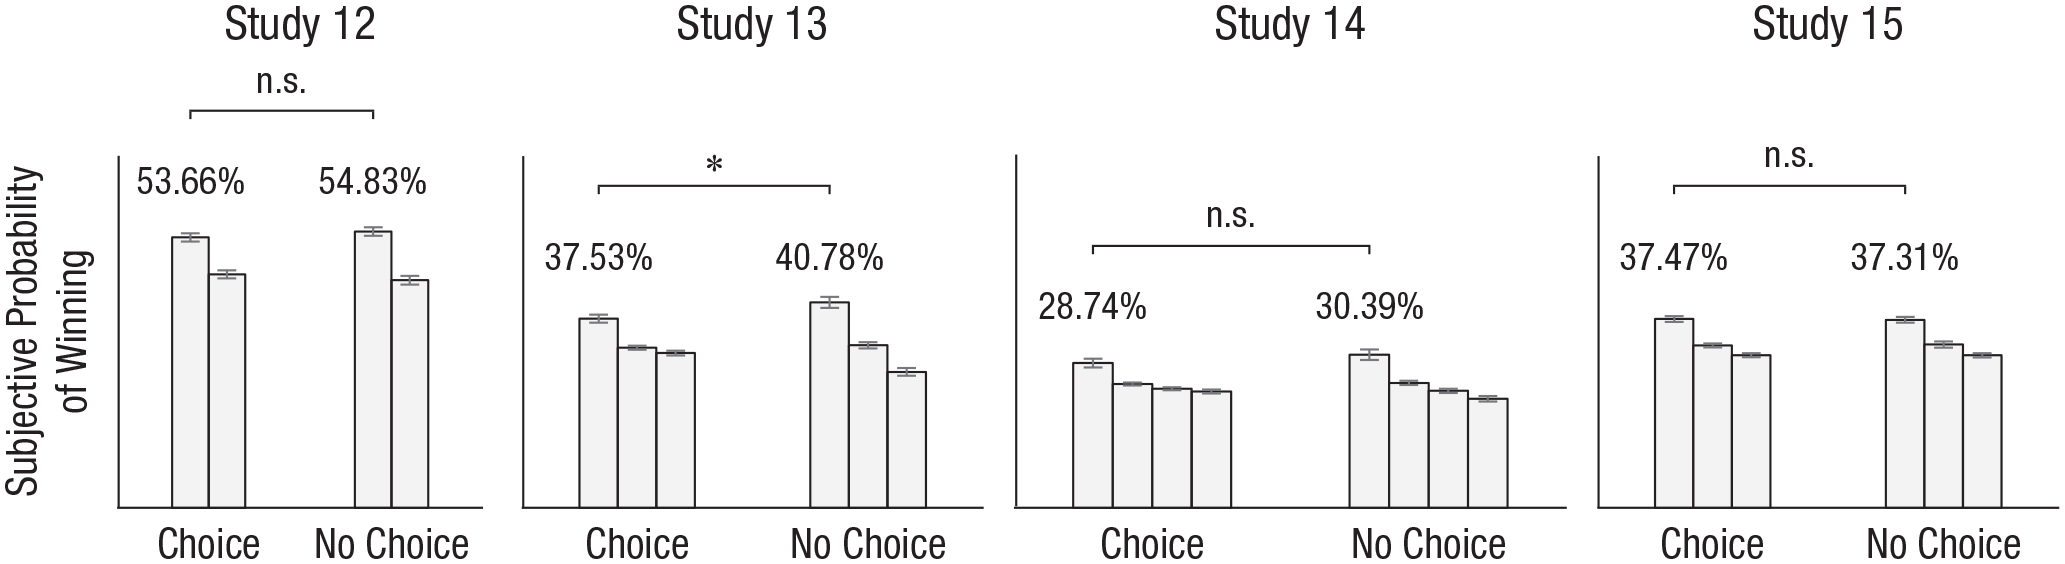
Summary of the exploratory analyses from Studies 12 through 15. The bars in each group represent the average probability estimates (across individuals) for the boxes that were considered most likely to least likely to win, in succession from left to right. The average probability estimate is given for the box that each participant considered most likely to win (i.e., the leftmost bar in each group). Error bars indicate standard errors. The asterisk represents a significant difference (p < .05) between estimates in the choice and no-choice conditions.
To examine this more thoroughly, we next sought to determine, with a preregistered analysis plan, whether this probability differed before and after choosing, as well as after choosing and after being assigned an option. If choice causes an illusion of control, this probability should be higher after choosing. We tested this in Studies 16 and 17.
Studies 16 and 17
Method
Participants
We conducted Studies 16 and 17 on MTurk. We requested 600 participants per study. We applied the same exclusion criteria as in Studies 12 to 15. Across these two studies, we excluded 29 incomplete and three complete responses. The final sample size was 599 in Study 16 and 598 in Study 17. In Studies 16 and 17, the average age was 36 and 39 years, respectively, and the percentage of women was 52% and 54%, respectively.
Procedure
In Studies 16 and 17, we again used a lottery with three boxes. The procedure was nearly identical to the procedure in Study 15, except that each participant in these studies was randomly assigned to one of three conditions: pre-selection, post-choice, and post-no-choice. All participants learned that they would play a lottery in which one of the boxes would be theirs, and they would receive a bonus if their box was selected as the winning box. Participants in the pre-selection condition estimated the probabilities for the boxes before choosing or being randomly assigned a box. Participants in the post-choice condition did so after choosing a box, and participants in the post-no-choice condition did so after being randomly assigned a box. The only difference between Studies 16 and 17 was in the image of the boxes that participants saw when estimating the probabilities. In Study 16, all participants saw an identical image of the boxes, which did not highlight participants’ chosen or assigned box, to prevent any potential confounds across conditions. In Study 17, participants in the post-choice and the post-no-choice conditions saw an image that highlighted their chosen or assigned box, consistent with Studies 12 to 15. We preregistered our plan to analyze two outcome measures in these studies: the probability estimate for the box that each participant considered most likely to win (comparing all three conditions) and the probability estimate for each participant’s selected box (comparing the post-choice and the post-no-choice conditions only).
Results
Figure 5 displays the distributions of participants’ subjective probabilities of winning across the boxes in the pre-selection, post-choice, and post-no-choice conditions in Studies 16 and 17. First, it is worth noting that, even though we explicitly informed participants that all boxes had an identical chance of winning, a sizable minority of participants reported preexisting illusory beliefs. Specifically, 33% of participants in Study 16 and 26% of participants in Study 17 reported an unequal subjective probability distribution (i.e., probability estimates more extreme than 33%–34% per box) before even choosing or being assigned a box. Next, following our preregistered analysis plans, we analyzed participants’ responses using independent samples t tests. In both Studies 16 and 17, the average probability estimate for the box that each participant considered most likely to win was not significantly higher in the post-choice condition than in the other conditions. If anything, it was either directionally or significantly lower in the post-choice condition than in the other conditions—post-choice vs. pre-selection: t(399) = −1.32, p = .187, d = −0.13, 95% CI = [−0.33, 0.06] and post-choice vs. post-no-choice: t(396) = −1.11, p = .269, d = −0.11, 95% CI = [−0.31, 0.09] in Study 16; post-choice vs. pre-selection: t(400) = −0.60, p = .548, d = −0.06, 95% CI = [−0.26, 0.14] and post-choice vs. post-no-choice: t(395) = −2.47, p = .014, d = −0.25, 95% CI = [−0.45, −0.05] in Study 17. Interestingly, in these studies, the probability estimate for one’s selected box did not significantly differ between the post-choice and the post-no-choice conditions, but the effects were in the same direction as in Studies 12 to 15—post-choice: M = 35.60%, SE = 0.76%, post-no-choice: M = 34.61%, SE = 0.99%, t(396) = 0.80, p = .425, d = 0.08, 95% CI = [−0.12, 0.28] in Study 16; post-choice: M = 36.24%, SE = 0.82%, post-no-choice: M = 35.80%, SE = 1.10%, t(395) = 0.33, p = .744, d = 0.03, 95% CI = [−0.16, 0.23] in Study 17.
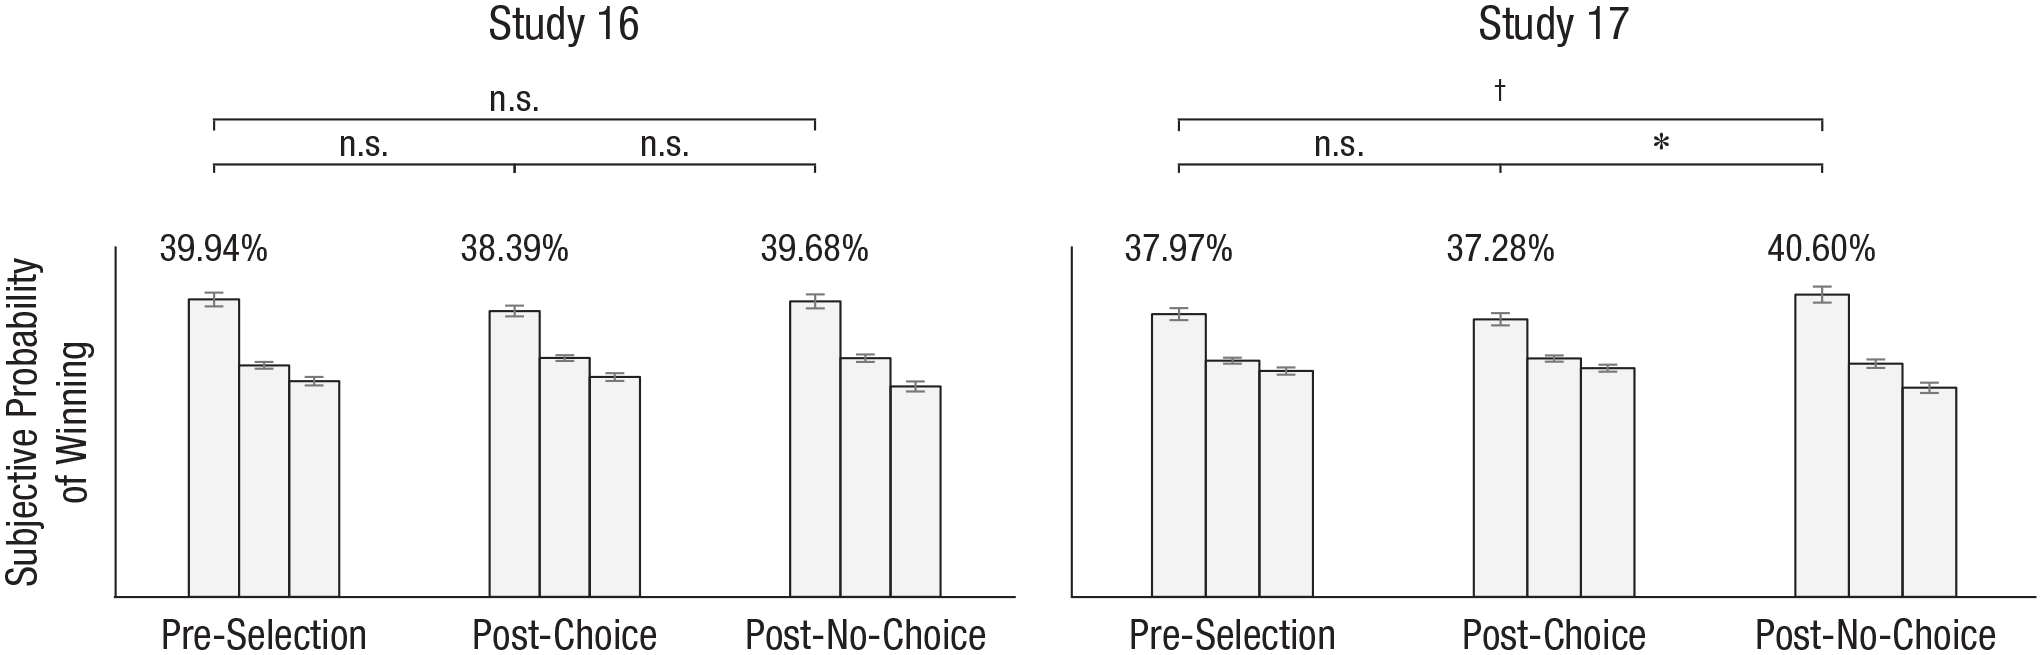
Summary of the results from Studies 16 and 17. The three bars in each group represent the average probability estimates (across individuals) for boxes that were considered most likely, second most likely, and least likely to win, in succession from left to right. The average probability estimate is given for the box that each participant considered most likely to win (i.e., the leftmost bar in each group). Error bars indicate standard errors. Symbols represent a significant difference (*p < .05) and marginally significant difference (†p < .10) between the corresponding conditions.
General Discussion
Across 17 studies, we found no evidence that choice causes an illusion of control. Choice rarely made people feel more likely to achieve preferable outcomes when all options were functionally identical, whether we used different outcome measures (Studies 1–3), made the process visual (Study 4), varied the levels of uncertainty (Studies 5–7), or increased the subjectivity of the outcome evaluations (Studies 8 and 9). Choice had such effects only when it conferred actual control (Studies 10 and 11). In the rare cases in which choosers felt more likely to achieve preferable outcomes (Studies 12–15), choice seemed to reflect people’s preexisting beliefs rather than cause an illusion (Studies 16 and 17).
Our findings that a purported effect of choice results from an alternative account shares similarities with other reinvestigations of classic findings. Specifically, Chen and Risen (2010) showed that what looks like a choice-driven attitude change via cognitive-dissonance reduction in fact occurs because the choice is used to select people with different attitudes in the first place. Similarly, Tong, Feiler, and Ivantsova (2018) showed that what appears as choice-driven overoptimism via motivated reasoning emerges because choice reveals options that people already overestimate. Likewise, we revisited the highly influential and widely accepted phenomenon that choice causes an illusion of control. We found that such patterns rarely occur in cleanly designed experiments, and when they do, they are due to the choice reflecting people’s preexisting beliefs rather than causing an illusion. Together, this line of work suggests that some purported effects of choice may be due to the choice acting as a selection mechanism—among either different participants or different options—rather than as a cause of such effects.
Limitations
Despite our attempts to provide a comprehensive investigation, multiple questions remain.
First, our research does not address what might moderate the difference between the nonsignificant (Studies 1–11) and the significant (Studies 12–15) effects of choice. One possibility is that the probability estimates used in the latter studies are more sensitive than the other measures. In fact, our result from Study 15, which directly compared the probability estimates and multiple-choice measures, seems consistent with this conjecture. However, the nonsignificant coefficients in Studies 1 to 9 do not have a consistently positive sign, which is not what one would expect if the measures were merely less sensitive. Moreover, Studies 10 and 11 directly show that these measures were sensitive enough to respond when the choice made the preferable outcomes actually more likely. Another possibility is that evaluating multiple options in Studies 12 to 15 makes people more likely to develop normatively incorrect beliefs and hence more likely to show patterns that appear consistent with a choice-driven illusion of control. When one evaluates multiple options, there is a greater number of ways to express normatively incorrect beliefs (vs. only one way to express the normatively correct belief) than when one evaluates a single option, which might facilitate such beliefs. However, our results from Studies 12 to 14 indicate that the number of evaluated options does not always moderate the effect of choice. Although our research did not address these puzzling discrepancies, subsequent research could examine what may explain them.
Second, we do not know what led a subset of participants to demonstrate preexisting illusions, even when we explicitly informed them that all options have identical prospects (Studies 16 and 17). It is possible that certain individuals were prone to forming these beliefs because of past experiences, superstitious thinking, or distrust, but our research did not address what causes these beliefs or whether they are generalizable to people outside of our samples (Harris & Osman, 2012; Risen, 2016, Sharpe, Adair, & Roese, 1992). Future research could examine what individual or situational factors can lead people to develop such beliefs in the face of instructions that contradict them.
Third, our research focused on choice and thus did not address other factors that might truly cause an illusion of control. Previous research suggests additional factors that might cause an illusion of control (e.g., competition, familiarity, active involvement; Langer, 1975; Martinez et al., 2009). Although our research suggests that choice is unlikely to cause an illusion of control itself, it is possible that these other factors could.
In conclusion, past research suggests that choice can be powerful even without conferring actual control because it creates an illusion of control. Our research suggests a more sober perspective on the value of choice: Choice simply enables people to get what they want.
Supplemental Material
sj-docx-1-pss-10.1177_0956797620958009 – Supplemental material for Does Choice Cause an Illusion of Control?
Supplemental material, sj-docx-1-pss-10.1177_0956797620958009 for Does Choice Cause an Illusion of Control? by Joowon Klusowski, Deborah A. Small and Joseph P. Simmons in Psychological Science
Footnotes
Transparency
Action Editor: Sachiko Kinoshita
Editor: Patricia J. Bauer
Author Contributions
J. Klusowski collected and analyzed the data under the supervision of D. A. Small and J. P. Simmons. J. Klusowski drafted the initial manuscript. D. A. Small and J. P. Simmons provided critical revisions. All authors approved the final version of the manuscript for submission.
Notes
References
Supplementary Material
Please find the following supplemental material available below.
For Open Access articles published under a Creative Commons License, all supplemental material carries the same license as the article it is associated with.
For non-Open Access articles published, all supplemental material carries a non-exclusive license, and permission requests for re-use of supplemental material or any part of supplemental material shall be sent directly to the copyright owner as specified in the copyright notice associated with the article.